Business Capstone Project: A Year 11 Executive Meeting Report
VerifiedAdded on 2023/06/11
|18
|3040
|80
Report
AI Summary
This report provides an executive summary of H Company's business capstone project, focusing on its cost leadership strategy for growth and development. It highlights key outcomes such as Earnings per Share (EPS), Return on Equity (ROE), Net Profit Margin, and Return on Investment (ROI). The report analyzes changes in profits and revenues from Year 10 to Year 11, along with the effects on shareholder wealth due to share price fluctuations. The main report includes a financial performance analysis with key performance indicators, comments on financial results, liquidity ratios, and the company's cash position. It also covers operational aspects such as stock levels, production levels, and worker productivity, as well as customer marketing strategies and resource learning. The report concludes with an overview of the company's strategic achievements and future challenges.
Business Capstone Project
1
1
Paraphrase This Document
Need a fresh take? Get an instant paraphrase of this document with our AI Paraphraser
Table of Contents
Executive Summary.......................................................................................................................3
Main Report...................................................................................................................................7
a. Financial Performance..........................................................................................................7
b. Operations............................................................................................................................10
c. Customer Marketing............................................................................................................12
d. Resources/ Learning............................................................................................................14
Conclusion....................................................................................................................................15
References.....................................................................................................................................17
2
Executive Summary
In this report, H Company uses the cost leadership strategy for their business growth and
development. The cost leadership is an effective strategy for a company which uses by the
management to increase efficiencies and decrease production costs below the industry average or
their closest competitor. This strategy helps the management to produce the least expensive
goods and reduce costs in industry or in a market in an effort to achieve more market share. Cost
leadership is a part of the marketing strategy. The main reason behind to use this strategy by the
company to create a low cost of operation within their niche (Jermias, Gani, & Juliana, 2018).
Selecting the right competitive strategy is vital to the business unit as well as corporate and also
for products and or services strategy development. Following there are three types of strategy
which are listed below:
Cost Strategy
Focused Strategy
Differentiation Strategy
In this report, H Company selected Cost Strategy or Cost Leadership Strategy to achieve the
following points which are listed below:
High capacity utilization
An effective process of production
High efficiency or productivity
Use of power of bargaining to negotiate the least price for production units
Effective channels of distribution
Lean methods of production
Leading cost leadership brands have gotten a major success by introducing revolutionary
business models built on a single base – the lowest possible prices for a given perceived value
(Linton & Kask, 2017).
3
⊘ This is a preview!⊘
Do you want full access?
Subscribe today to unlock all pages.
Trusted by 1+ million students worldwide
Key Outcomes
Earnings per Share (EPS): Earnings per share is defined as net income divided by the number
of shares of stock issued to stockholders. If the company has a higher EPS value then it indicates
that the company has to earn more net income per share of stock outstanding. EPS also helps the
investors in taking a decision whether they invest their money or not. It is an effective outcome
to investigate company performance in the market (Idawati & Wahyudi, 2015).
Return on Equity (ROE): It is defined as the net income of a company divided by the average
amount of shareholder’s investment in equity shares. Return on Equity measures a company’s
profitability and also helps the investors to take various decisions regarding investments. The
investors can use ROE to distinguish between companies that are profit burners and those that
are profit creators. If the outcome is higher than it indicates that the company is earning more
profit after- tax (Weber, 2018).
Net Profit Margin: It is defined as net income (incurred after tax) divided by net revenues
received from footwear sales after exchange rate adjustments. A company’s net income or profit
margin shows the percentage of revenues that close down on the bottom line. If the company’s
net income is bigger than it is better for the company’s business operations and also for the
investors (Lacinka, Fathoni, & Gagah, 2018).
Return on Investment (ROI): Return on investment measures the profit or loss obtained on an
investment relative to the amount of money invested. It is used by the company for financial
decisions, to compare the efficiency of different investments and also for the company’s
profitability comparison. It is mostly used to measure as net income divided by the original
investment cost. Is the ROI outcome is higher than it is a benefit for the investors and also for the
company (Psacharopoulos & Patrinos, 2018).
4
Paraphrase This Document
Need a fresh take? Get an instant paraphrase of this document with our AI Paraphraser
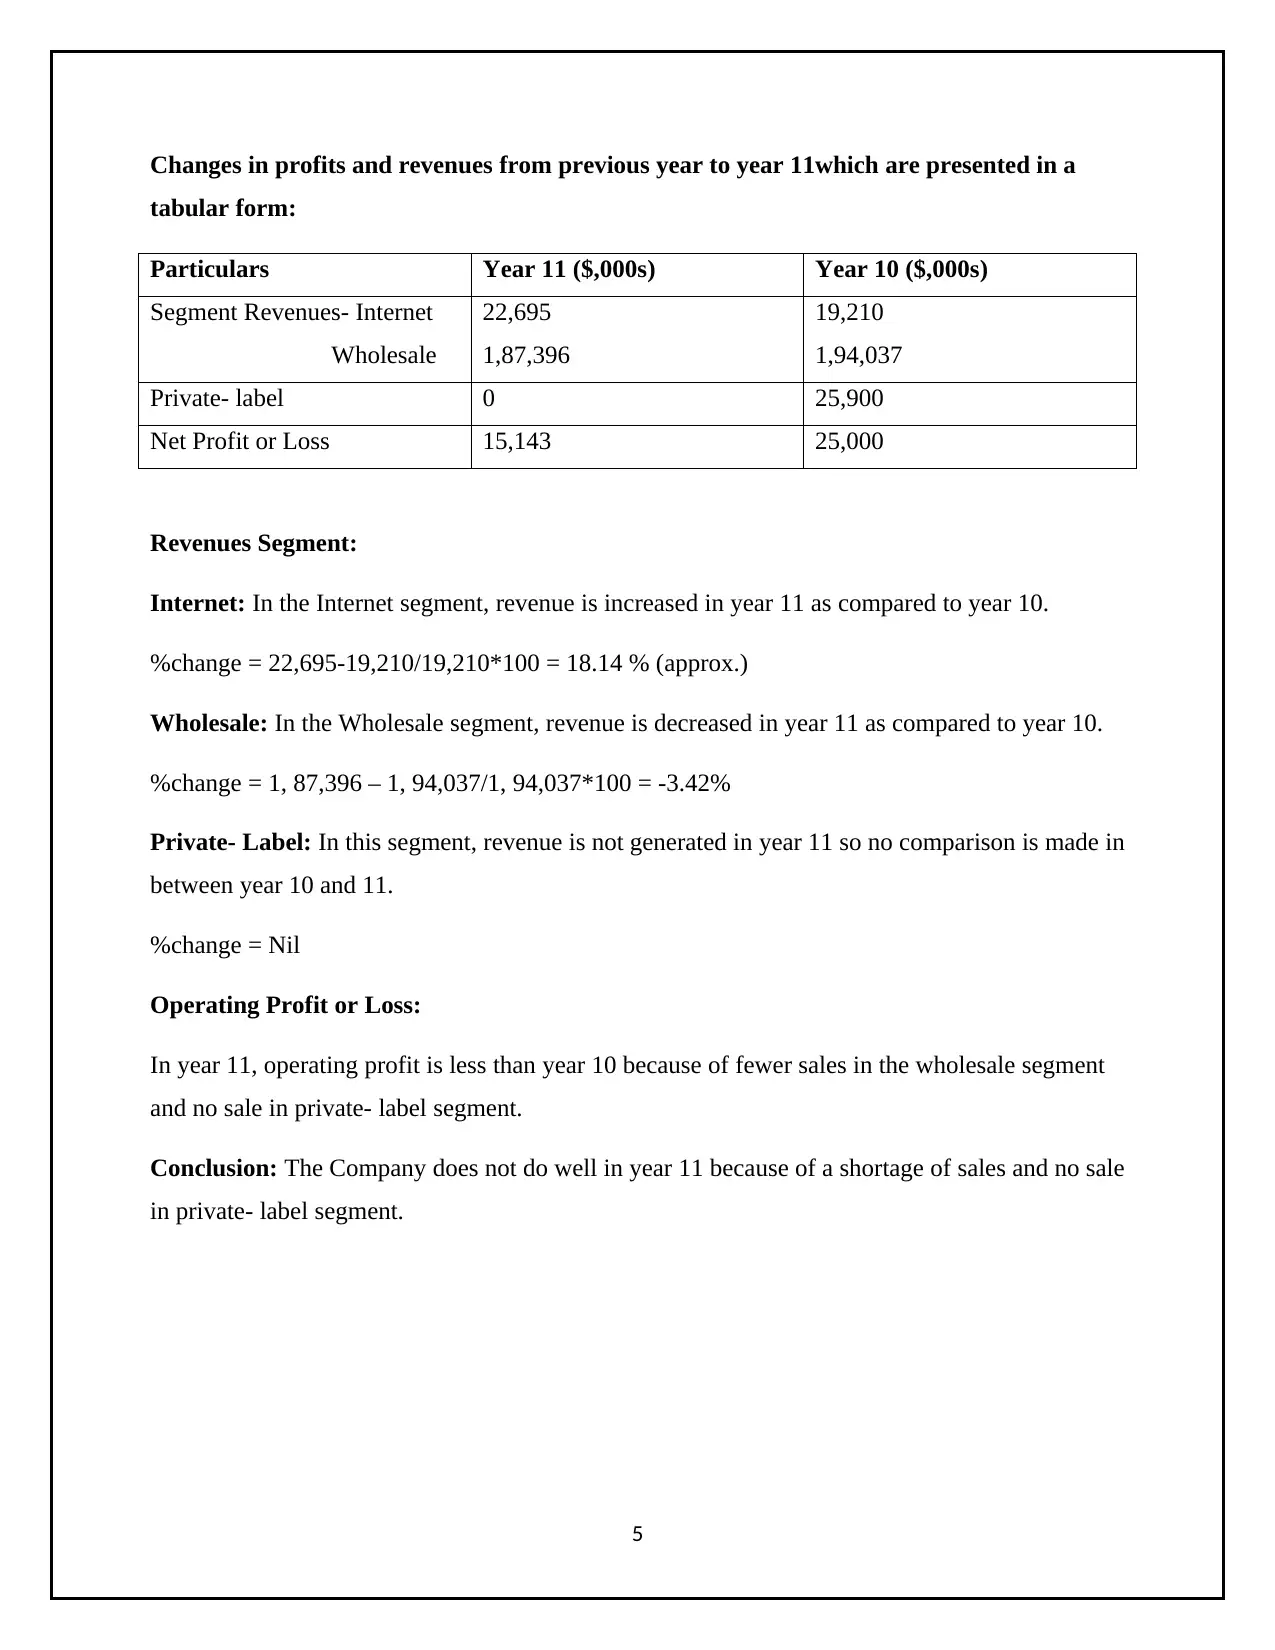
Changes in profits and revenues from previous year to year 11which are presented in a
tabular form:
Particulars Year 11 ($,000s) Year 10 ($,000s)
Segment Revenues- Internet
Wholesale
22,695
1,87,396
19,210
1,94,037
Private- label 0 25,900
Net Profit or Loss 15,143 25,000
Revenues Segment:
Internet: In the Internet segment, revenue is increased in year 11 as compared to year 10.
%change = 22,695-19,210/19,210*100 = 18.14 % (approx.)
Wholesale: In the Wholesale segment, revenue is decreased in year 11 as compared to year 10.
%change = 1, 87,396 – 1, 94,037/1, 94,037*100 = -3.42%
Private- Label: In this segment, revenue is not generated in year 11 so no comparison is made in
between year 10 and 11.
%change = Nil
Operating Profit or Loss:
In year 11, operating profit is less than year 10 because of fewer sales in the wholesale segment
and no sale in private- label segment.
Conclusion: The Company does not do well in year 11 because of a shortage of sales and no sale
in private- label segment.
5
Changes in share price and effect on shareholders wealth
If there is a change in share price will effect on shareholders wealth in a positive and negative
manner. The share price of a company will fluctuate due to a change in government policies,
market trends, and the company’s internal policies. The wealth of shareholders will be an effect
due to the change in share price. Some time it will increase or decrease due to a change in
circumstances.
6
⊘ This is a preview!⊘
Do you want full access?
Subscribe today to unlock all pages.
Trusted by 1+ million students worldwide
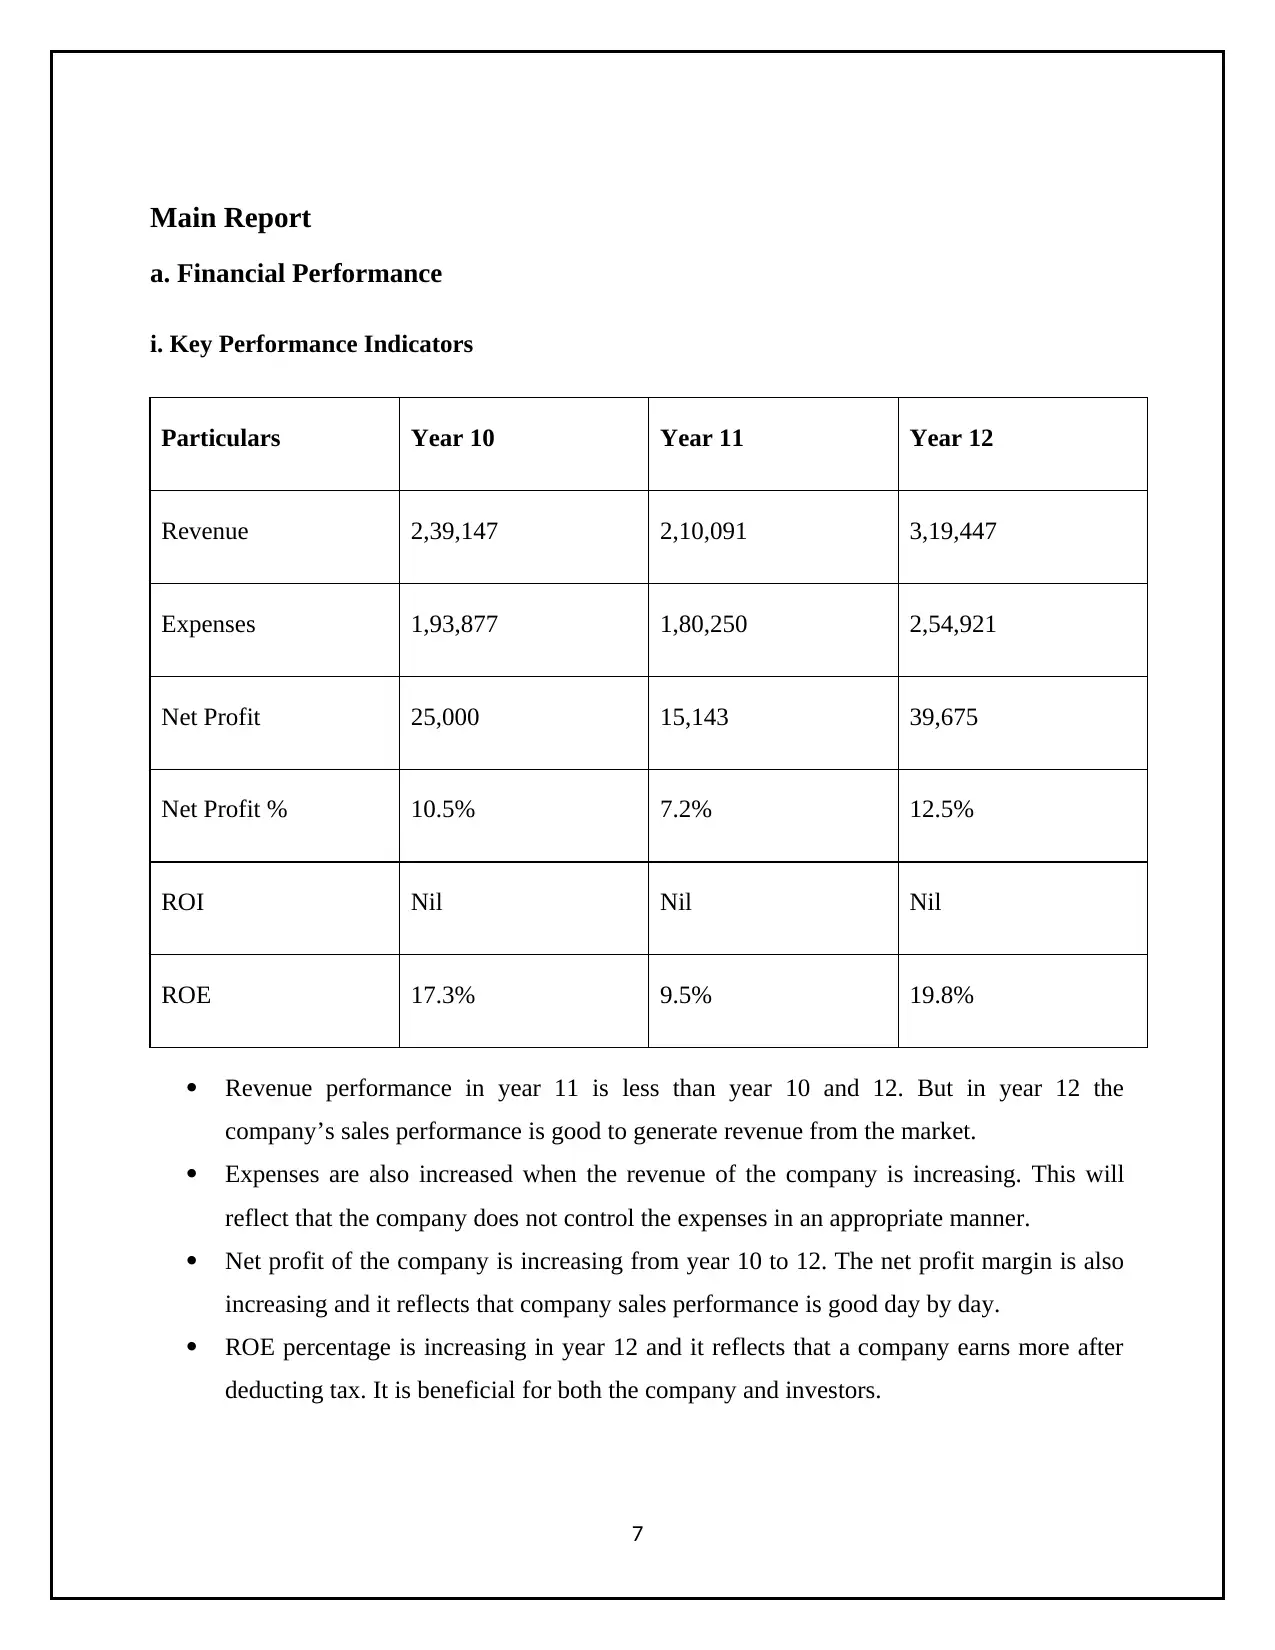
Main Report
a. Financial Performance
i. Key Performance Indicators
Particulars Year 10 Year 11 Year 12
Revenue 2,39,147 2,10,091 3,19,447
Expenses 1,93,877 1,80,250 2,54,921
Net Profit 25,000 15,143 39,675
Net Profit % 10.5% 7.2% 12.5%
ROI Nil Nil Nil
ROE 17.3% 9.5% 19.8%
Revenue performance in year 11 is less than year 10 and 12. But in year 12 the
company’s sales performance is good to generate revenue from the market.
Expenses are also increased when the revenue of the company is increasing. This will
reflect that the company does not control the expenses in an appropriate manner.
Net profit of the company is increasing from year 10 to 12. The net profit margin is also
increasing and it reflects that company sales performance is good day by day.
ROE percentage is increasing in year 12 and it reflects that a company earns more after
deducting tax. It is beneficial for both the company and investors.
7
Paraphrase This Document
Need a fresh take? Get an instant paraphrase of this document with our AI Paraphraser
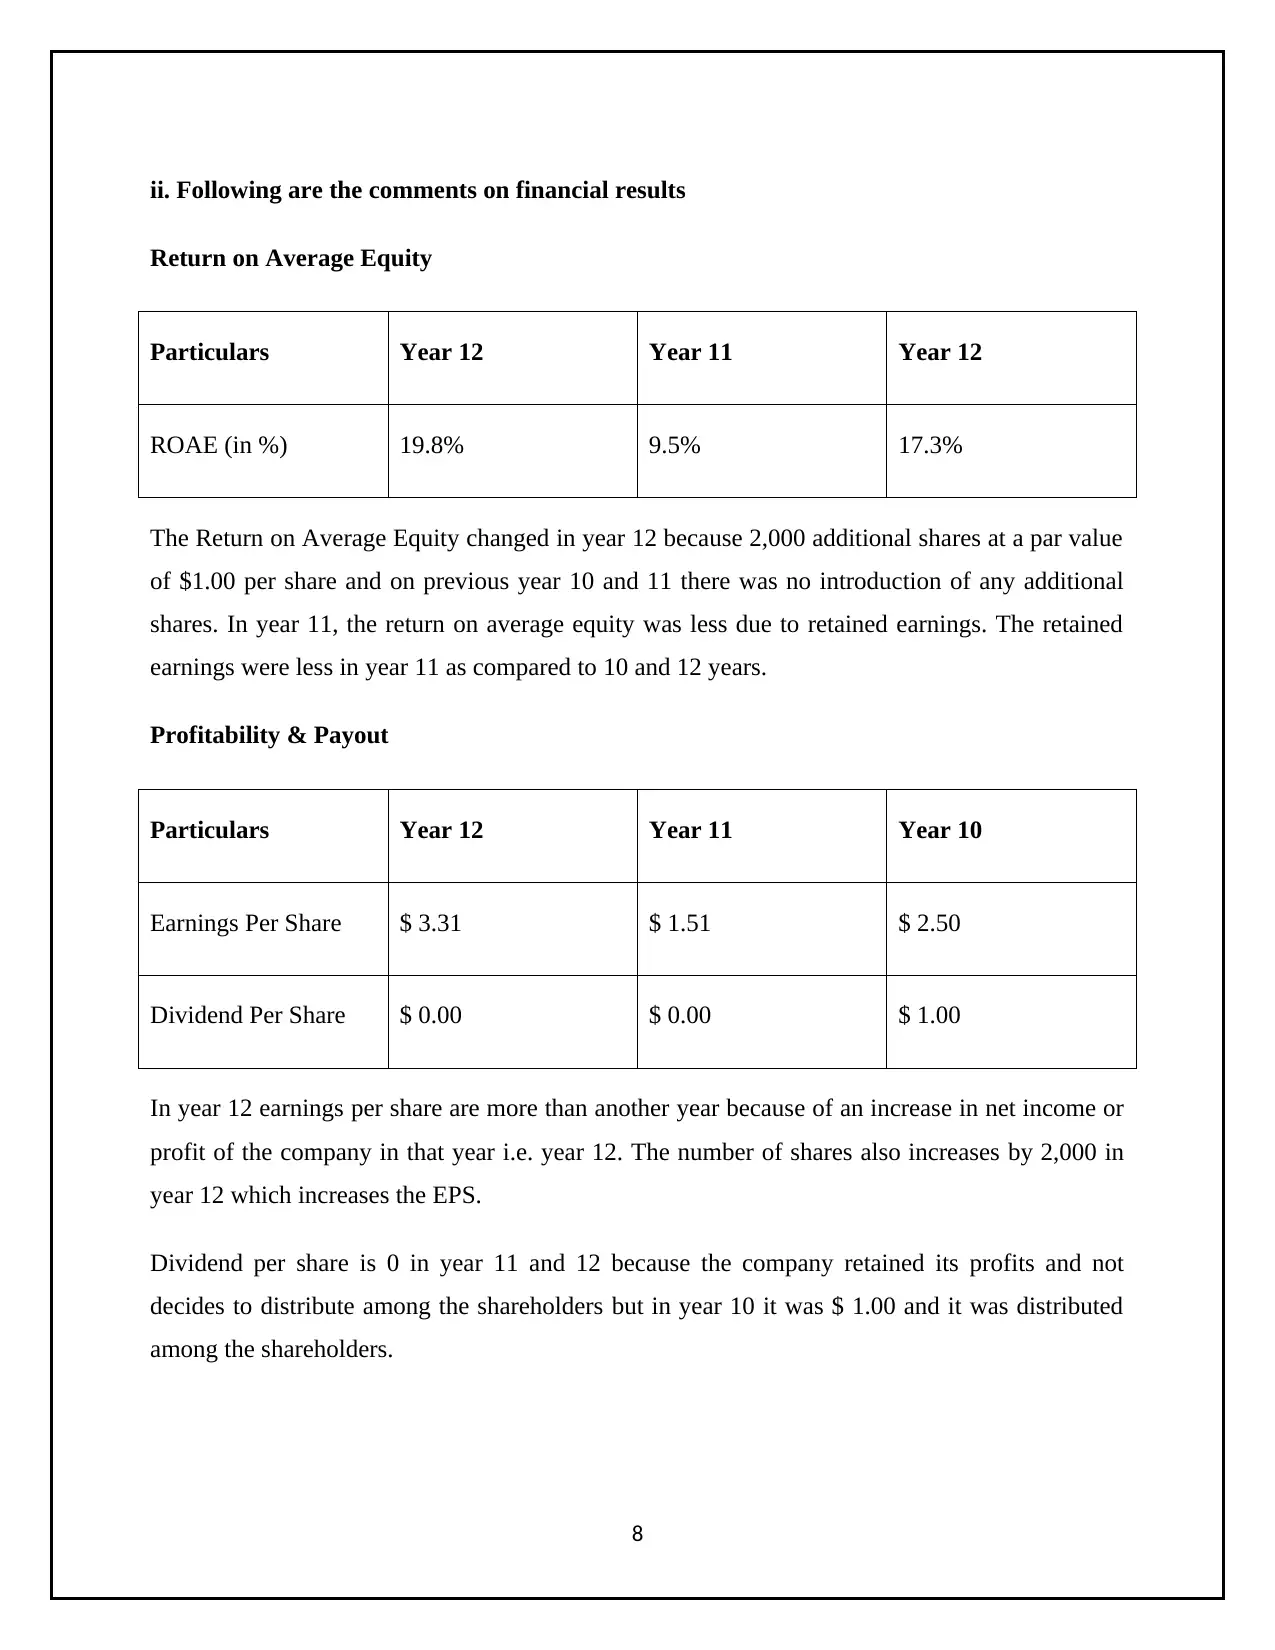
ii. Following are the comments on financial results
Return on Average Equity
Particulars Year 12 Year 11 Year 12
ROAE (in %) 19.8% 9.5% 17.3%
The Return on Average Equity changed in year 12 because 2,000 additional shares at a par value
of $1.00 per share and on previous year 10 and 11 there was no introduction of any additional
shares. In year 11, the return on average equity was less due to retained earnings. The retained
earnings were less in year 11 as compared to 10 and 12 years.
Profitability & Payout
Particulars Year 12 Year 11 Year 10
Earnings Per Share $ 3.31 $ 1.51 $ 2.50
Dividend Per Share $ 0.00 $ 0.00 $ 1.00
In year 12 earnings per share are more than another year because of an increase in net income or
profit of the company in that year i.e. year 12. The number of shares also increases by 2,000 in
year 12 which increases the EPS.
Dividend per share is 0 in year 11 and 12 because the company retained its profits and not
decides to distribute among the shareholders but in year 10 it was $ 1.00 and it was distributed
among the shareholders.
8
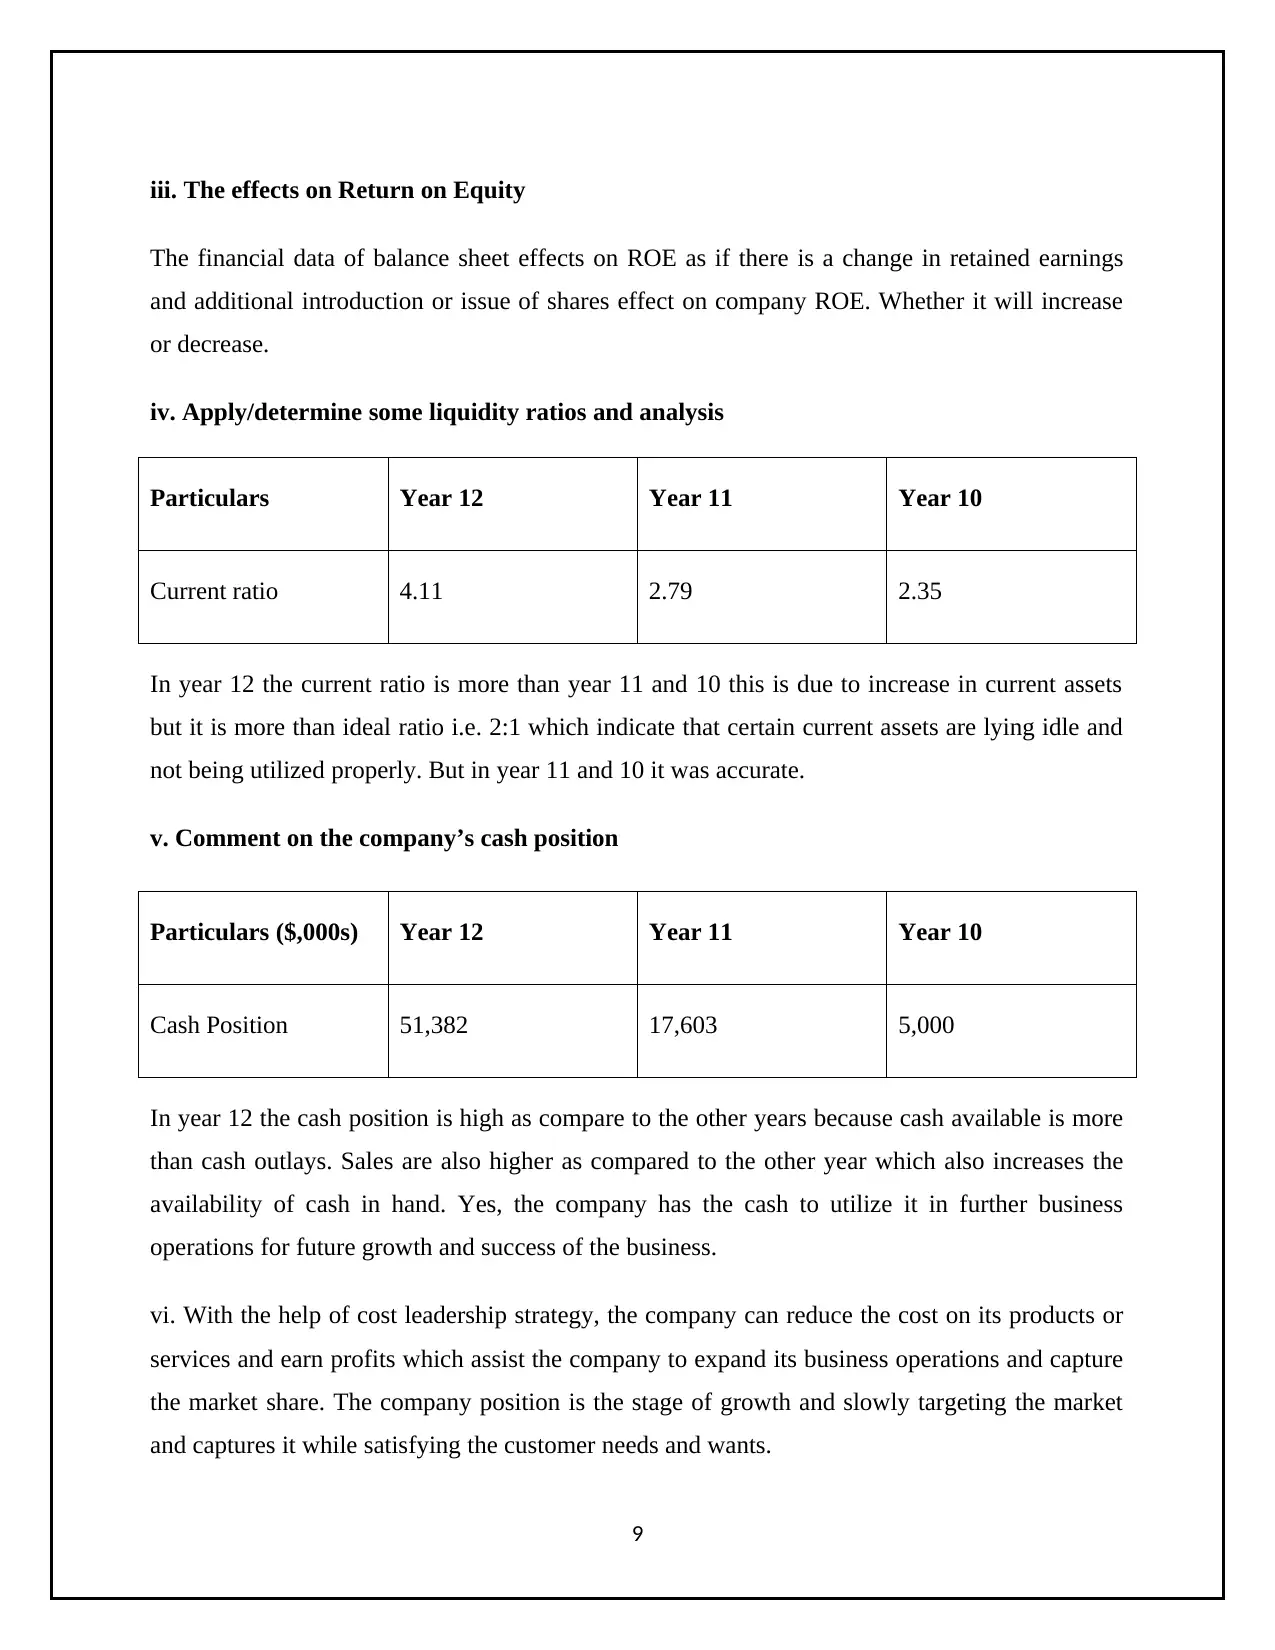
iii. The effects on Return on Equity
The financial data of balance sheet effects on ROE as if there is a change in retained earnings
and additional introduction or issue of shares effect on company ROE. Whether it will increase
or decrease.
iv. Apply/determine some liquidity ratios and analysis
Particulars Year 12 Year 11 Year 10
Current ratio 4.11 2.79 2.35
In year 12 the current ratio is more than year 11 and 10 this is due to increase in current assets
but it is more than ideal ratio i.e. 2:1 which indicate that certain current assets are lying idle and
not being utilized properly. But in year 11 and 10 it was accurate.
v. Comment on the company’s cash position
Particulars ($,000s) Year 12 Year 11 Year 10
Cash Position 51,382 17,603 5,000
In year 12 the cash position is high as compare to the other years because cash available is more
than cash outlays. Sales are also higher as compared to the other year which also increases the
availability of cash in hand. Yes, the company has the cash to utilize it in further business
operations for future growth and success of the business.
vi. With the help of cost leadership strategy, the company can reduce the cost on its products or
services and earn profits which assist the company to expand its business operations and capture
the market share. The company position is the stage of growth and slowly targeting the market
and captures it while satisfying the customer needs and wants.
9
⊘ This is a preview!⊘
Do you want full access?
Subscribe today to unlock all pages.
Trusted by 1+ million students worldwide
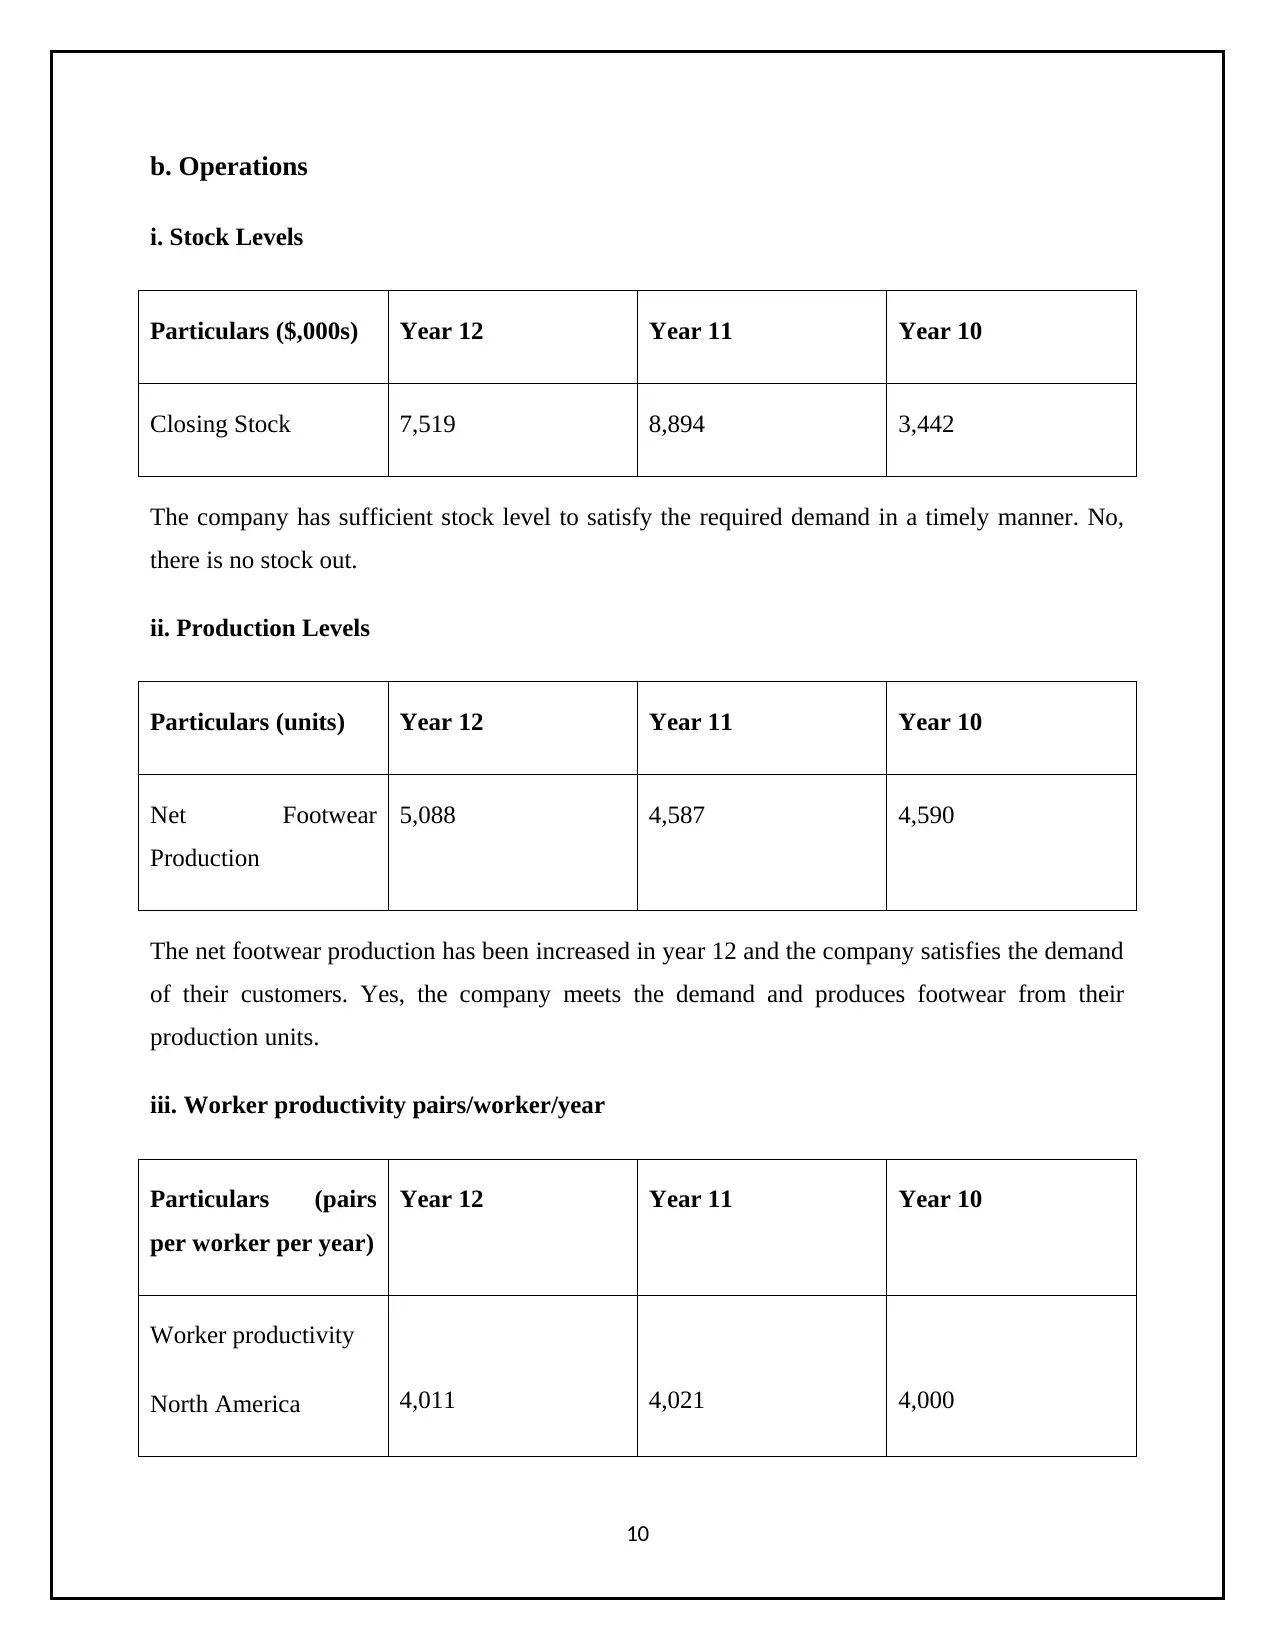
b. Operations
i. Stock Levels
Particulars ($,000s) Year 12 Year 11 Year 10
Closing Stock 7,519 8,894 3,442
The company has sufficient stock level to satisfy the required demand in a timely manner. No,
there is no stock out.
ii. Production Levels
Particulars (units) Year 12 Year 11 Year 10
Net Footwear
Production
5,088 4,587 4,590
The net footwear production has been increased in year 12 and the company satisfies the demand
of their customers. Yes, the company meets the demand and produces footwear from their
production units.
iii. Worker productivity pairs/worker/year
Particulars (pairs
per worker per year)
Year 12 Year 11 Year 10
Worker productivity
North America 4,011 4,021 4,000
10
Paraphrase This Document
Need a fresh take? Get an instant paraphrase of this document with our AI Paraphraser
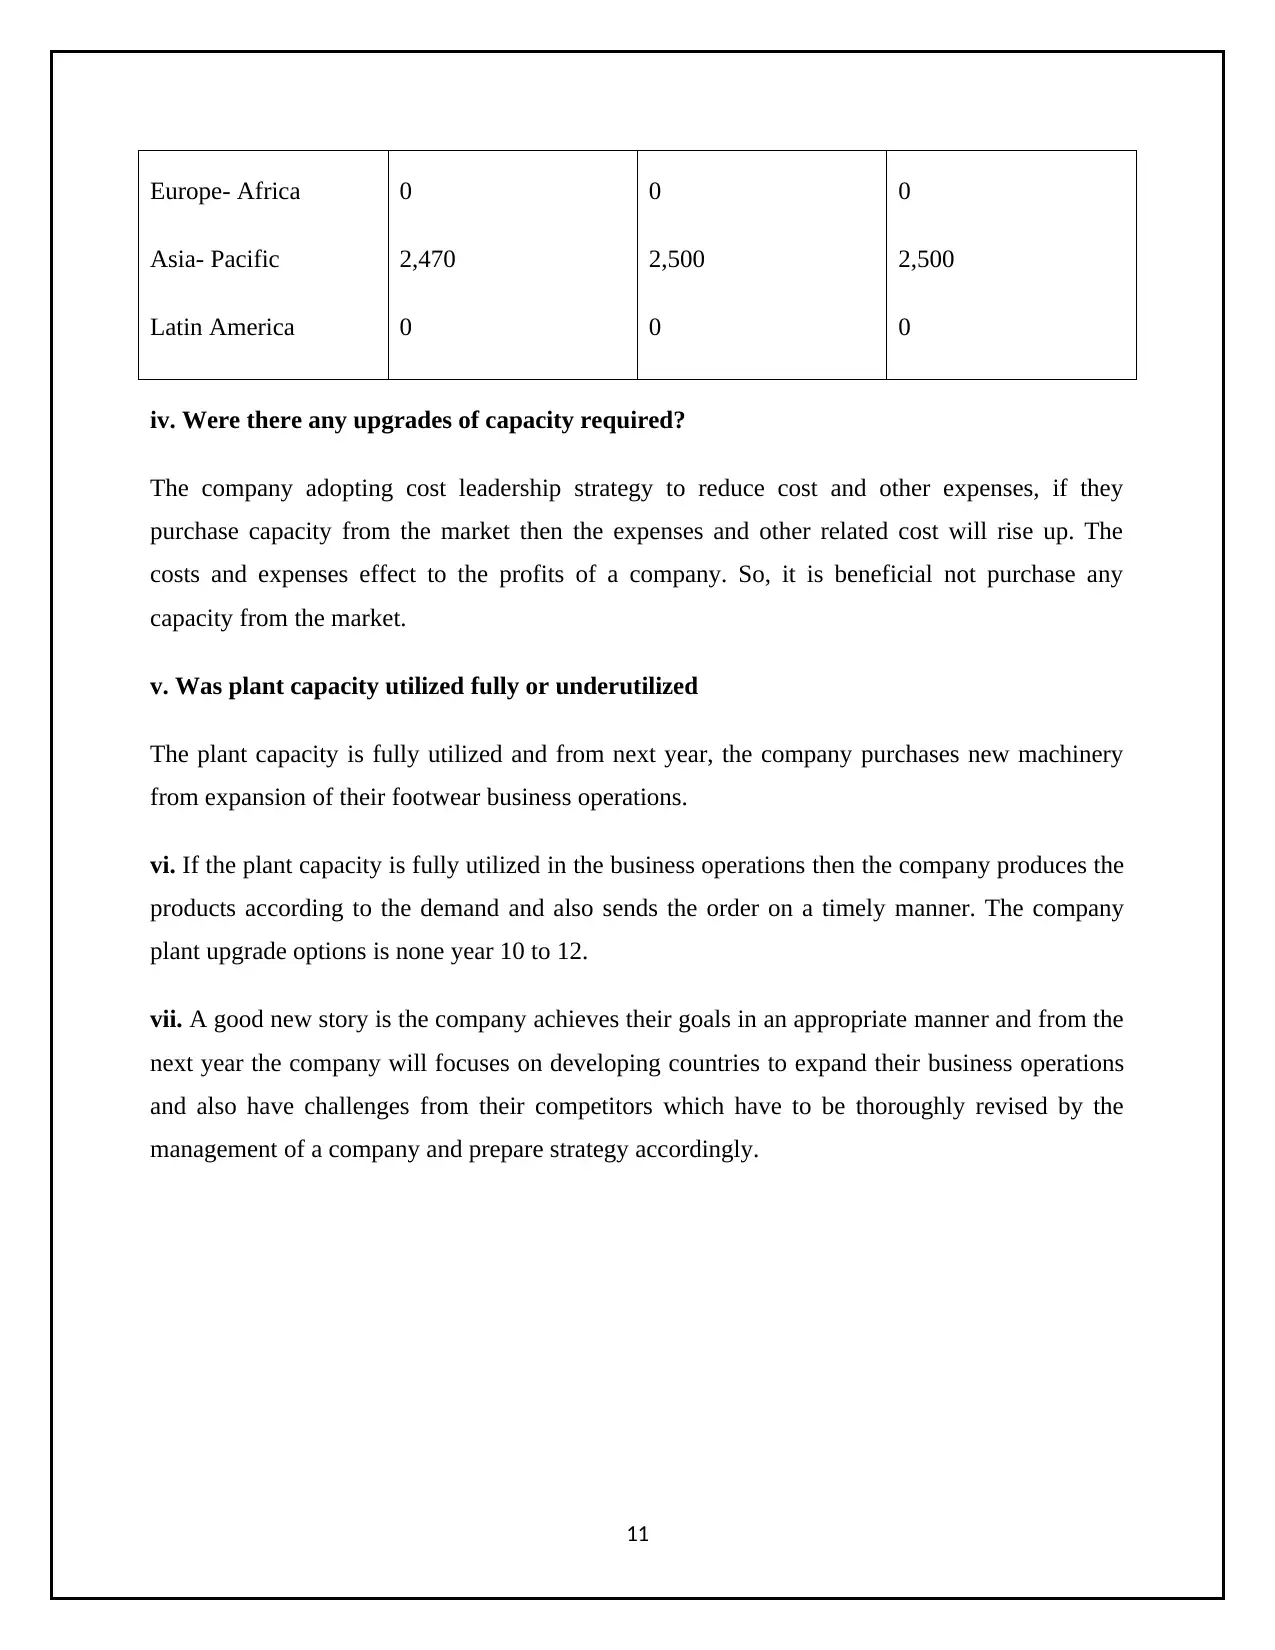
Europe- Africa
Asia- Pacific
Latin America
0
2,470
0
0
2,500
0
0
2,500
0
iv. Were there any upgrades of capacity required?
The company adopting cost leadership strategy to reduce cost and other expenses, if they
purchase capacity from the market then the expenses and other related cost will rise up. The
costs and expenses effect to the profits of a company. So, it is beneficial not purchase any
capacity from the market.
v. Was plant capacity utilized fully or underutilized
The plant capacity is fully utilized and from next year, the company purchases new machinery
from expansion of their footwear business operations.
vi. If the plant capacity is fully utilized in the business operations then the company produces the
products according to the demand and also sends the order on a timely manner. The company
plant upgrade options is none year 10 to 12.
vii. A good new story is the company achieves their goals in an appropriate manner and from the
next year the company will focuses on developing countries to expand their business operations
and also have challenges from their competitors which have to be thoroughly revised by the
management of a company and prepare strategy accordingly.
11
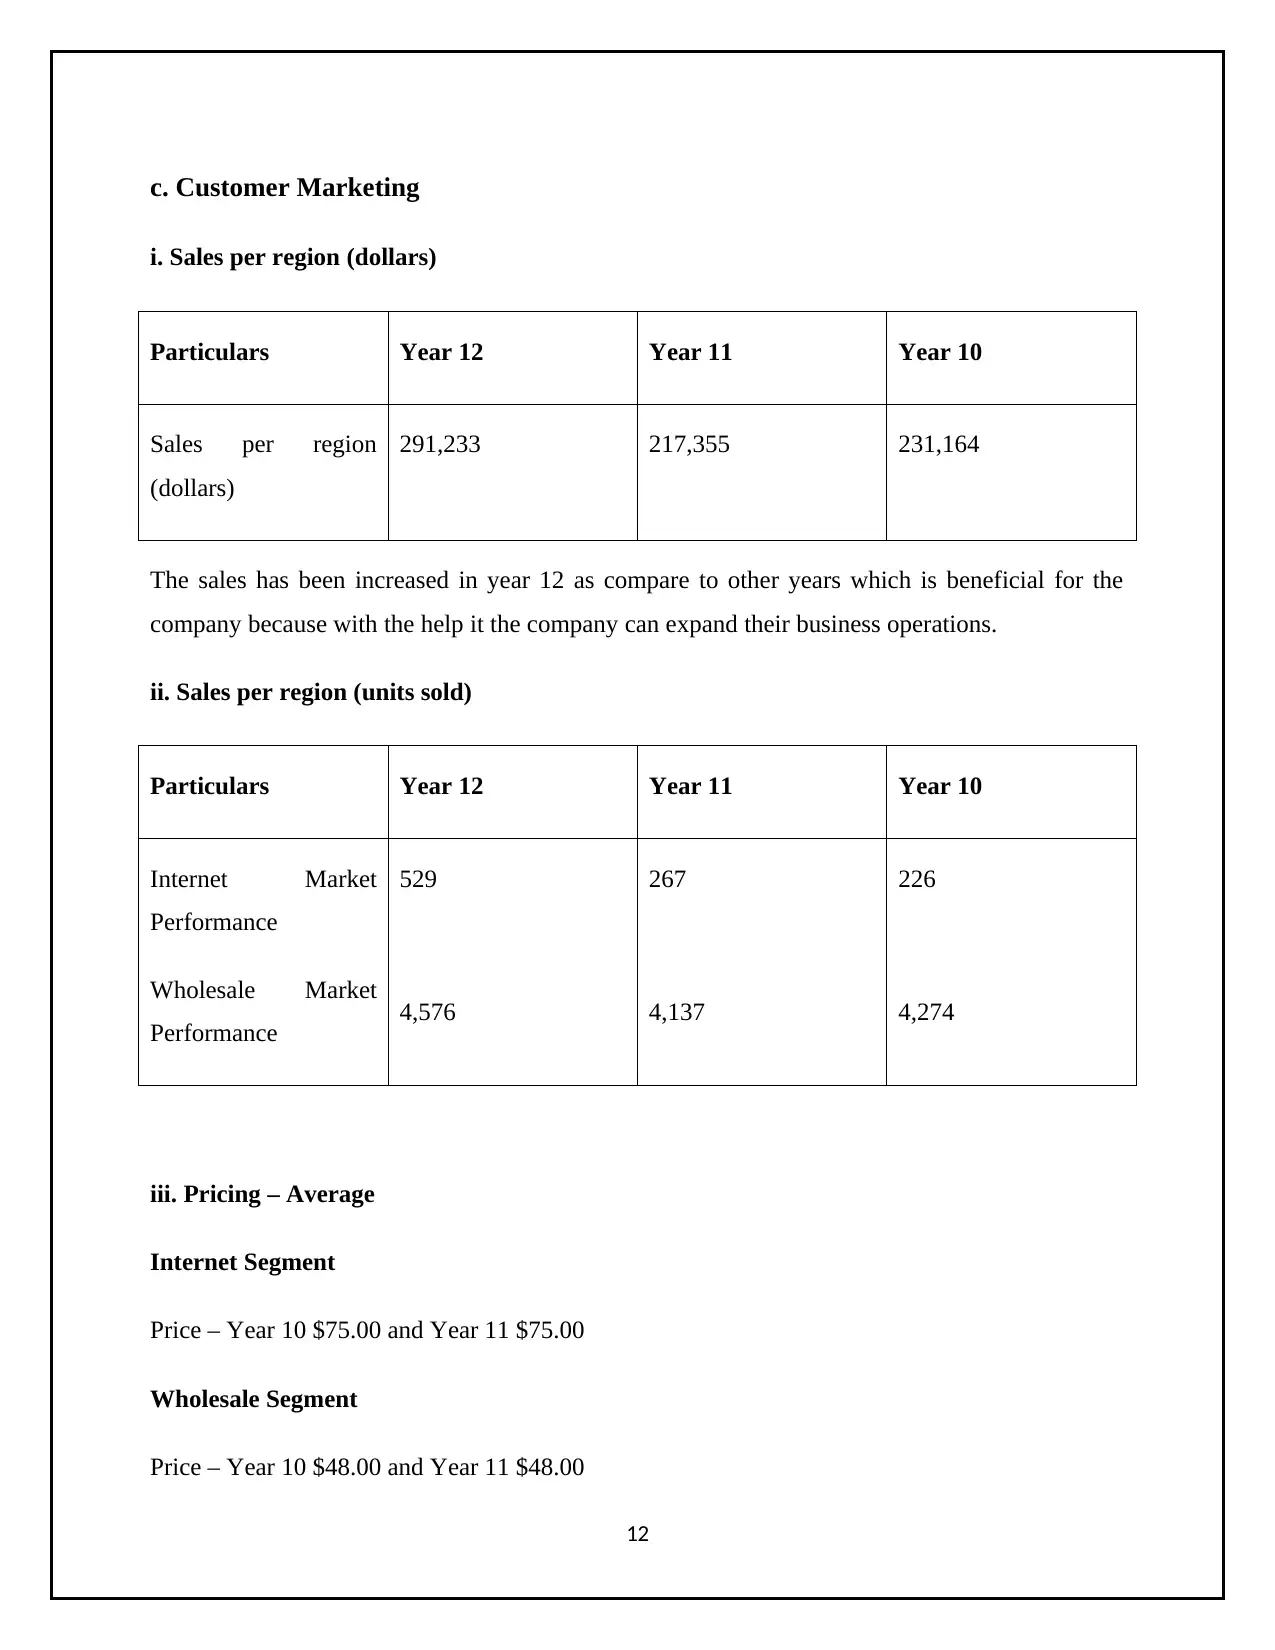
c. Customer Marketing
i. Sales per region (dollars)
Particulars Year 12 Year 11 Year 10
Sales per region
(dollars)
291,233 217,355 231,164
The sales has been increased in year 12 as compare to other years which is beneficial for the
company because with the help it the company can expand their business operations.
ii. Sales per region (units sold)
Particulars Year 12 Year 11 Year 10
Internet Market
Performance
Wholesale Market
Performance
529
4,576
267
4,137
226
4,274
iii. Pricing – Average
Internet Segment
Price – Year 10 $75.00 and Year 11 $75.00
Wholesale Segment
Price – Year 10 $48.00 and Year 11 $48.00
12
⊘ This is a preview!⊘
Do you want full access?
Subscribe today to unlock all pages.
Trusted by 1+ million students worldwide
1 out of 18
Related Documents


Your All-in-One AI-Powered Toolkit for Academic Success.
+13062052269
info@desklib.com
Available 24*7 on WhatsApp / Email
![[object Object]](/_next/static/media/star-bottom.7253800d.svg)
Unlock your academic potential
Copyright © 2020–2026 A2Z Services. All Rights Reserved. Developed and managed by ZUCOL.