An Analysis of Money and Capital Markets: Yield Curve and Bonds

Verified

Added on  2020/03/13

|7
|1257
|120
Report
AI Summary
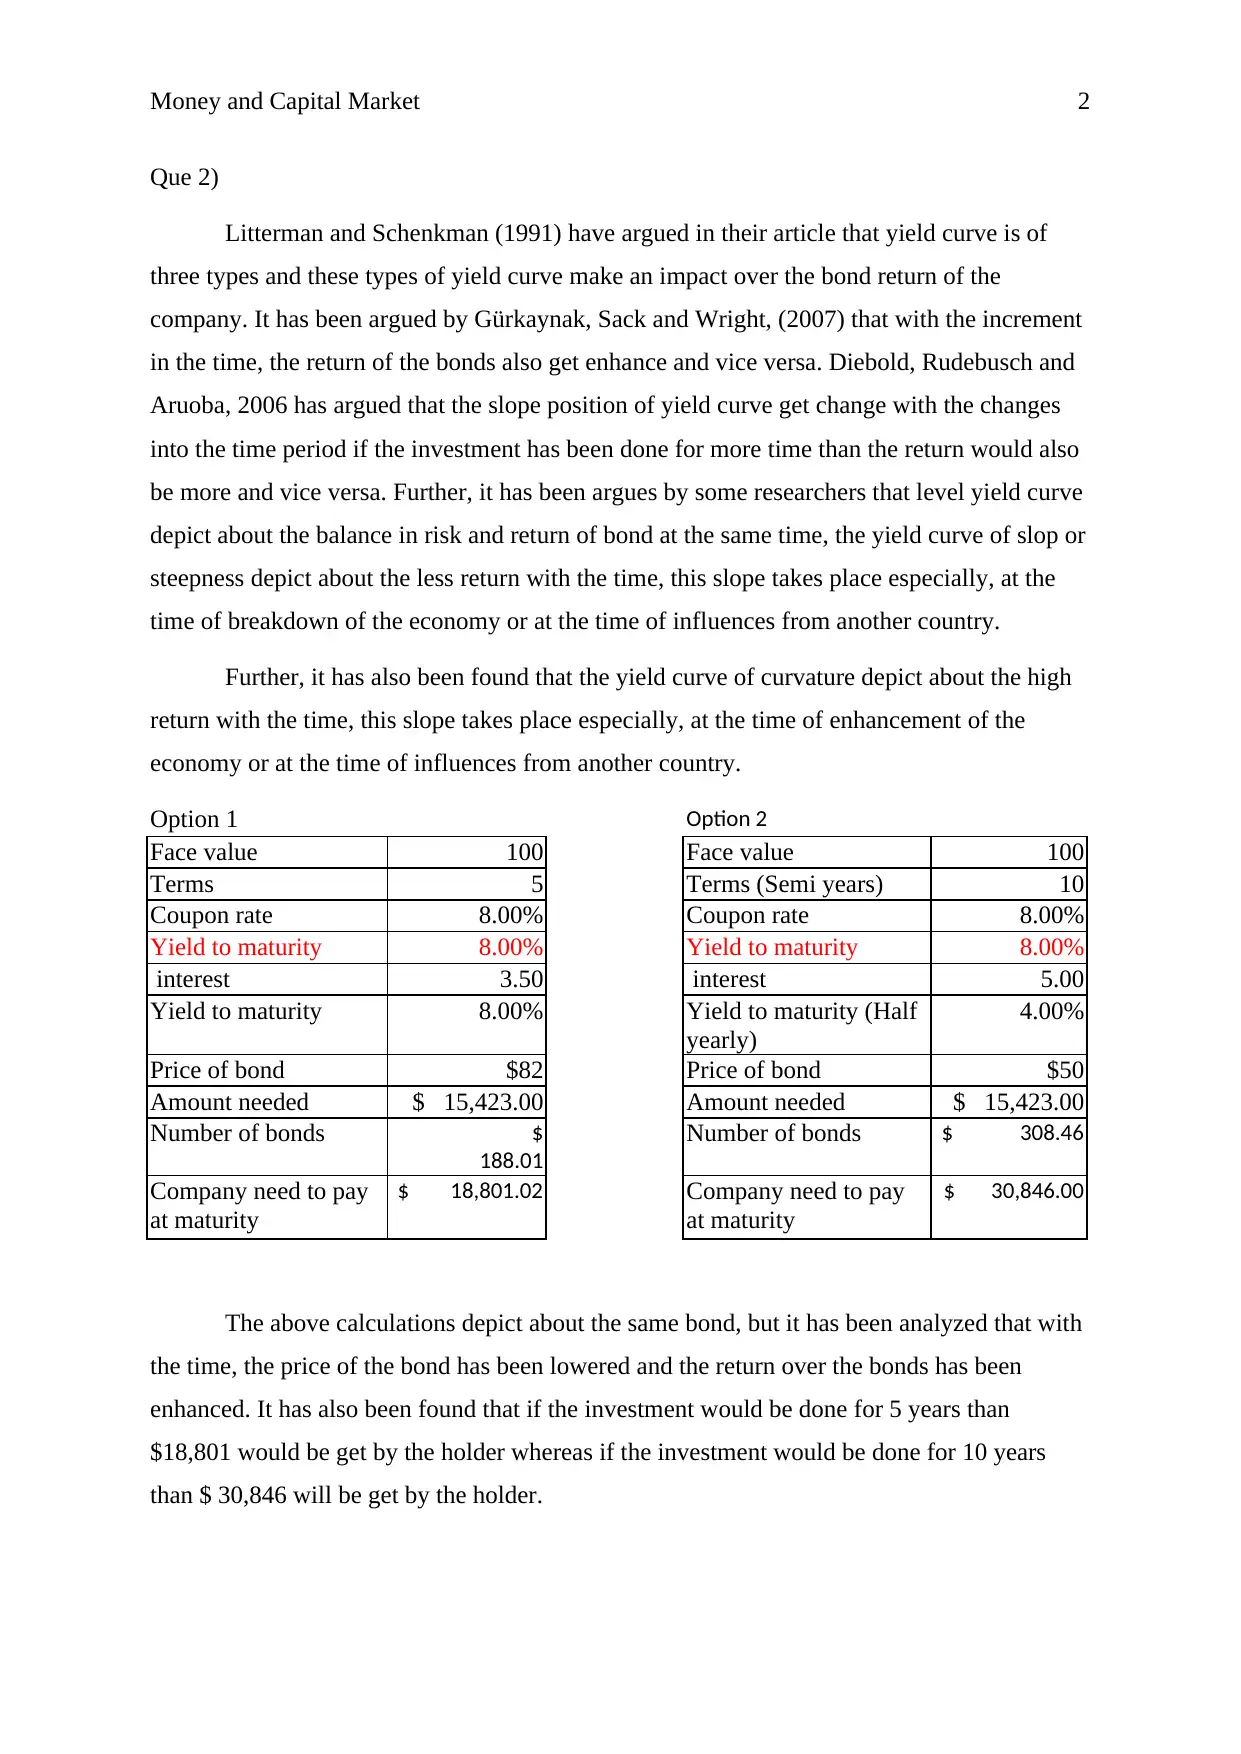
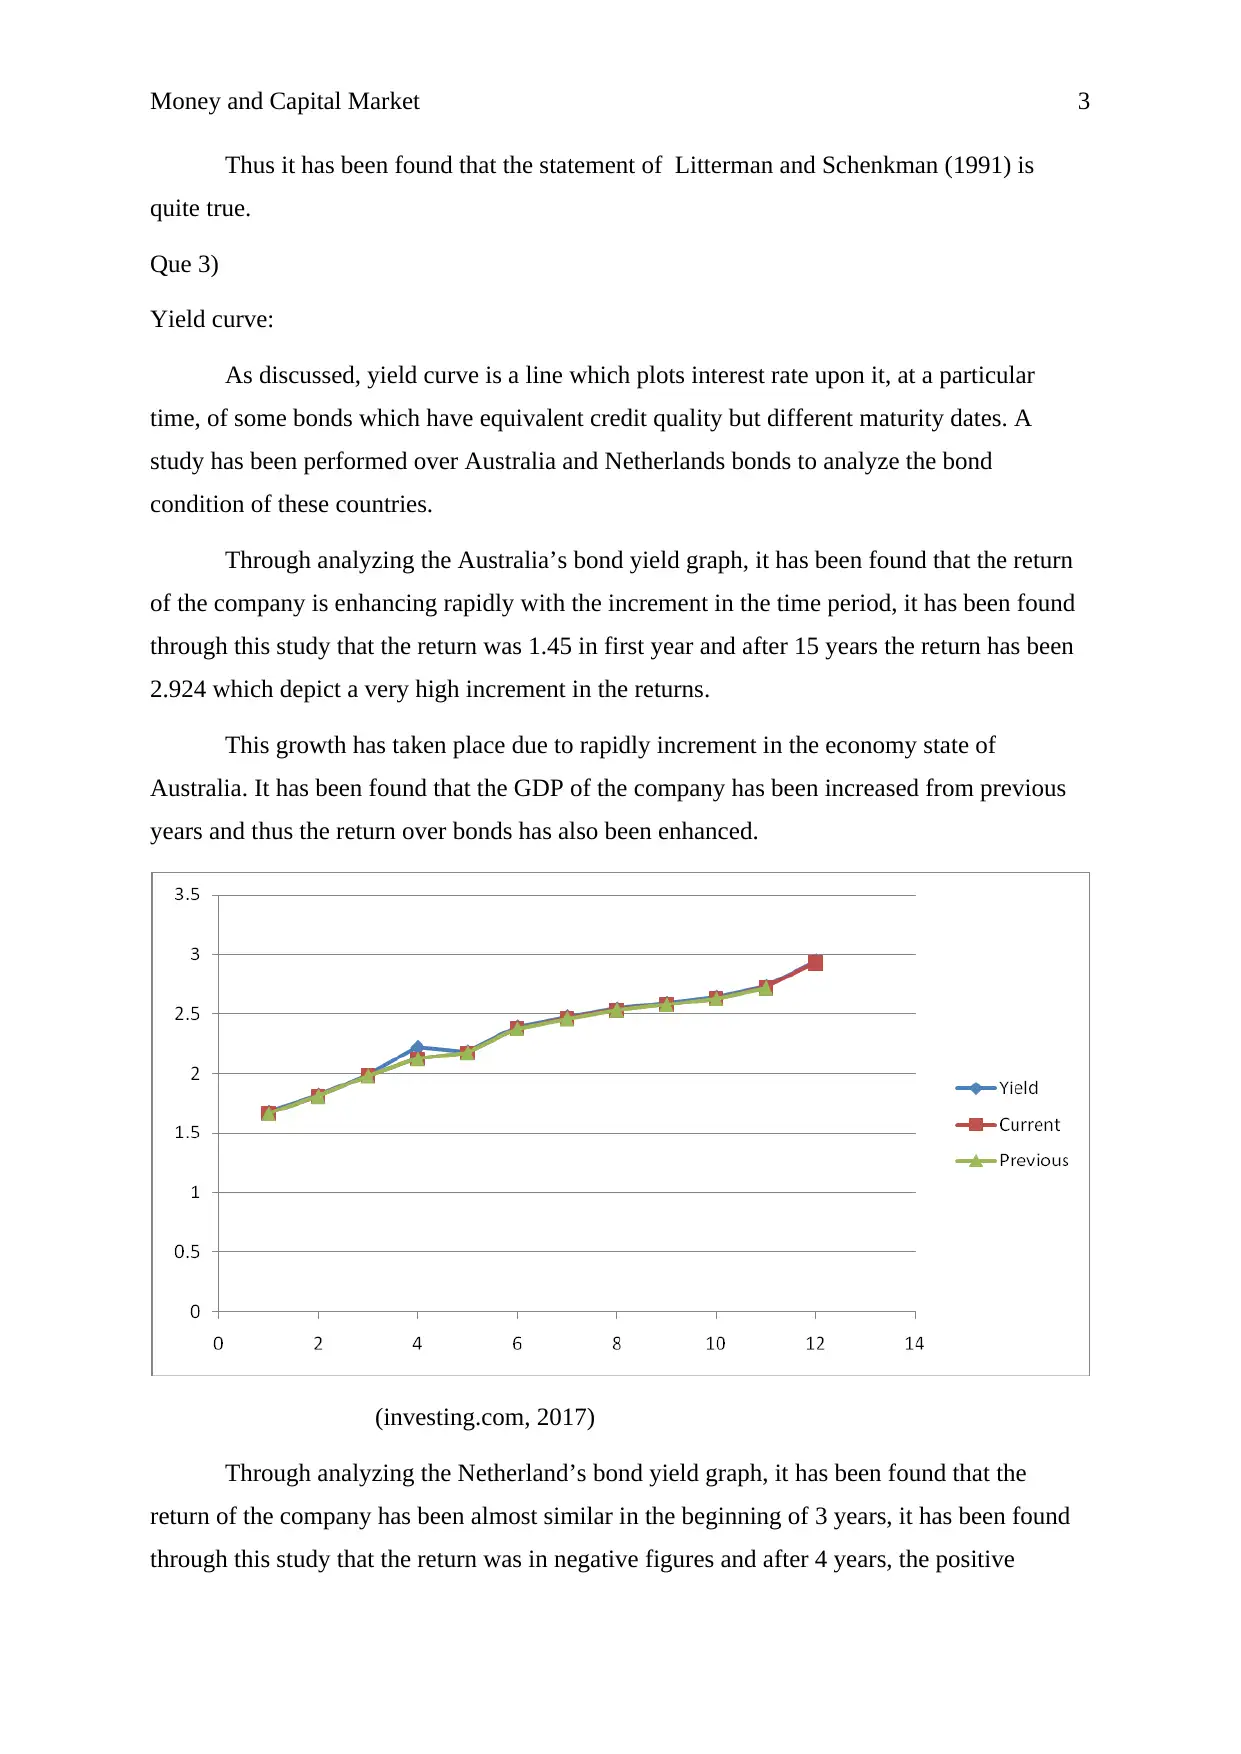
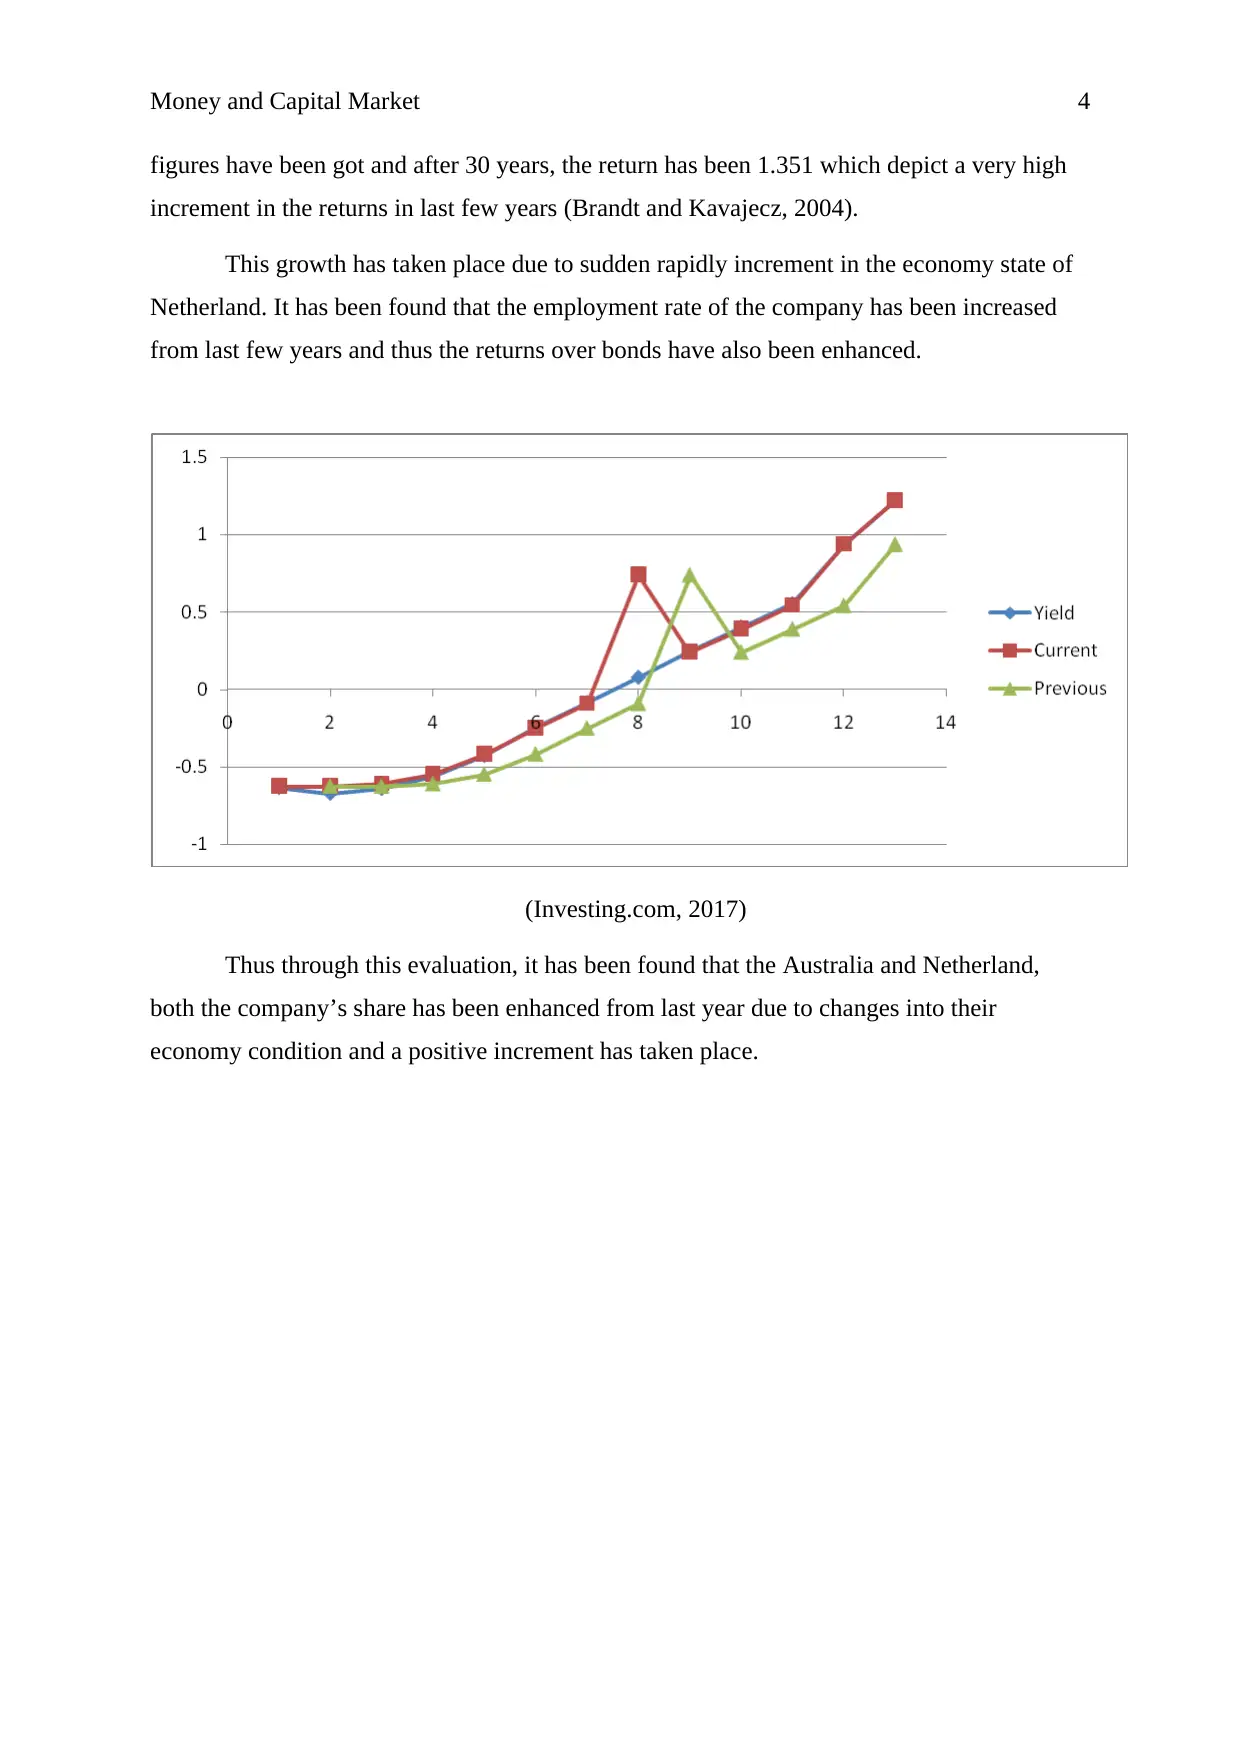
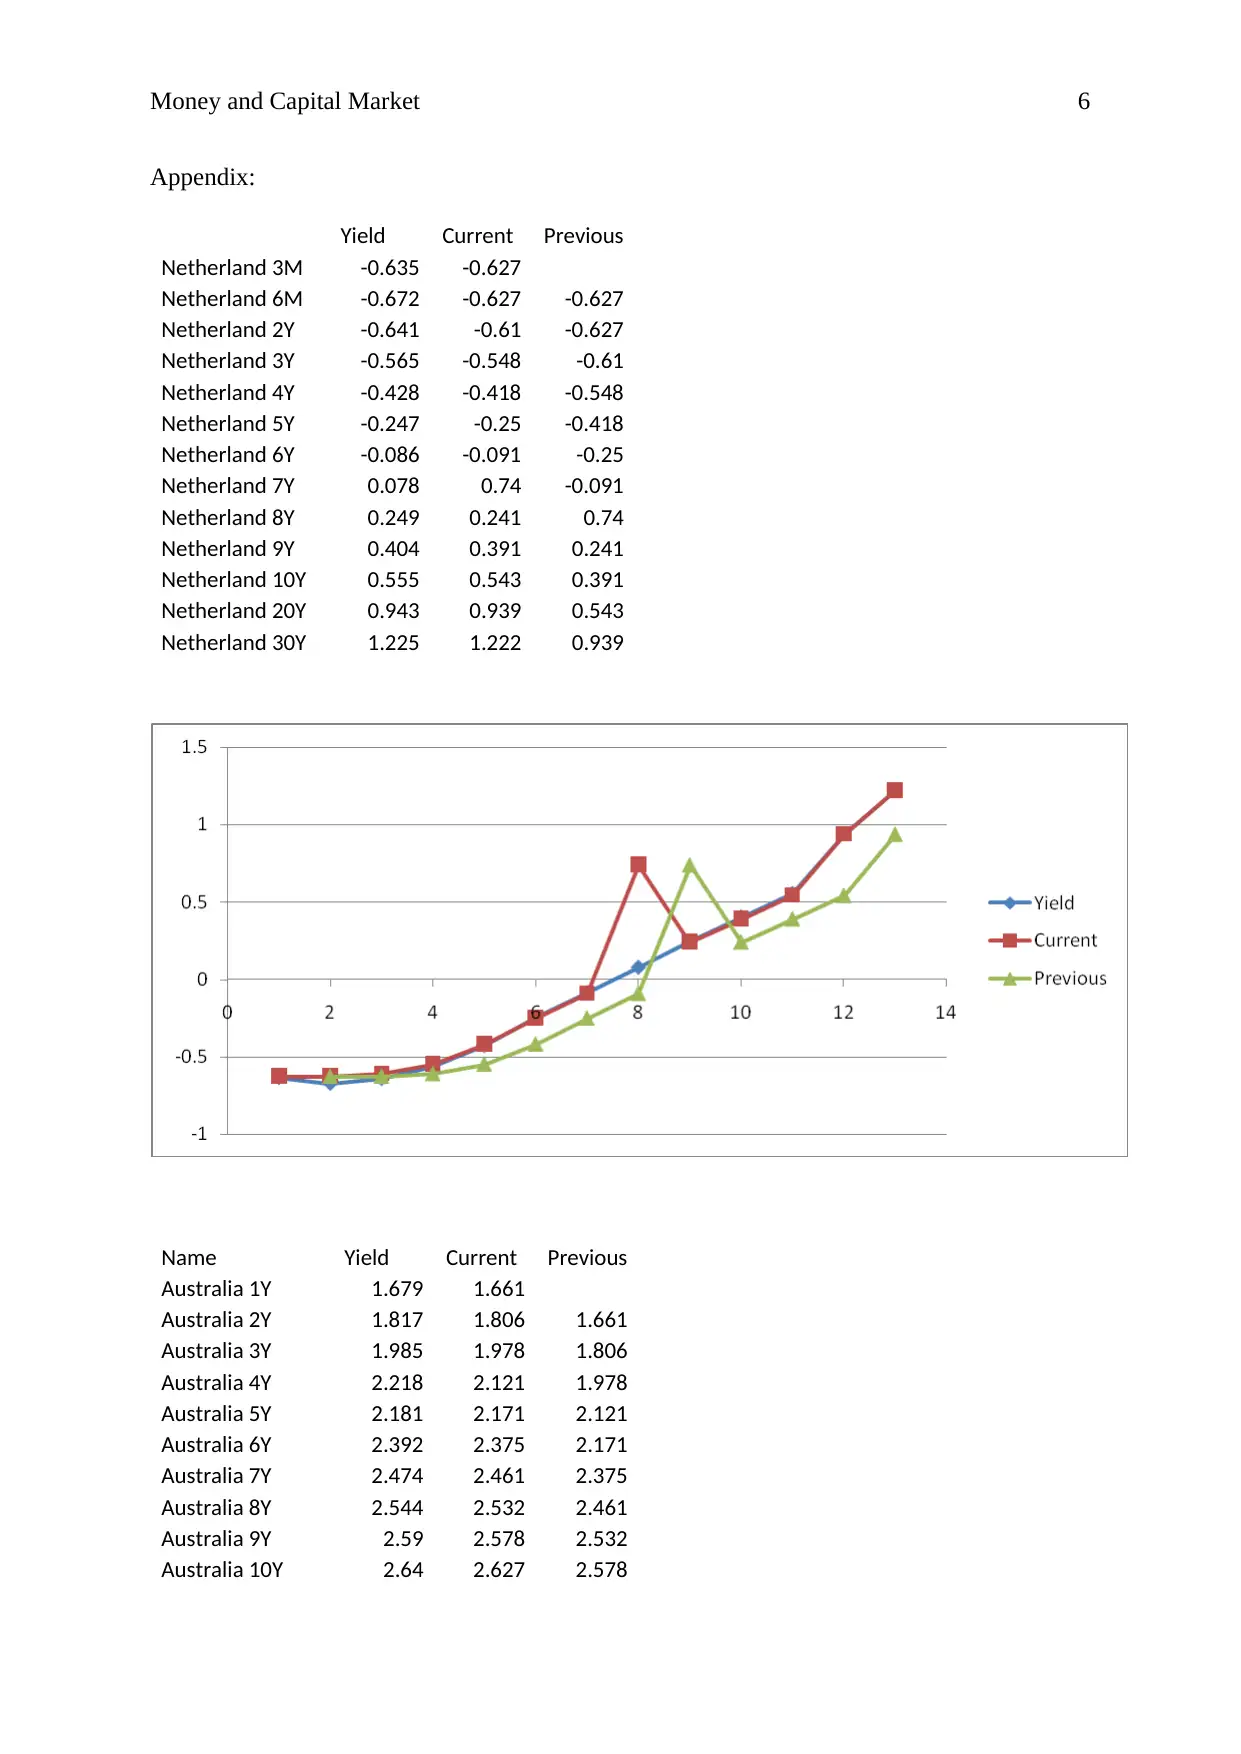
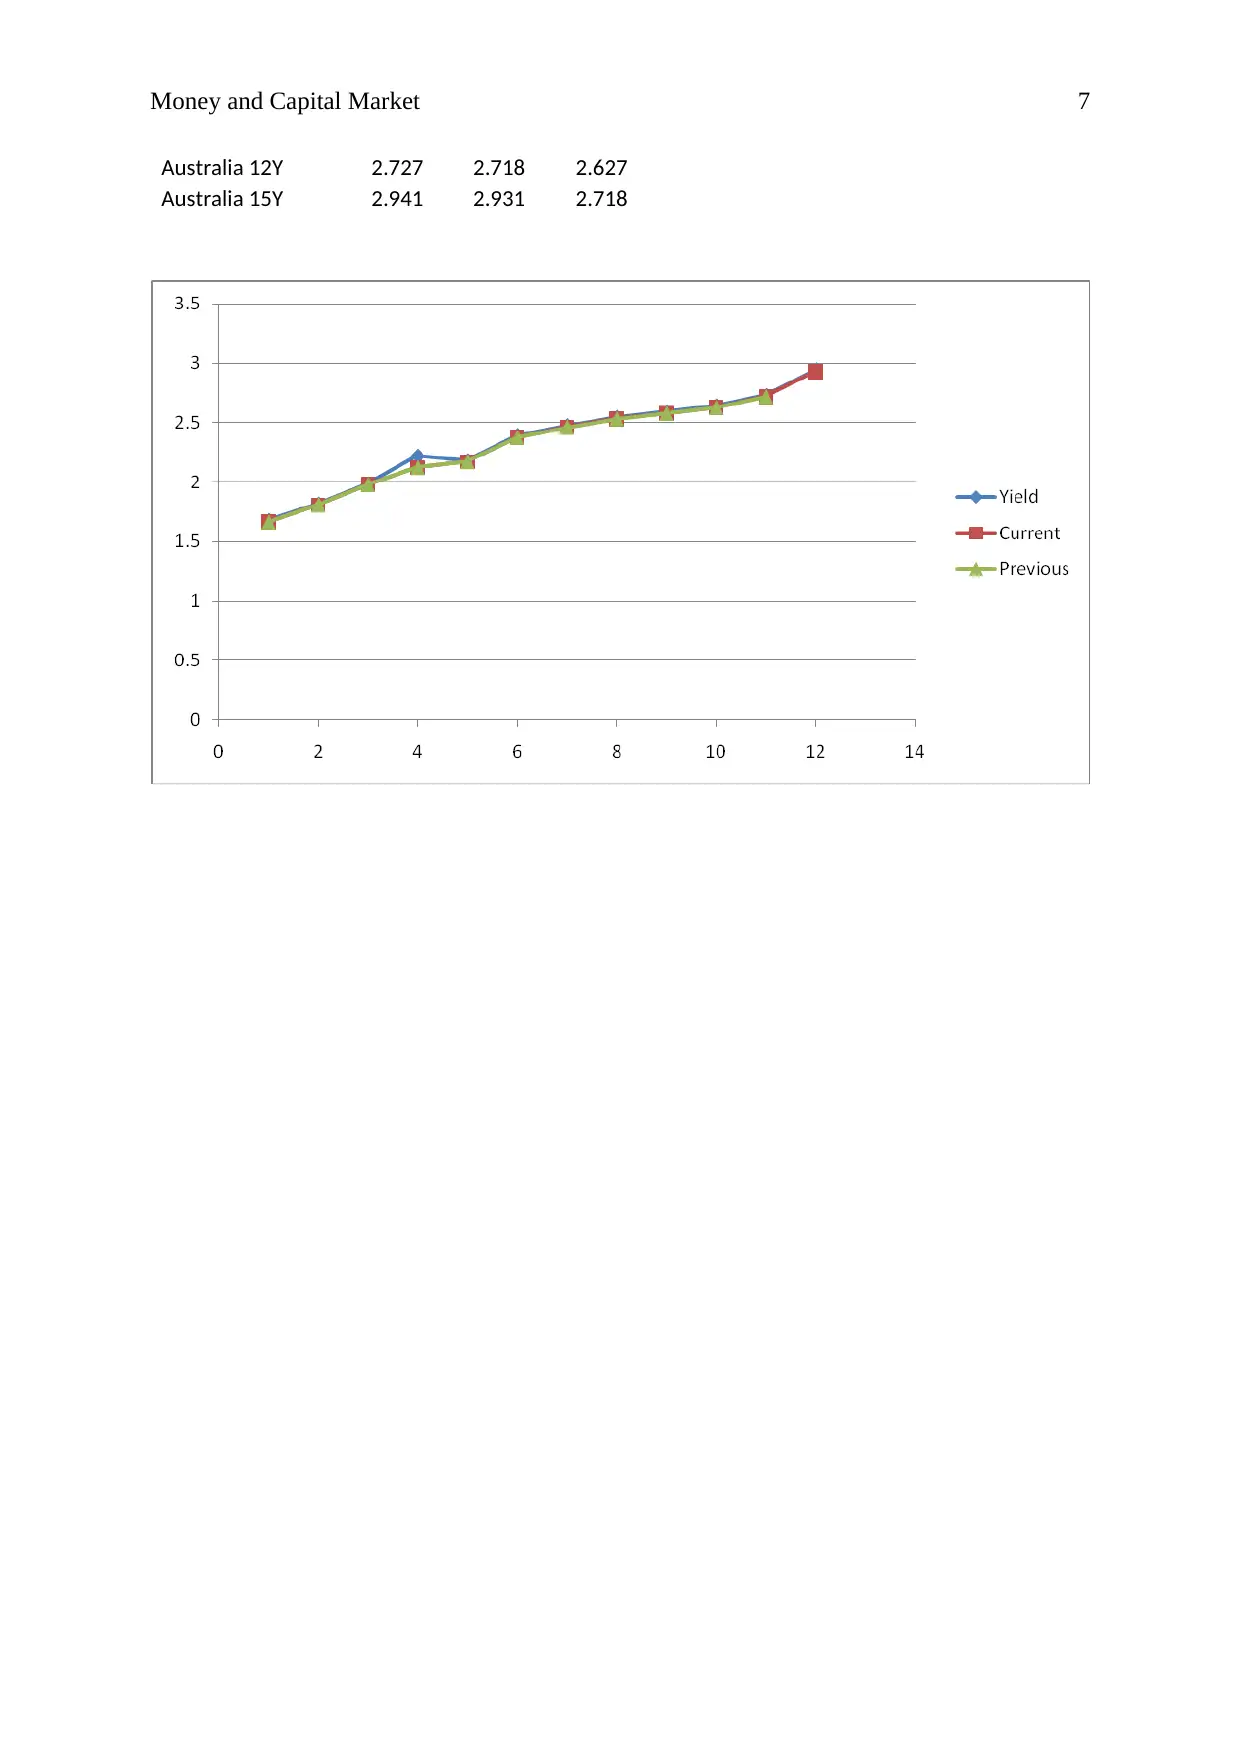
This report analyzes the relationship between yield curves and bond returns in money and capital markets, referencing the work of Litterman and Schenkman (1991). It explores how different yield curve types influence bond returns, supported by research from Gürkaynak, Sack and Wright (2007) and Diebold, Rudebusch and Aruoba (2006). The analysis includes calculations demonstrating the impact of time on bond prices and returns. Furthermore, the report examines the bond conditions of Australia and Netherlands, using yield graphs to illustrate how economic changes affect returns. The Australian bond yield graph indicates increasing returns over time, linked to economic growth, while the Netherlands' graph shows varying returns influenced by employment rates. The report concludes that both countries have experienced enhanced bond performance due to economic improvements.
Document Page
RUNNING HEAD: Money and Capital Market
1
Money and capital Market
tabler-icon-diamond-filled.svg

Paraphrase This Document

Need a fresh take? Get an instant paraphrase of this document with our AI Paraphraser
Document Page
Money and Capital Market 2
Que 2)
Litterman and Schenkman (1991) have argued in their article that yield curve is of
three types and these types of yield curve make an impact over the bond return of the
company. It has been argued by Gürkaynak, Sack and Wright, (2007) that with the increment
in the time, the return of the bonds also get enhance and vice versa. Diebold, Rudebusch and
Aruoba, 2006 has argued that the slope position of yield curve get change with the changes
into the time period if the investment has been done for more time than the return would also
be more and vice versa. Further, it has been argues by some researchers that level yield curve
depict about the balance in risk and return of bond at the same time, the yield curve of slop or
steepness depict about the less return with the time, this slope takes place especially, at the
time of breakdown of the economy or at the time of influences from another country.
Further, it has also been found that the yield curve of curvature depict about the high
return with the time, this slope takes place especially, at the time of enhancement of the
economy or at the time of influences from another country.
Option 1 Option 2
Face value 100 Face value 100
Terms 5 Terms (Semi years) 10
Coupon rate 8.00% Coupon rate 8.00%
Yield to maturity 8.00% Yield to maturity 8.00%
interest 3.50 interest 5.00
Yield to maturity 8.00% Yield to maturity (Half
yearly)
4.00%
Price of bond $82 Price of bond $50
Amount needed $ 15,423.00 Amount needed $ 15,423.00
Number of bonds $
188.01
Number of bonds $ 308.46
Company need to pay
at maturity
$ 18,801.02 Company need to pay
at maturity
$ 30,846.00
The above calculations depict about the same bond, but it has been analyzed that with
the time, the price of the bond has been lowered and the return over the bonds has been
enhanced. It has also been found that if the investment would be done for 5 years than
$18,801 would be get by the holder whereas if the investment would be done for 10 years
than $ 30,846 will be get by the holder.
Document Page
Money and Capital Market 3
Thus it has been found that the statement of Litterman and Schenkman (1991) is
quite true.
Que 3)
Yield curve:
As discussed, yield curve is a line which plots interest rate upon it, at a particular
time, of some bonds which have equivalent credit quality but different maturity dates. A
study has been performed over Australia and Netherlands bonds to analyze the bond
condition of these countries.
Through analyzing the Australia’s bond yield graph, it has been found that the return
of the company is enhancing rapidly with the increment in the time period, it has been found
through this study that the return was 1.45 in first year and after 15 years the return has been
2.924 which depict a very high increment in the returns.
This growth has taken place due to rapidly increment in the economy state of
Australia. It has been found that the GDP of the company has been increased from previous
years and thus the return over bonds has also been enhanced.
(investing.com, 2017)
Through analyzing the Netherland’s bond yield graph, it has been found that the
return of the company has been almost similar in the beginning of 3 years, it has been found
through this study that the return was in negative figures and after 4 years, the positive
Document Page
Money and Capital Market 4
figures have been got and after 30 years, the return has been 1.351 which depict a very high
increment in the returns in last few years (Brandt and Kavajecz, 2004).
This growth has taken place due to sudden rapidly increment in the economy state of
Netherland. It has been found that the employment rate of the company has been increased
from last few years and thus the returns over bonds have also been enhanced.
(Investing.com, 2017)
Thus through this evaluation, it has been found that the Australia and Netherland,
both the company’s share has been enhanced from last year due to changes into their
economy condition and a positive increment has taken place.
tabler-icon-diamond-filled.svg

Paraphrase This Document

Need a fresh take? Get an instant paraphrase of this document with our AI Paraphraser
Document Page
Money and Capital Market 5
References:
Brandt, M.W. and Kavajecz, K.A., 2004. Price discovery in the US Treasury market: The
impact of orderflow and liquidity on the yield curve. The Journal of Finance, 59(6), pp.2623-
2654.
Diebold, F.X., Rudebusch, G.D. and Aruoba, S.B., 2006. The macroeconomy and the yield
curve: a dynamic latent factor approach. Journal of econometrics, 131(1), pp.309-338.
Gürkaynak, R.S., Sack, B. and Wright, J.H., 2007. The US Treasury yield curve: 1961 to the
present. Journal of monetary Economics, 54(8), pp.2291-2304.
Investing.com. 2017. Australia. Retrieved from
https://www.investing.com/rates-bonds/australia-government-bonds
Investing.com. 2017. Netherland. Retrieved from
https://www.investing.com/rates-bonds/netherlands-government-bonds as on 18 Aug 2017
Litterman, R.B. and Scheinkman, J. (1991) Common Factors Aecting Bond Returns.
Journal of Fixed Income, 1, 54-61.
Document Page
Money and Capital Market 6
Appendix:
Yield Current Previous
Netherland 3M -0.635 -0.627
Netherland 6M -0.672 -0.627 -0.627
Netherland 2Y -0.641 -0.61 -0.627
Netherland 3Y -0.565 -0.548 -0.61
Netherland 4Y -0.428 -0.418 -0.548
Netherland 5Y -0.247 -0.25 -0.418
Netherland 6Y -0.086 -0.091 -0.25
Netherland 7Y 0.078 0.74 -0.091
Netherland 8Y 0.249 0.241 0.74
Netherland 9Y 0.404 0.391 0.241
Netherland 10Y 0.555 0.543 0.391
Netherland 20Y 0.943 0.939 0.543
Netherland 30Y 1.225 1.222 0.939
Name Yield Current Previous
Australia 1Y 1.679 1.661
Australia 2Y 1.817 1.806 1.661
Australia 3Y 1.985 1.978 1.806
Australia 4Y 2.218 2.121 1.978
Australia 5Y 2.181 2.171 2.121
Australia 6Y 2.392 2.375 2.171
Australia 7Y 2.474 2.461 2.375
Australia 8Y 2.544 2.532 2.461
Australia 9Y 2.59 2.578 2.532
Australia 10Y 2.64 2.627 2.578
Document Page
Money and Capital Market 7
Australia 12Y 2.727 2.718 2.627
Australia 15Y 2.941 2.931 2.718
chevron_up_icon
1 out of 7
circle_padding
hide_on_mobile
zoom_out_icon
[object Object]