Money and Banking: Yield Curve Analysis of Australia and Netherlands

Verified

Added on  2020/02/24

|9
|1003
|62
Report
AI Summary
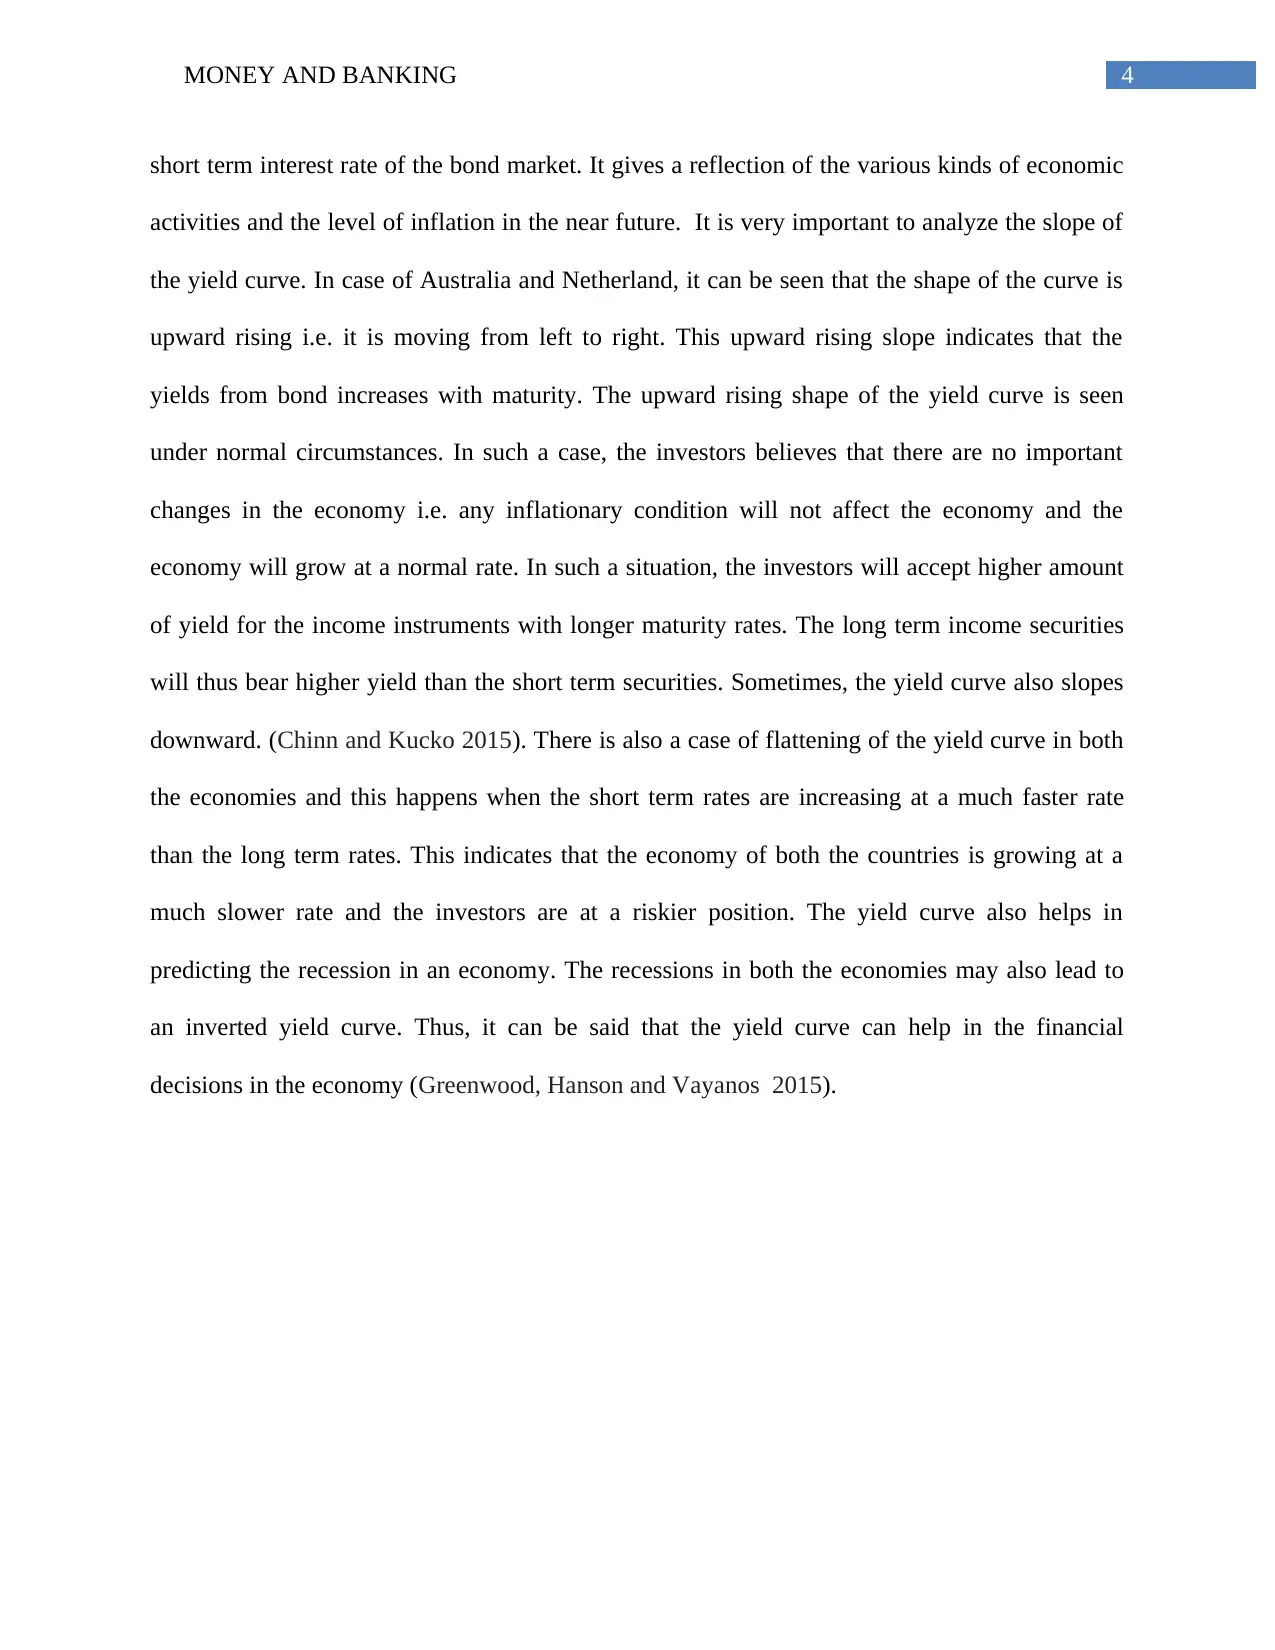
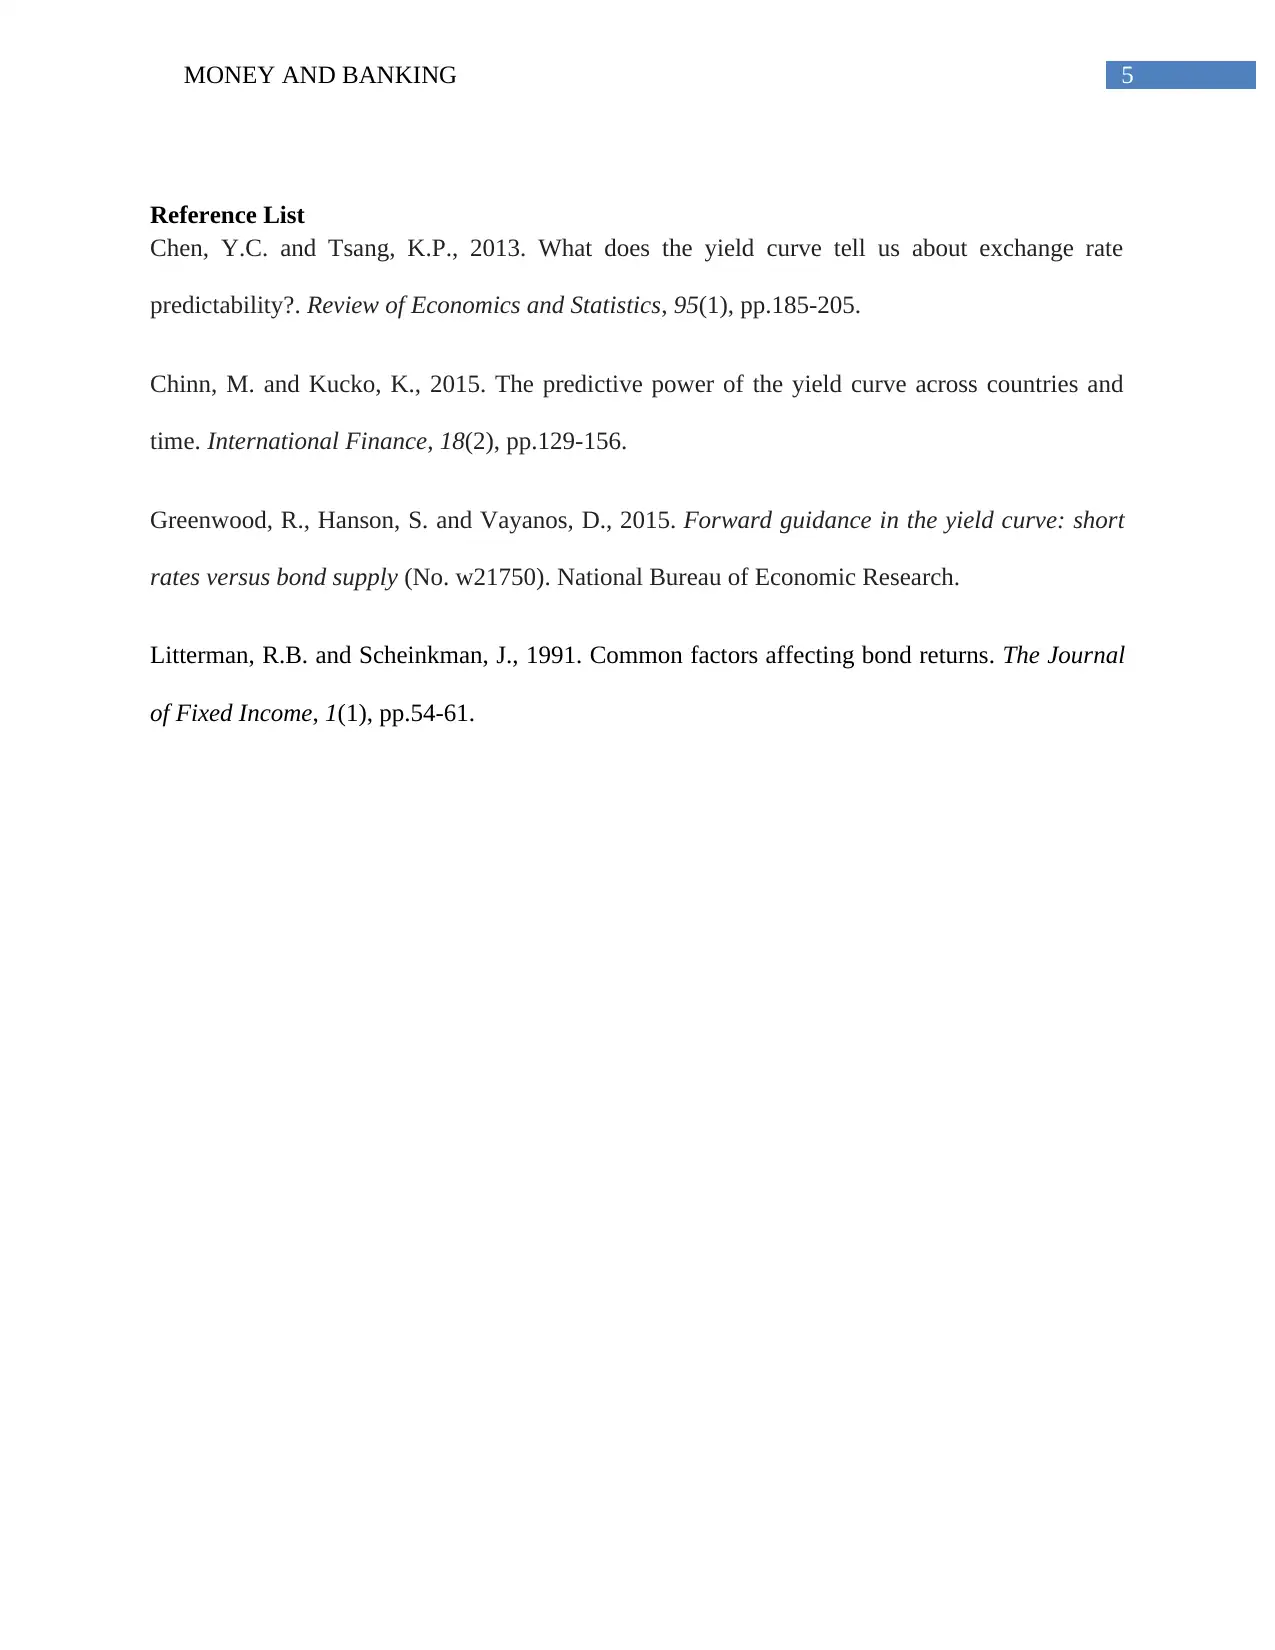
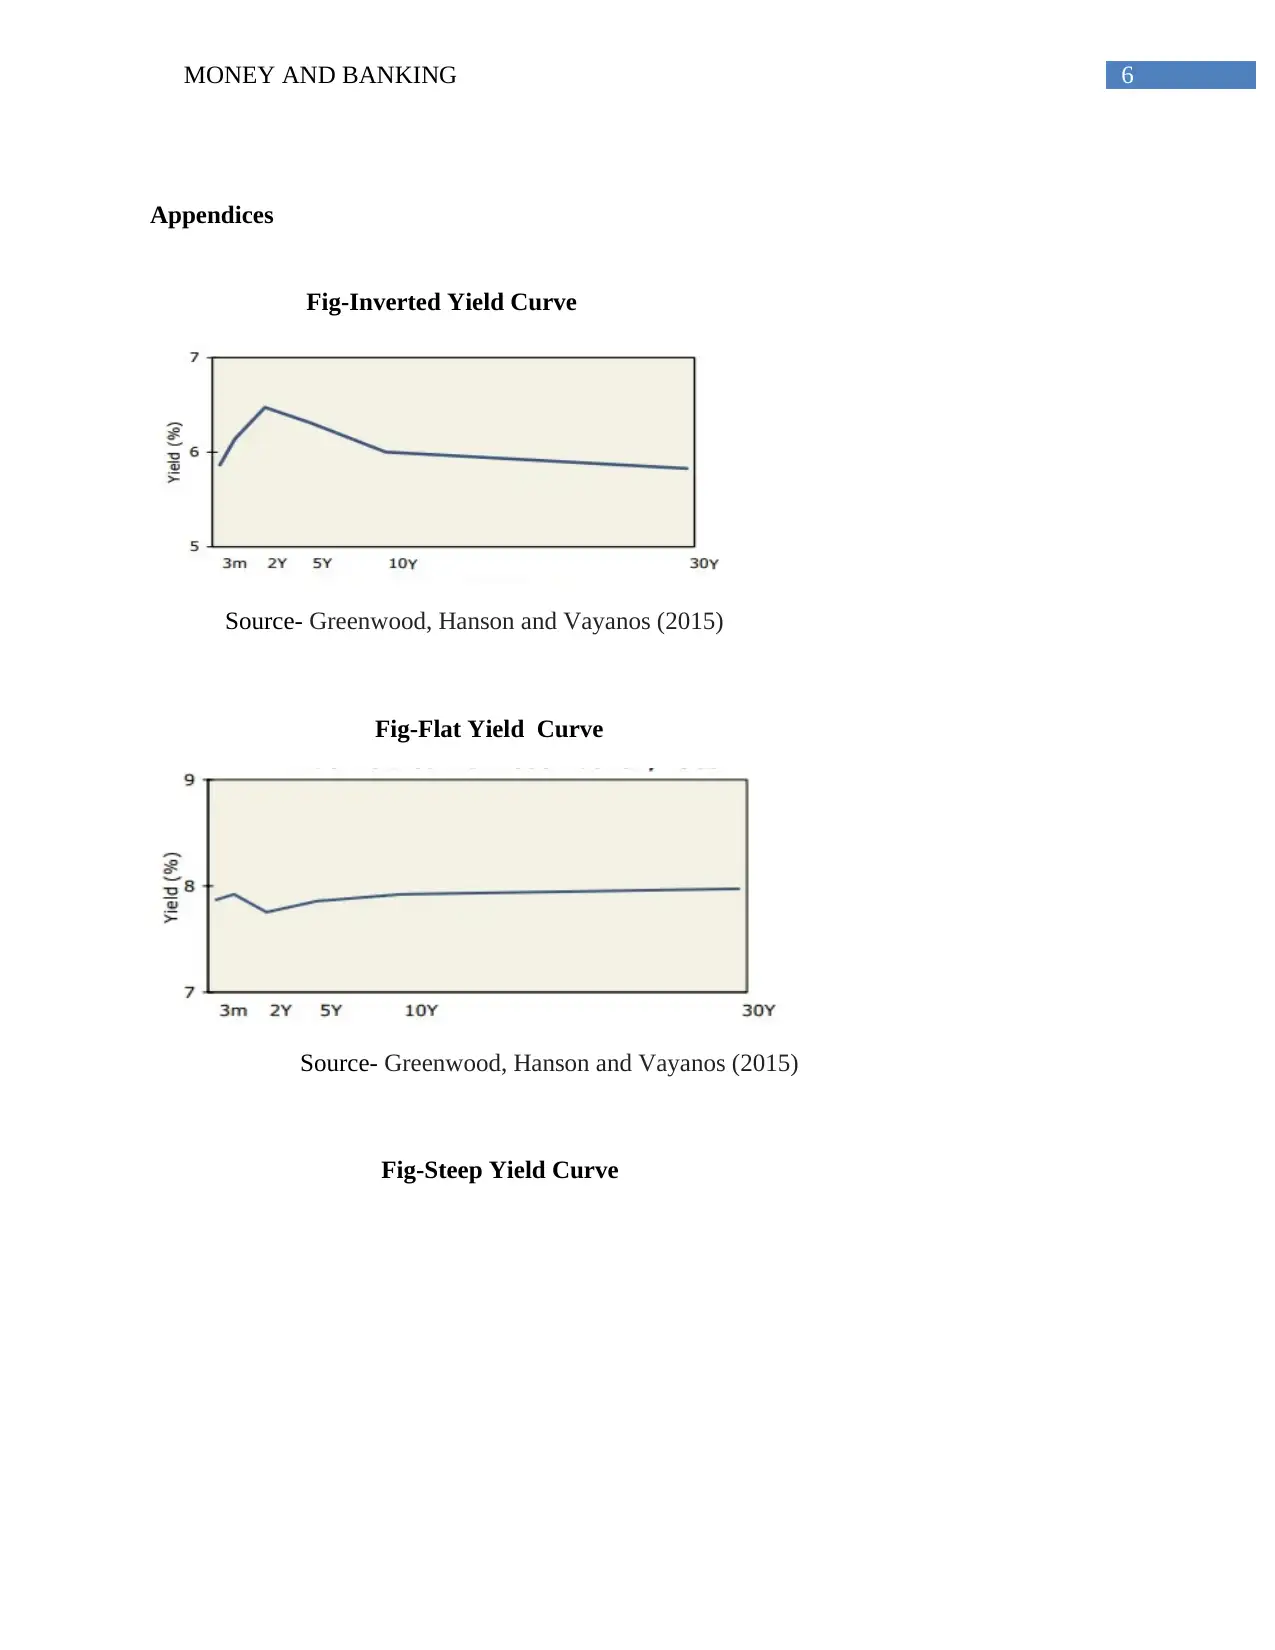
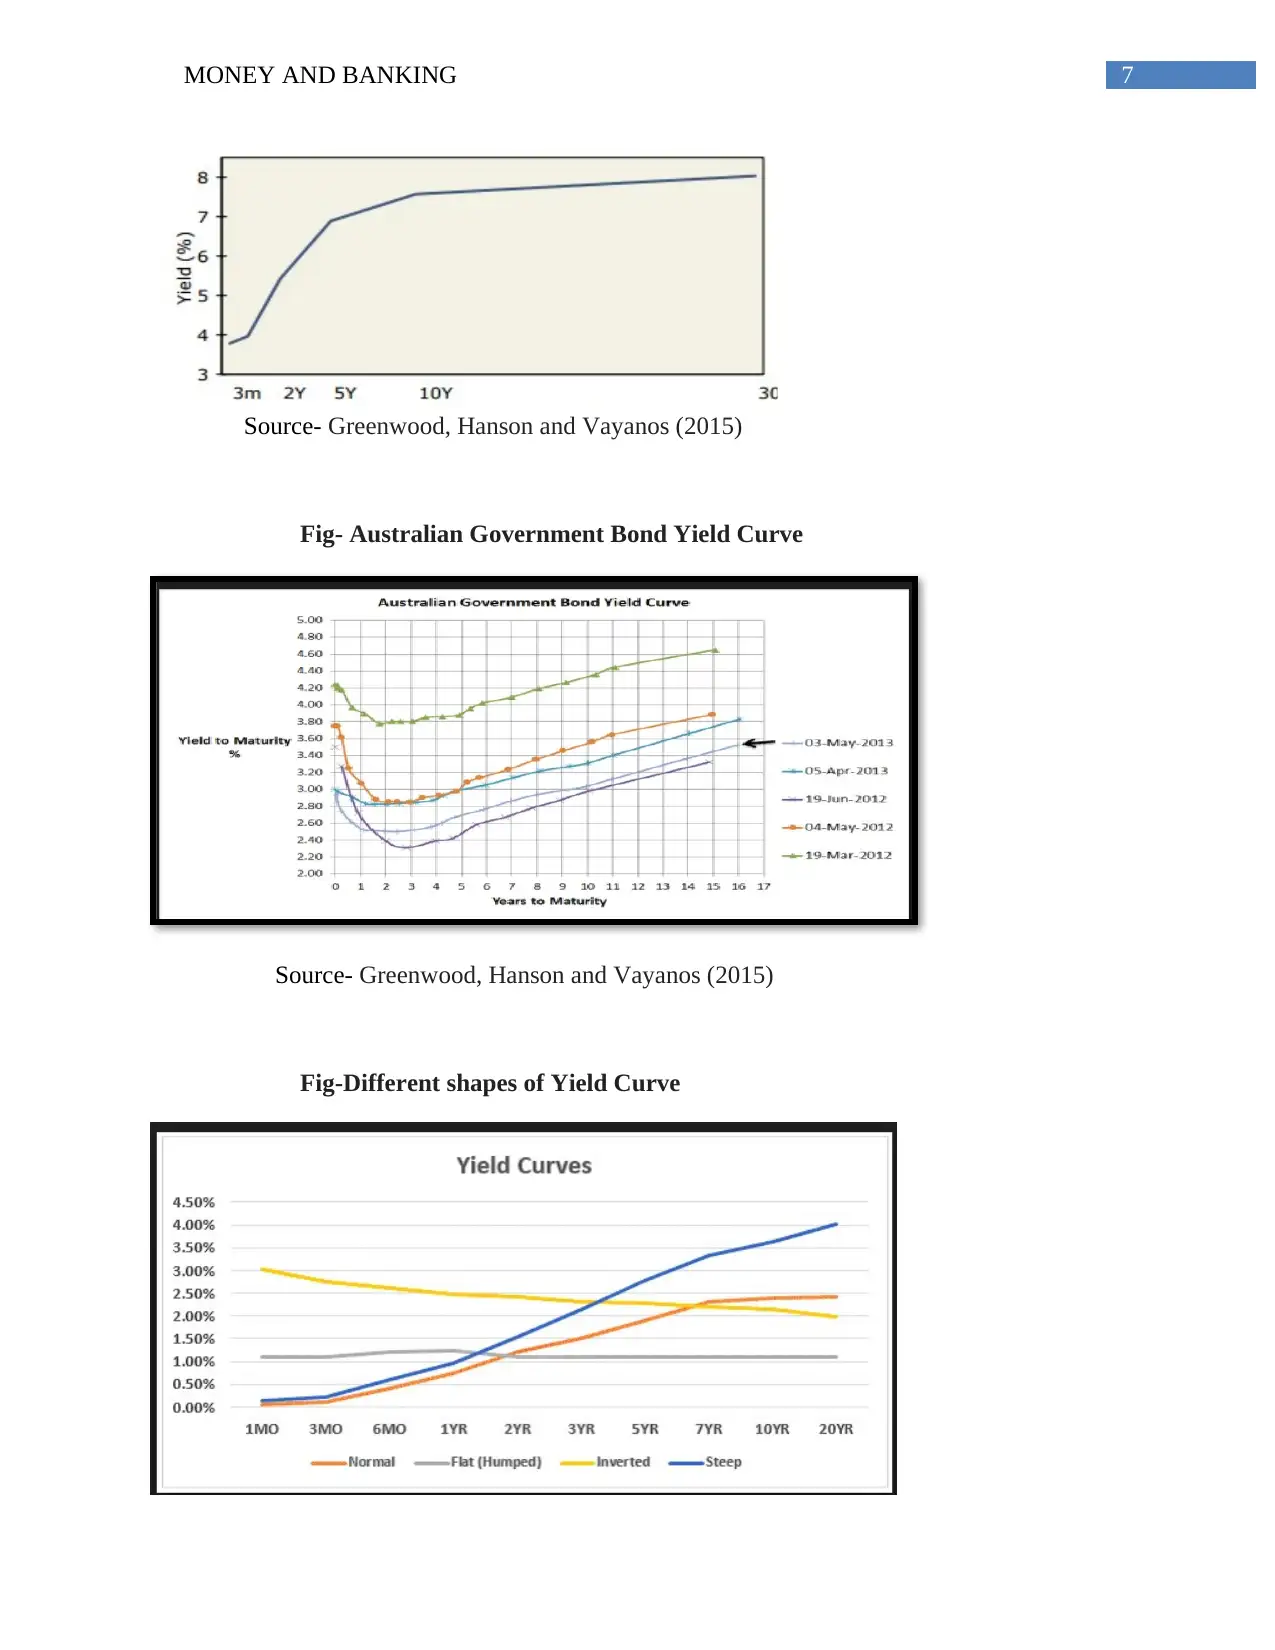
This report provides an in-depth analysis of the yield curves of Australia and the Netherlands. It examines the impact of the yield curve's level, steepness, and curvature on fixed income instruments. The report discusses how these factors influence interest rates and the volatility within the bond market. It also compares the economic implications of yield curve shapes, including upward sloping, flat, and inverted curves, and their relationship to economic activity, inflation, and recession predictions. Furthermore, the report considers the factors that influence the slope of the yield curve, and its relevance in making financial decisions within the economies of Australia and the Netherlands. Various figures illustrating the different shapes of the yield curve are also included to support the analysis.
Document Page
Running head: MONEY AND BANKING
Money and Banking
Name of the Student:
Name of the University:
Author’s Note:
tabler-icon-diamond-filled.svg

Paraphrase This Document

Need a fresh take? Get an instant paraphrase of this document with our AI Paraphraser
Document Page
1MONEY AND BANKING
Executive Summary
This paper will make an in-depth analysis of the yield curve of Australia and Netherland.
Various discussions regarding the effect of the yield curve and comparison between the two
economies is carried out in the paper. The various levels of the yield curve such as level,
curvature , steepness is discussed and its effect on the fixed income instruments is also
highlighted.
Document Page
2MONEY AND BANKING
Contents
Response to Part 2...........................................................................................................................3
Response to Part 3...........................................................................................................................3
Reference List..................................................................................................................................5
Appendices......................................................................................................................................6
Document Page
3MONEY AND BANKING
Response to Part 2
The three main attributes of the yield curve i.e. level, steepness and curvature affects the
fixed income instruments in the long run. The rate of interest is affected by various common
factors. These three factors are responsible for 95% variation in the yield curve. There is a direct
relation between the volatility in the interest rate and the shape of the yield curve. The curvature
of the yield curve is described as butterfly portfolio and it carries a long position in the maturity
of the bond. The slope of the yield curve depends on the future changes in risk premium as well
as interest rate in the short run. The slope of curvature may vary as there is volatility in the short
run across different time periods. In certain cases, the curvature and the slope of the yield curve
depends on the rate of volatility in the short run. (Litterman and Scheinkman 1991). When the
yield curve is steeper, there is higher interest rate volatility. If the economy experiences “level
shock", there will be change in the maturity by the same amount. This will change the level of
the yield curve. Moreover, if the economy experiences shock in the "slope", it will increase the
interest rate in the short term by a larger amount than in the long run. The yield curve will
become less steep and the slope of the yield curve decreases. If the economy experiences shock
in the "curvature", it will affect the medium term interest rates and the yield curve will become
hump shaped. The steepness factor does not correspond to the normal changes as in the case of
normal steep curve but it is the main factor which affects the interest rate to a large extent than
the other factors (Chen and Tsang 2013).
Response to Part 3
The yield curve depicts the yield of the U.S. treasury bills, bonds, notes in systematic
order from short term maturity to long term maturity. The slope of the yield curve reflects the
tabler-icon-diamond-filled.svg

Paraphrase This Document

Need a fresh take? Get an instant paraphrase of this document with our AI Paraphraser
Document Page
4MONEY AND BANKING
short term interest rate of the bond market. It gives a reflection of the various kinds of economic
activities and the level of inflation in the near future. It is very important to analyze the slope of
the yield curve. In case of Australia and Netherland, it can be seen that the shape of the curve is
upward rising i.e. it is moving from left to right. This upward rising slope indicates that the
yields from bond increases with maturity. The upward rising shape of the yield curve is seen
under normal circumstances. In such a case, the investors believes that there are no important
changes in the economy i.e. any inflationary condition will not affect the economy and the
economy will grow at a normal rate. In such a situation, the investors will accept higher amount
of yield for the income instruments with longer maturity rates. The long term income securities
will thus bear higher yield than the short term securities. Sometimes, the yield curve also slopes
downward. (Chinn and Kucko 2015). There is also a case of flattening of the yield curve in both
the economies and this happens when the short term rates are increasing at a much faster rate
than the long term rates. This indicates that the economy of both the countries is growing at a
much slower rate and the investors are at a riskier position. The yield curve also helps in
predicting the recession in an economy. The recessions in both the economies may also lead to
an inverted yield curve. Thus, it can be said that the yield curve can help in the financial
decisions in the economy (Greenwood, Hanson and Vayanos 2015).
Document Page
5MONEY AND BANKING
Reference List
Chen, Y.C. and Tsang, K.P., 2013. What does the yield curve tell us about exchange rate
predictability?. Review of Economics and Statistics, 95(1), pp.185-205.
Chinn, M. and Kucko, K., 2015. The predictive power of the yield curve across countries and
time. International Finance, 18(2), pp.129-156.
Greenwood, R., Hanson, S. and Vayanos, D., 2015. Forward guidance in the yield curve: short
rates versus bond supply (No. w21750). National Bureau of Economic Research.
Litterman, R.B. and Scheinkman, J., 1991. Common factors affecting bond returns. The Journal
of Fixed Income, 1(1), pp.54-61.
Document Page
6MONEY AND BANKING
Appendices
Fig-Inverted Yield Curve
Source- Greenwood, Hanson and Vayanos (2015)
Fig-Flat Yield Curve
Source- Greenwood, Hanson and Vayanos (2015)
Fig-Steep Yield Curve
tabler-icon-diamond-filled.svg

Paraphrase This Document

Need a fresh take? Get an instant paraphrase of this document with our AI Paraphraser
Document Page
7MONEY AND BANKING
Source- Greenwood, Hanson and Vayanos (2015)
Fig- Australian Government Bond Yield Curve
Source- Greenwood, Hanson and Vayanos (2015)
Fig-Different shapes of Yield Curve
Document Page
8MONEY AND BANKING
Source- Greenwood, Hanson and Vayanos (2015)
chevron_up_icon
1 out of 9
circle_padding
hide_on_mobile
zoom_out_icon
[object Object]