International Financial Markets and Institutions: Yield & P/E Analysis
VerifiedAdded on 2022/08/27
|15
|2749
|16
Report
AI Summary
This report provides a comprehensive analysis of international financial markets, focusing on yield curves and price-earnings (P/E) ratios. The first section defines yield curves, explains their different types (normal, inverted, and flat), and discusses the theories behind them, including market segmentation and liquidity preference theories. The analysis extends to examining the yield curves for 10-year government bonds in the UK, US, and China, drawing conclusions about market expectations and economic conditions. The second section delves into the P/E ratio, explaining its use in stock valuation and its theoretical underpinnings. It then presents a comparative analysis of P/E ratios for major Australian banks (Westpac, National Australia Bank, Commonwealth Bank, and ANZ) over a five-year period, including graphical representations and comparisons with industry averages. The report concludes with a discussion on the implications of these ratios for investors and the overall health of the banking sector.
Running head: INTERNATIONAL FINANCIAL MARKETS AND INSTITUTION
INTERNATIONAL FINANCIAL MARKETS AND INSTITUTION
Name of the Student
Name of the University
Author Note
INTERNATIONAL FINANCIAL MARKETS AND INSTITUTION
Name of the Student
Name of the University
Author Note
Paraphrase This Document
Need a fresh take? Get an instant paraphrase of this document with our AI Paraphraser
1
INTERNATIONAL FINANCIAL MARKETS AND INSTITUTION
Table of Contents
Answer to Question 1:................................................................................................................2
Yield curve.............................................................................................................................2
Explanation of the Yield Curve..............................................................................................2
Theories of Yield Curve.........................................................................................................4
Yield Curve for the 10-Year Government Bonds..................................................................5
Answer to Question 2:................................................................................................................7
Price Earnings Ratio...............................................................................................................7
Theory of Price Earnings Ratio..............................................................................................7
Data Collection of Organizations...........................................................................................8
Industry price earnings ratio and Index price earnings ratio..................................................9
Comparison of each share for each time period...................................................................11
References................................................................................................................................13
2
INTERNATIONAL FINANCIAL MARKETS AND INSTITUTION
Answer to Question 1:
Yield curve
Yield curve can be defined as a curve that will display the rate of interest which is
being associated with the different lengths of contract which is for a specific debt instrument.
It will help in summarizing the usual relationship in-between the time of maturity of the debt
which is considered as the term and the yield which is the interest rate that is being associated
with the term.
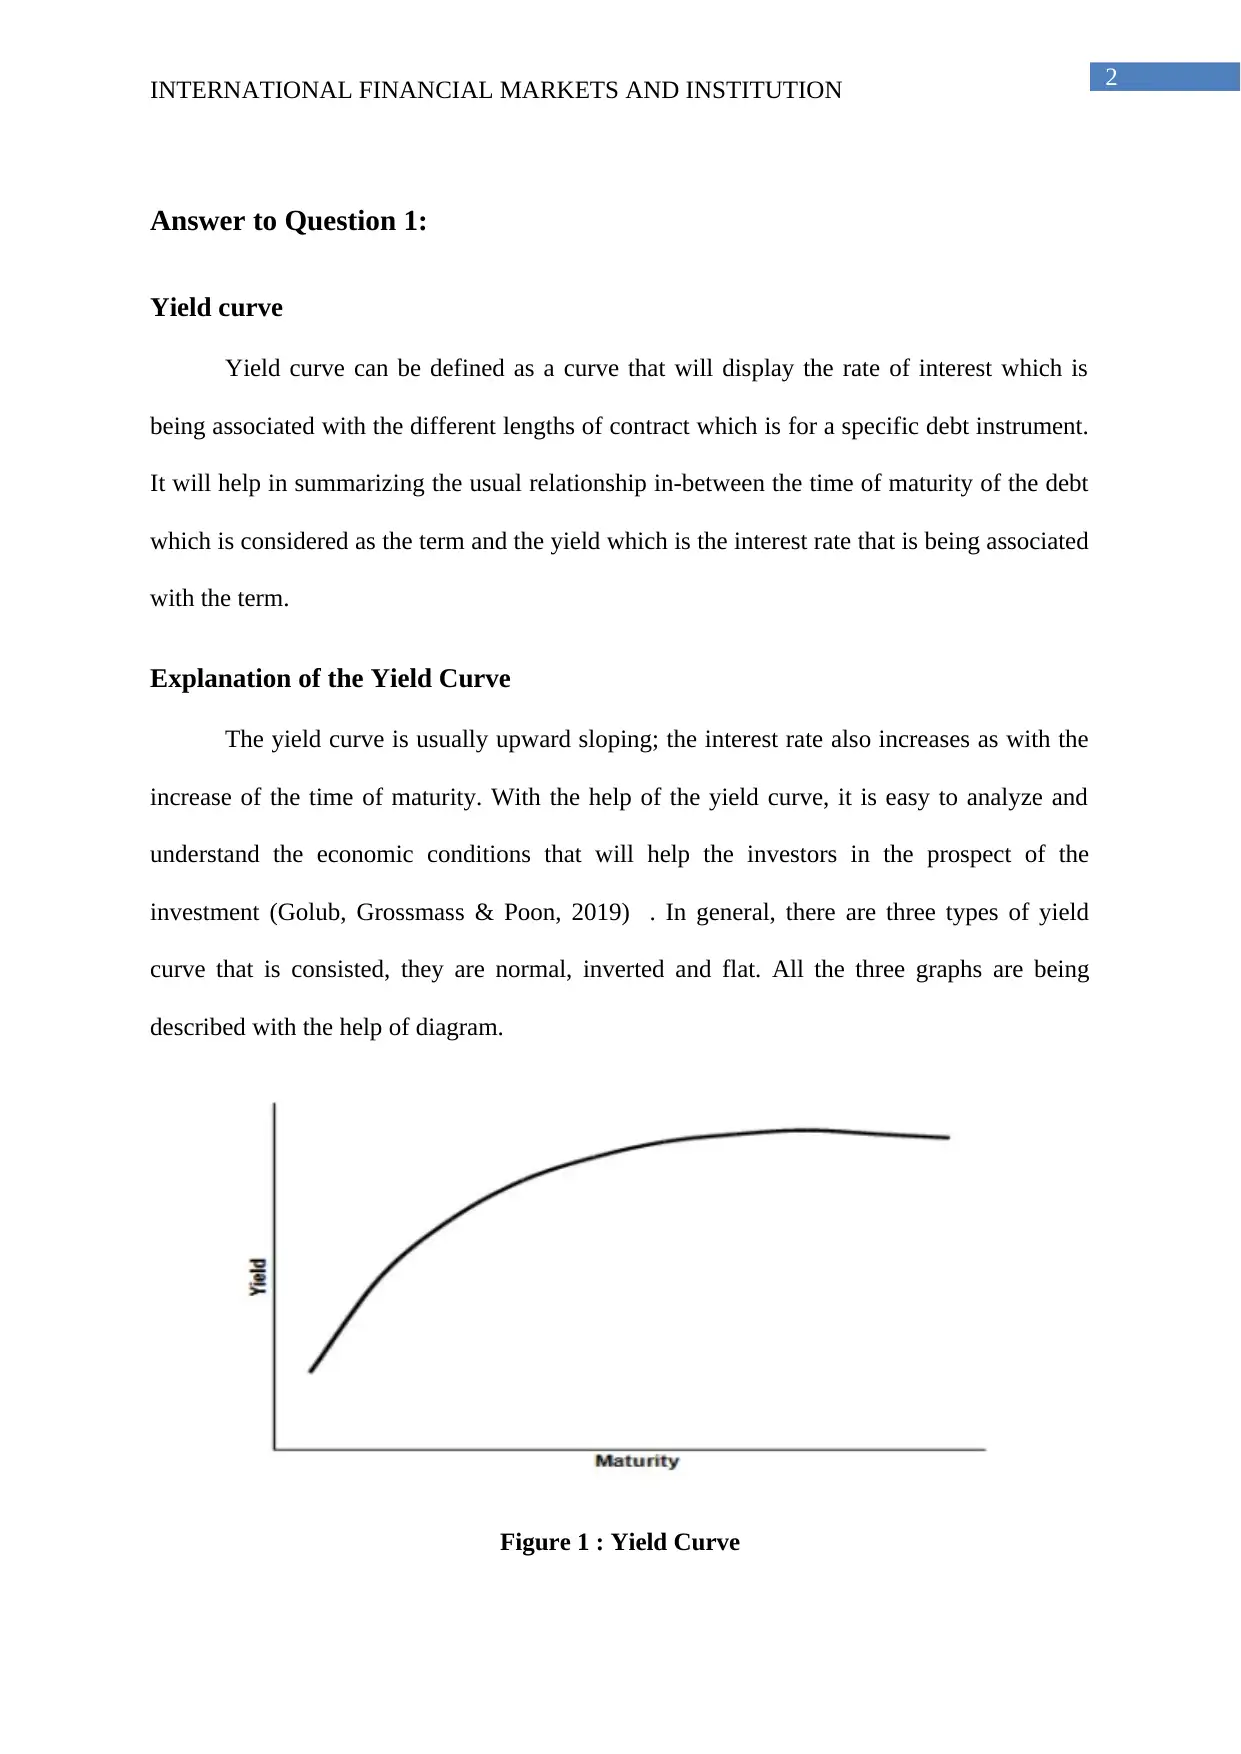
Explanation of the Yield Curve
The yield curve is usually upward sloping; the interest rate also increases as with the
increase of the time of maturity. With the help of the yield curve, it is easy to analyze and
understand the economic conditions that will help the investors in the prospect of the
investment (Golub, Grossmass & Poon, 2019) . In general, there are three types of yield
curve that is consisted, they are normal, inverted and flat. All the three graphs are being
described with the help of diagram.
Figure 1 : Yield Curve
INTERNATIONAL FINANCIAL MARKETS AND INSTITUTION
Answer to Question 1:
Yield curve
Yield curve can be defined as a curve that will display the rate of interest which is
being associated with the different lengths of contract which is for a specific debt instrument.
It will help in summarizing the usual relationship in-between the time of maturity of the debt
which is considered as the term and the yield which is the interest rate that is being associated
with the term.
Explanation of the Yield Curve
The yield curve is usually upward sloping; the interest rate also increases as with the
increase of the time of maturity. With the help of the yield curve, it is easy to analyze and
understand the economic conditions that will help the investors in the prospect of the
investment (Golub, Grossmass & Poon, 2019) . In general, there are three types of yield
curve that is consisted, they are normal, inverted and flat. All the three graphs are being
described with the help of diagram.
Figure 1 : Yield Curve
⊘ This is a preview!⊘
Do you want full access?
Subscribe today to unlock all pages.
Trusted by 1+ million students worldwide
3
INTERNATIONAL FINANCIAL MARKETS AND INSTITUTION
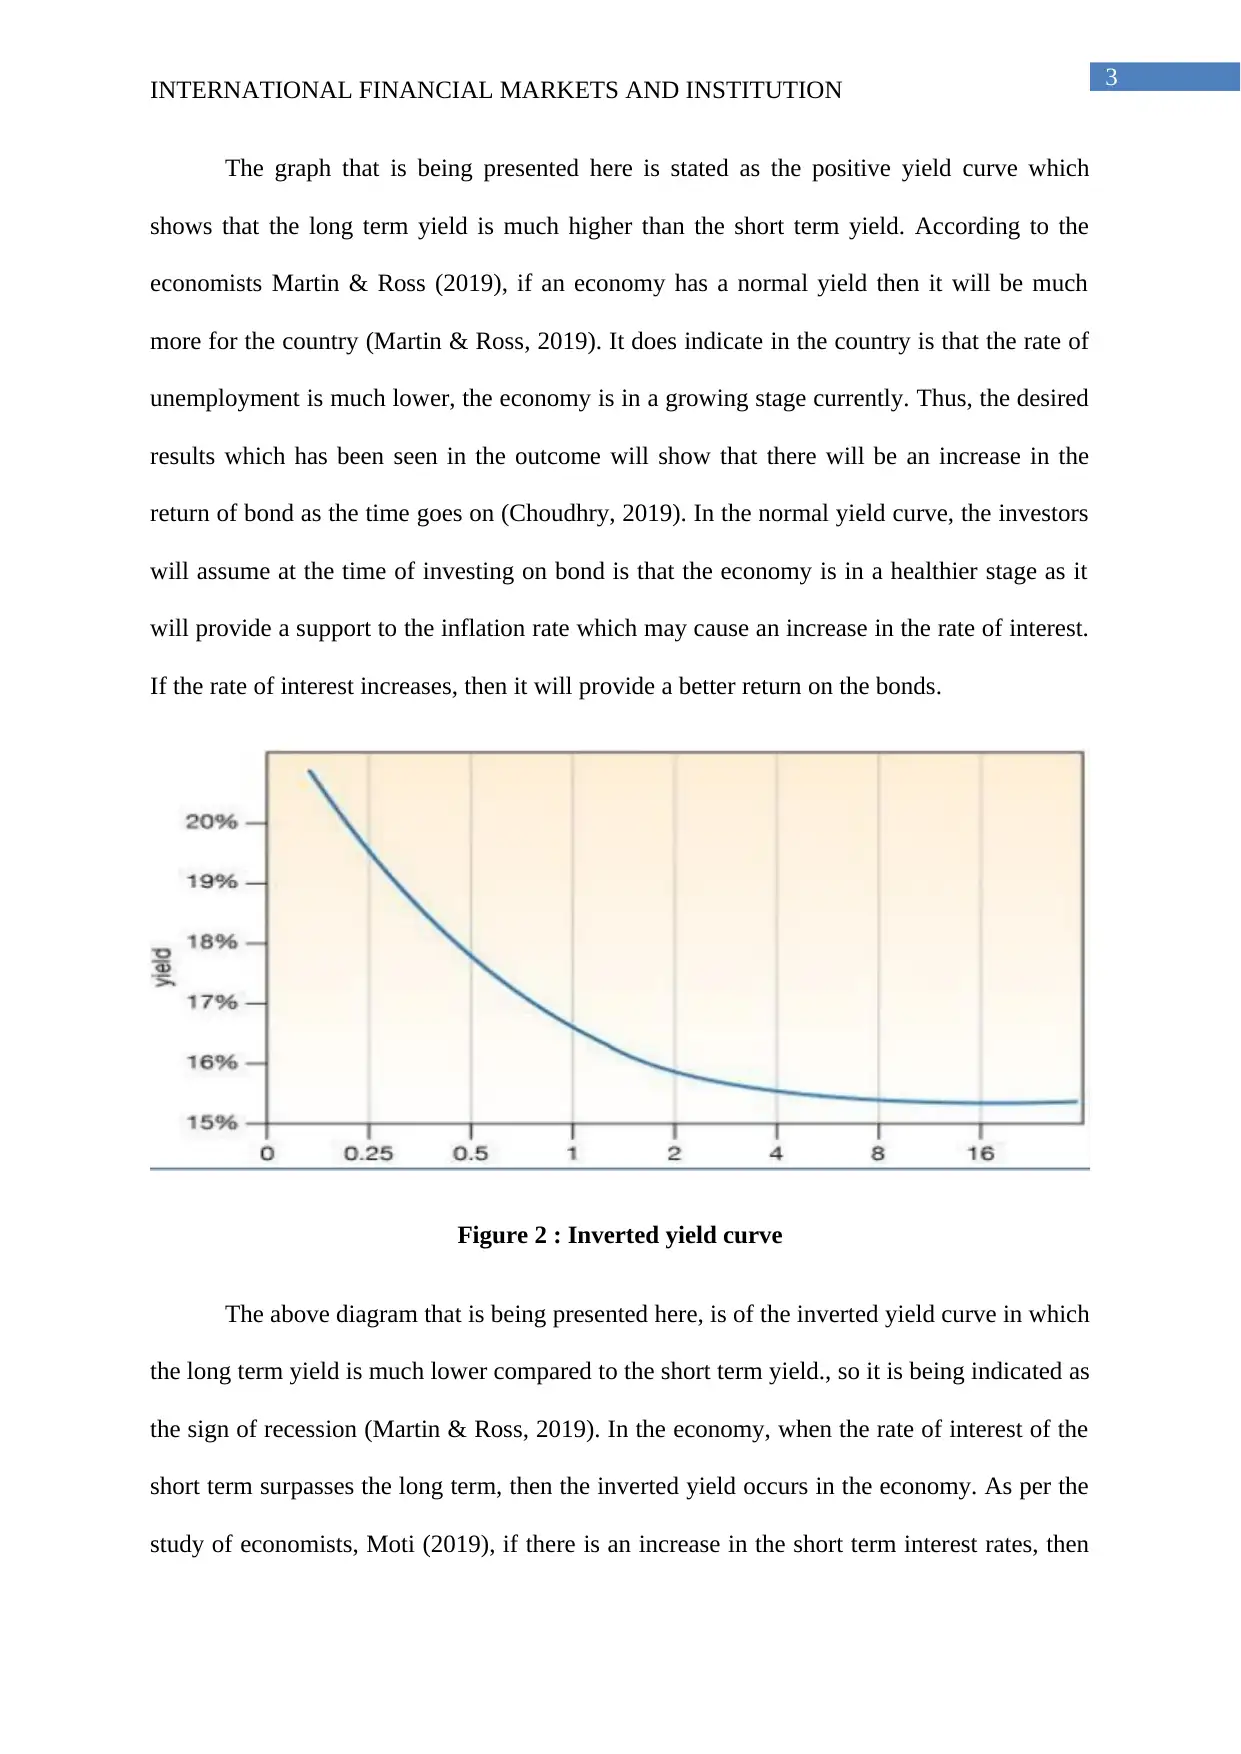
The graph that is being presented here is stated as the positive yield curve which
shows that the long term yield is much higher than the short term yield. According to the
economists Martin & Ross (2019), if an economy has a normal yield then it will be much
more for the country (Martin & Ross, 2019). It does indicate in the country is that the rate of
unemployment is much lower, the economy is in a growing stage currently. Thus, the desired
results which has been seen in the outcome will show that there will be an increase in the
return of bond as the time goes on (Choudhry, 2019). In the normal yield curve, the investors
will assume at the time of investing on bond is that the economy is in a healthier stage as it
will provide a support to the inflation rate which may cause an increase in the rate of interest.
If the rate of interest increases, then it will provide a better return on the bonds.
Figure 2 : Inverted yield curve
The above diagram that is being presented here, is of the inverted yield curve in which
the long term yield is much lower compared to the short term yield., so it is being indicated as
the sign of recession (Martin & Ross, 2019). In the economy, when the rate of interest of the
short term surpasses the long term, then the inverted yield occurs in the economy. As per the
study of economists, Moti (2019), if there is an increase in the short term interest rates, then
INTERNATIONAL FINANCIAL MARKETS AND INSTITUTION
The graph that is being presented here is stated as the positive yield curve which
shows that the long term yield is much higher than the short term yield. According to the
economists Martin & Ross (2019), if an economy has a normal yield then it will be much
more for the country (Martin & Ross, 2019). It does indicate in the country is that the rate of
unemployment is much lower, the economy is in a growing stage currently. Thus, the desired
results which has been seen in the outcome will show that there will be an increase in the
return of bond as the time goes on (Choudhry, 2019). In the normal yield curve, the investors
will assume at the time of investing on bond is that the economy is in a healthier stage as it
will provide a support to the inflation rate which may cause an increase in the rate of interest.
If the rate of interest increases, then it will provide a better return on the bonds.
Figure 2 : Inverted yield curve
The above diagram that is being presented here, is of the inverted yield curve in which
the long term yield is much lower compared to the short term yield., so it is being indicated as
the sign of recession (Martin & Ross, 2019). In the economy, when the rate of interest of the
short term surpasses the long term, then the inverted yield occurs in the economy. As per the
study of economists, Moti (2019), if there is an increase in the short term interest rates, then
Paraphrase This Document
Need a fresh take? Get an instant paraphrase of this document with our AI Paraphraser
4
INTERNATIONAL FINANCIAL MARKETS AND INSTITUTION
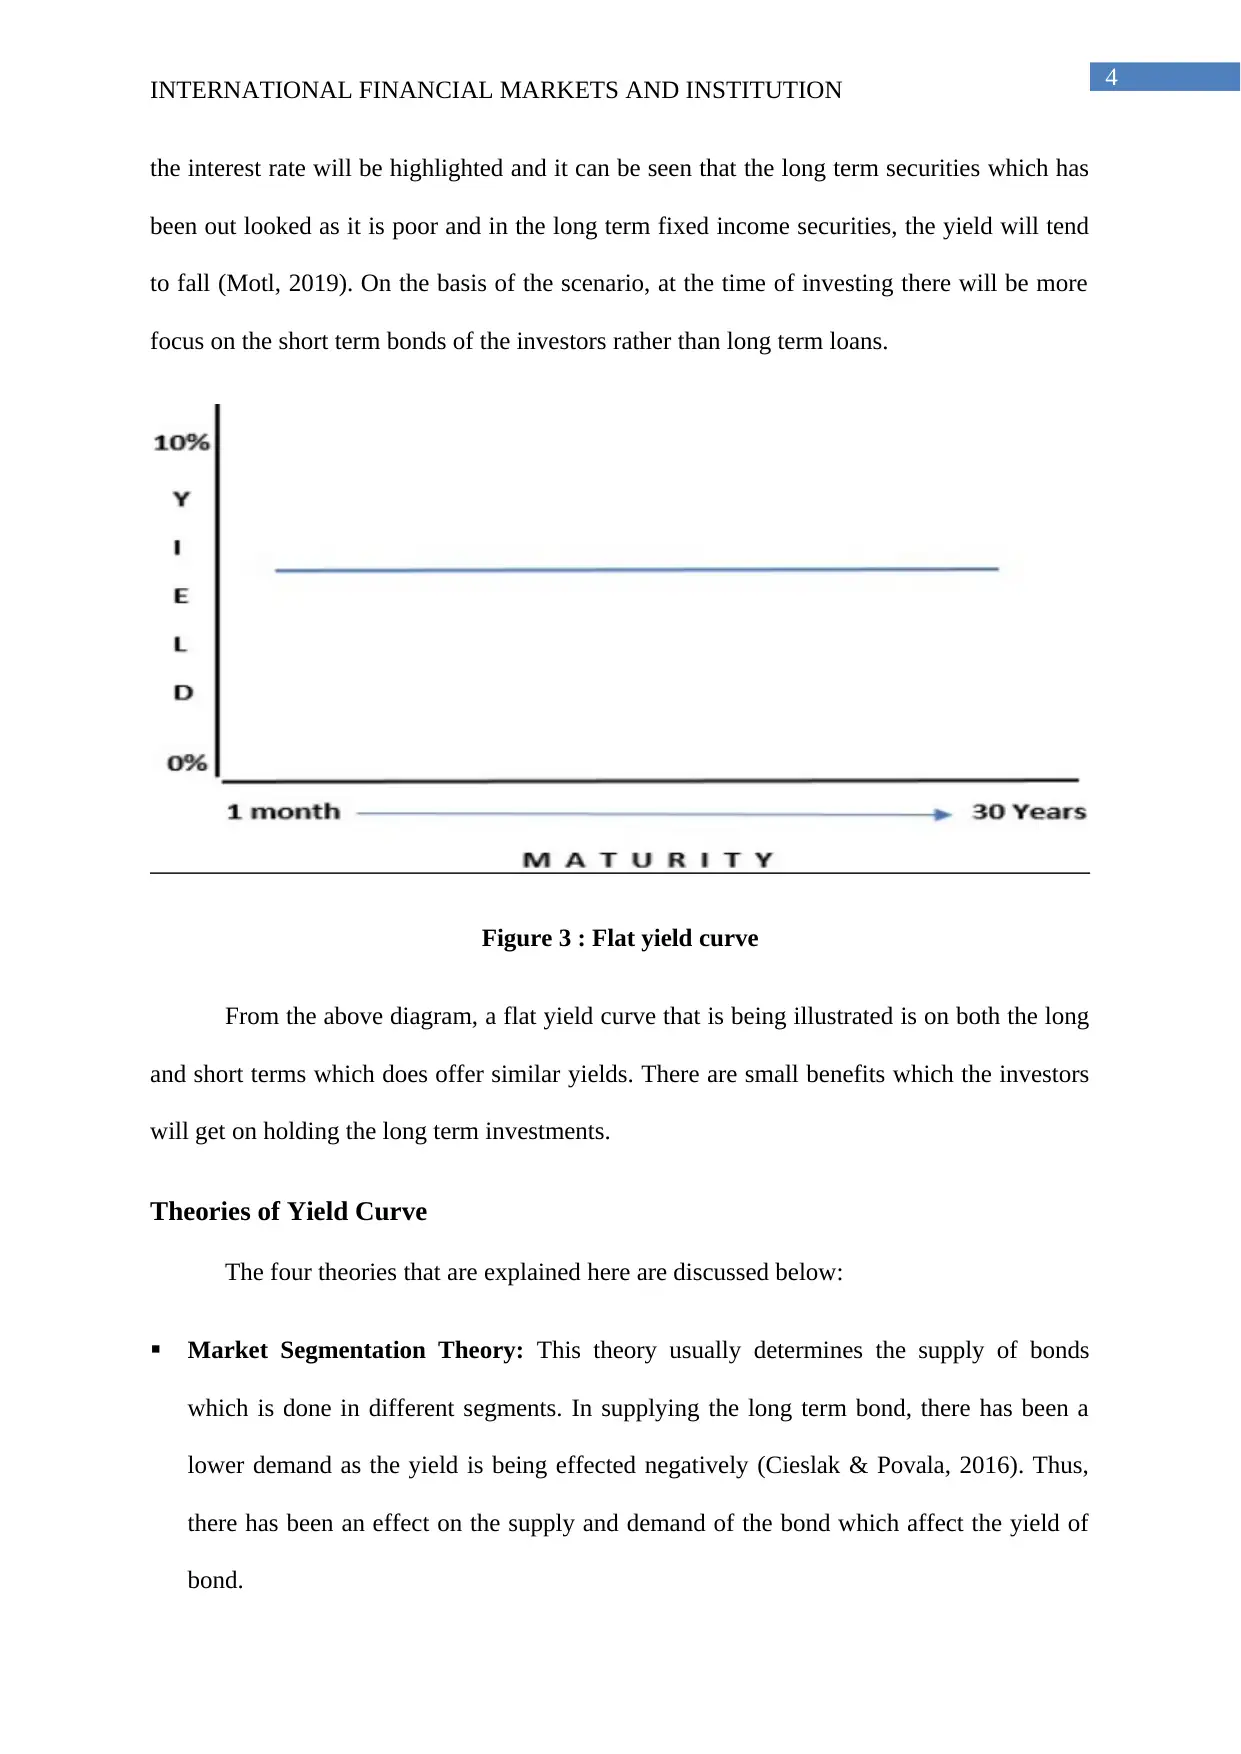
the interest rate will be highlighted and it can be seen that the long term securities which has
been out looked as it is poor and in the long term fixed income securities, the yield will tend
to fall (Motl, 2019). On the basis of the scenario, at the time of investing there will be more
focus on the short term bonds of the investors rather than long term loans.
Figure 3 : Flat yield curve
From the above diagram, a flat yield curve that is being illustrated is on both the long
and short terms which does offer similar yields. There are small benefits which the investors
will get on holding the long term investments.
Theories of Yield Curve
The four theories that are explained here are discussed below:
Market Segmentation Theory: This theory usually determines the supply of bonds
which is done in different segments. In supplying the long term bond, there has been a
lower demand as the yield is being effected negatively (Cieslak & Povala, 2016). Thus,
there has been an effect on the supply and demand of the bond which affect the yield of
bond.
INTERNATIONAL FINANCIAL MARKETS AND INSTITUTION
the interest rate will be highlighted and it can be seen that the long term securities which has
been out looked as it is poor and in the long term fixed income securities, the yield will tend
to fall (Motl, 2019). On the basis of the scenario, at the time of investing there will be more
focus on the short term bonds of the investors rather than long term loans.
Figure 3 : Flat yield curve
From the above diagram, a flat yield curve that is being illustrated is on both the long
and short terms which does offer similar yields. There are small benefits which the investors
will get on holding the long term investments.
Theories of Yield Curve
The four theories that are explained here are discussed below:
Market Segmentation Theory: This theory usually determines the supply of bonds
which is done in different segments. In supplying the long term bond, there has been a
lower demand as the yield is being effected negatively (Cieslak & Povala, 2016). Thus,
there has been an effect on the supply and demand of the bond which affect the yield of
bond.
5
INTERNATIONAL FINANCIAL MARKETS AND INSTITUTION
Liquidity Preference Theory: In this, the investors do prefer a high liquidity on the
investment that is short term rather than the long term. Thus, it has an inverted curve and
there is preference of short term bonds by an investor.
Yield Curve for the 10-Year Government Bonds
There has been providence of the 10-year Government Bond, of three countries i.e.
United Kingdom, United States and China.
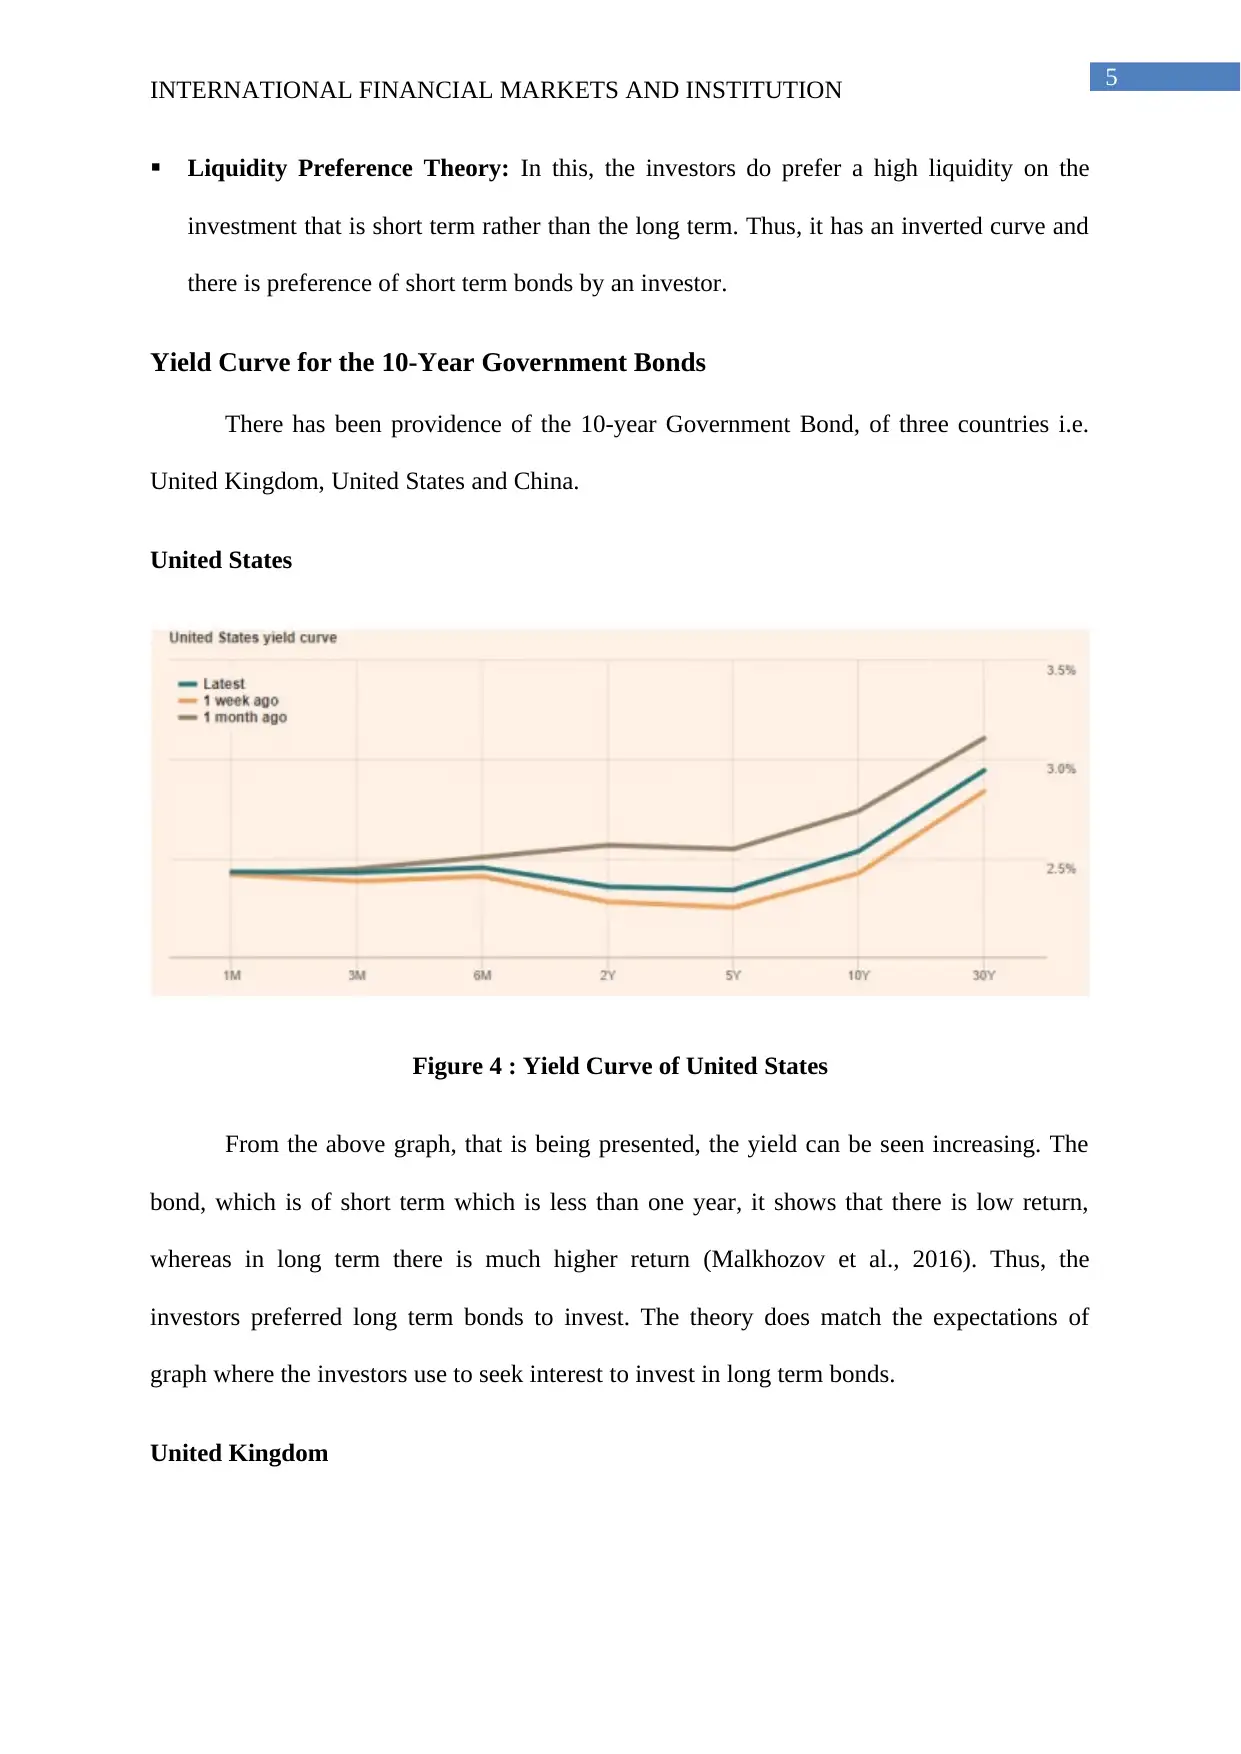
United States
Figure 4 : Yield Curve of United States
From the above graph, that is being presented, the yield can be seen increasing. The
bond, which is of short term which is less than one year, it shows that there is low return,
whereas in long term there is much higher return (Malkhozov et al., 2016). Thus, the
investors preferred long term bonds to invest. The theory does match the expectations of
graph where the investors use to seek interest to invest in long term bonds.
United Kingdom
INTERNATIONAL FINANCIAL MARKETS AND INSTITUTION
Liquidity Preference Theory: In this, the investors do prefer a high liquidity on the
investment that is short term rather than the long term. Thus, it has an inverted curve and
there is preference of short term bonds by an investor.
Yield Curve for the 10-Year Government Bonds
There has been providence of the 10-year Government Bond, of three countries i.e.
United Kingdom, United States and China.
United States
Figure 4 : Yield Curve of United States
From the above graph, that is being presented, the yield can be seen increasing. The
bond, which is of short term which is less than one year, it shows that there is low return,
whereas in long term there is much higher return (Malkhozov et al., 2016). Thus, the
investors preferred long term bonds to invest. The theory does match the expectations of
graph where the investors use to seek interest to invest in long term bonds.
United Kingdom
⊘ This is a preview!⊘
Do you want full access?
Subscribe today to unlock all pages.
Trusted by 1+ million students worldwide
6
INTERNATIONAL FINANCIAL MARKETS AND INSTITUTION
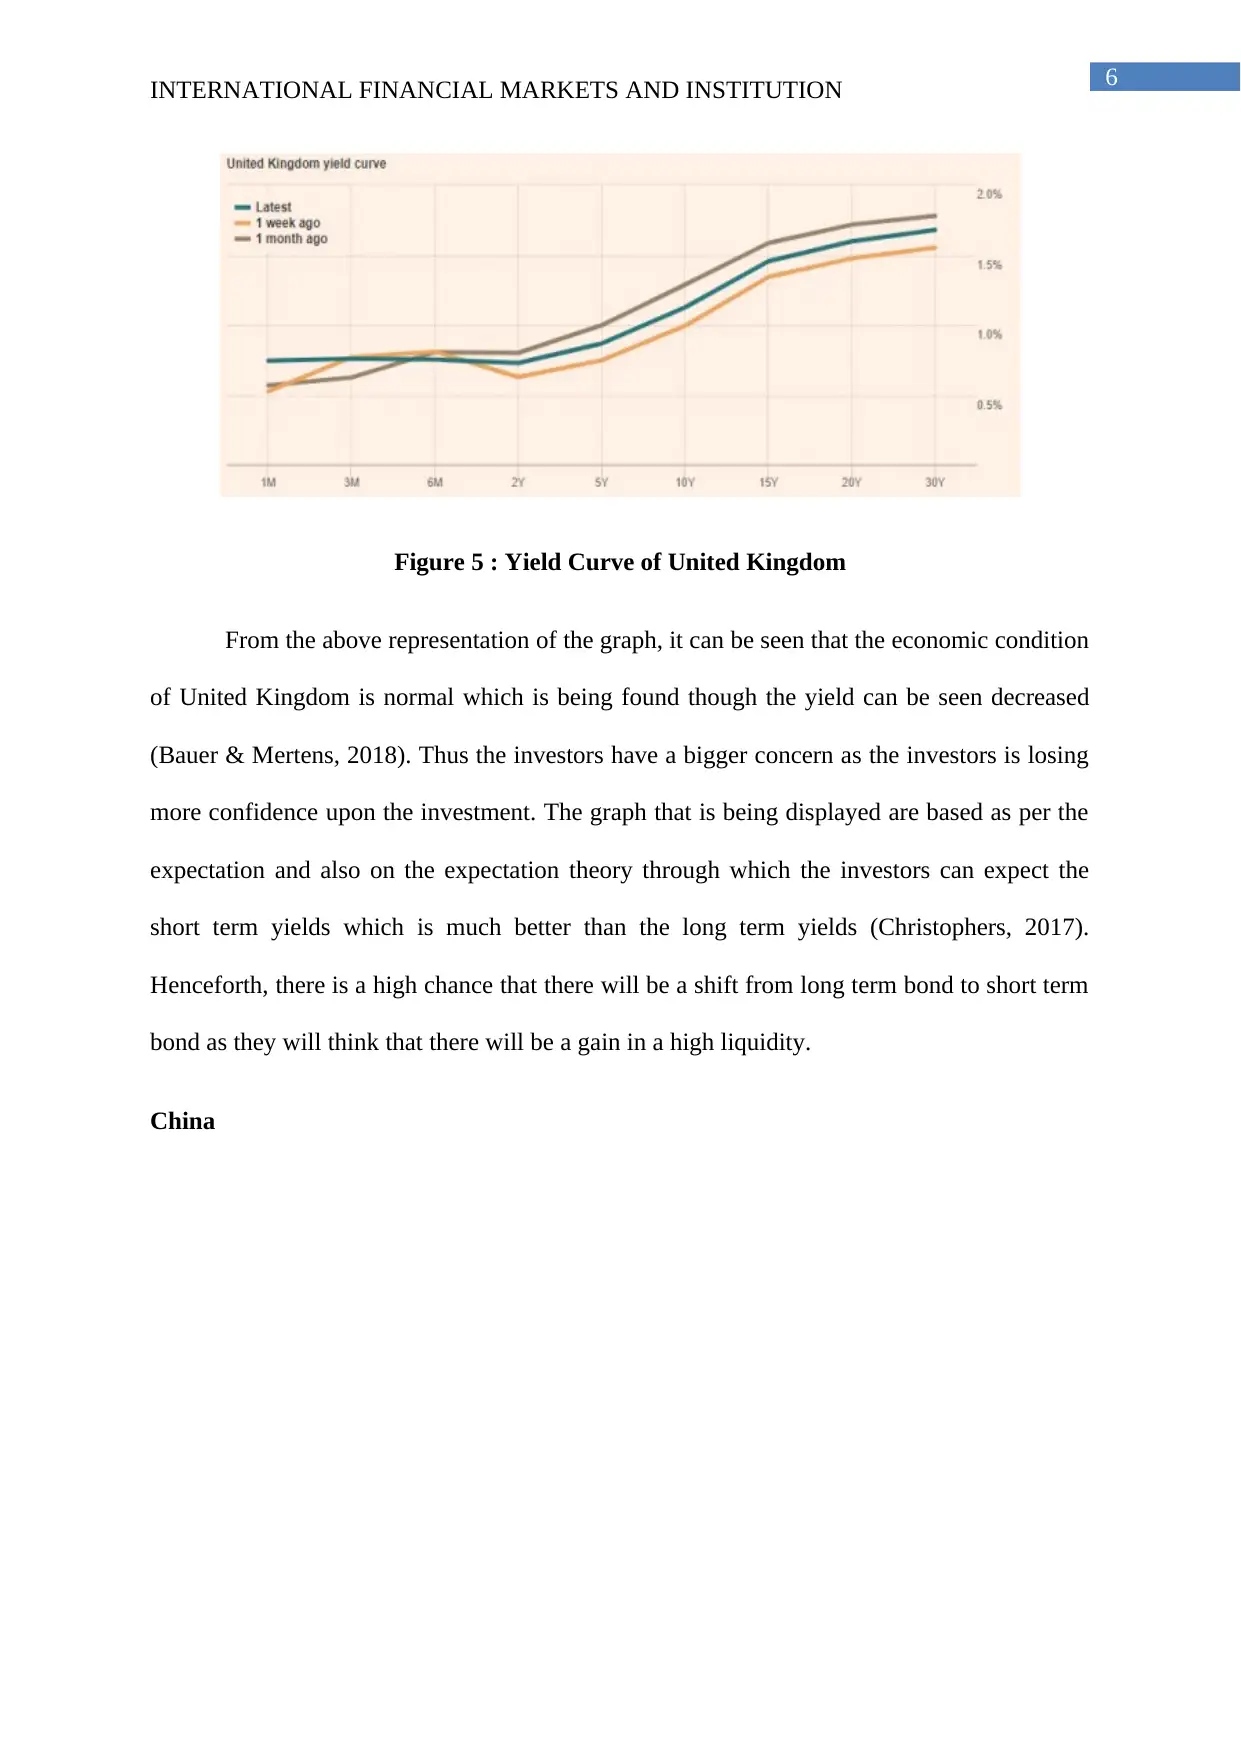
Figure 5 : Yield Curve of United Kingdom
From the above representation of the graph, it can be seen that the economic condition
of United Kingdom is normal which is being found though the yield can be seen decreased
(Bauer & Mertens, 2018). Thus the investors have a bigger concern as the investors is losing
more confidence upon the investment. The graph that is being displayed are based as per the
expectation and also on the expectation theory through which the investors can expect the
short term yields which is much better than the long term yields (Christophers, 2017).
Henceforth, there is a high chance that there will be a shift from long term bond to short term
bond as they will think that there will be a gain in a high liquidity.
China
INTERNATIONAL FINANCIAL MARKETS AND INSTITUTION
Figure 5 : Yield Curve of United Kingdom
From the above representation of the graph, it can be seen that the economic condition
of United Kingdom is normal which is being found though the yield can be seen decreased
(Bauer & Mertens, 2018). Thus the investors have a bigger concern as the investors is losing
more confidence upon the investment. The graph that is being displayed are based as per the
expectation and also on the expectation theory through which the investors can expect the
short term yields which is much better than the long term yields (Christophers, 2017).
Henceforth, there is a high chance that there will be a shift from long term bond to short term
bond as they will think that there will be a gain in a high liquidity.
China
Paraphrase This Document
Need a fresh take? Get an instant paraphrase of this document with our AI Paraphraser
7
INTERNATIONAL FINANCIAL MARKETS AND INSTITUTION
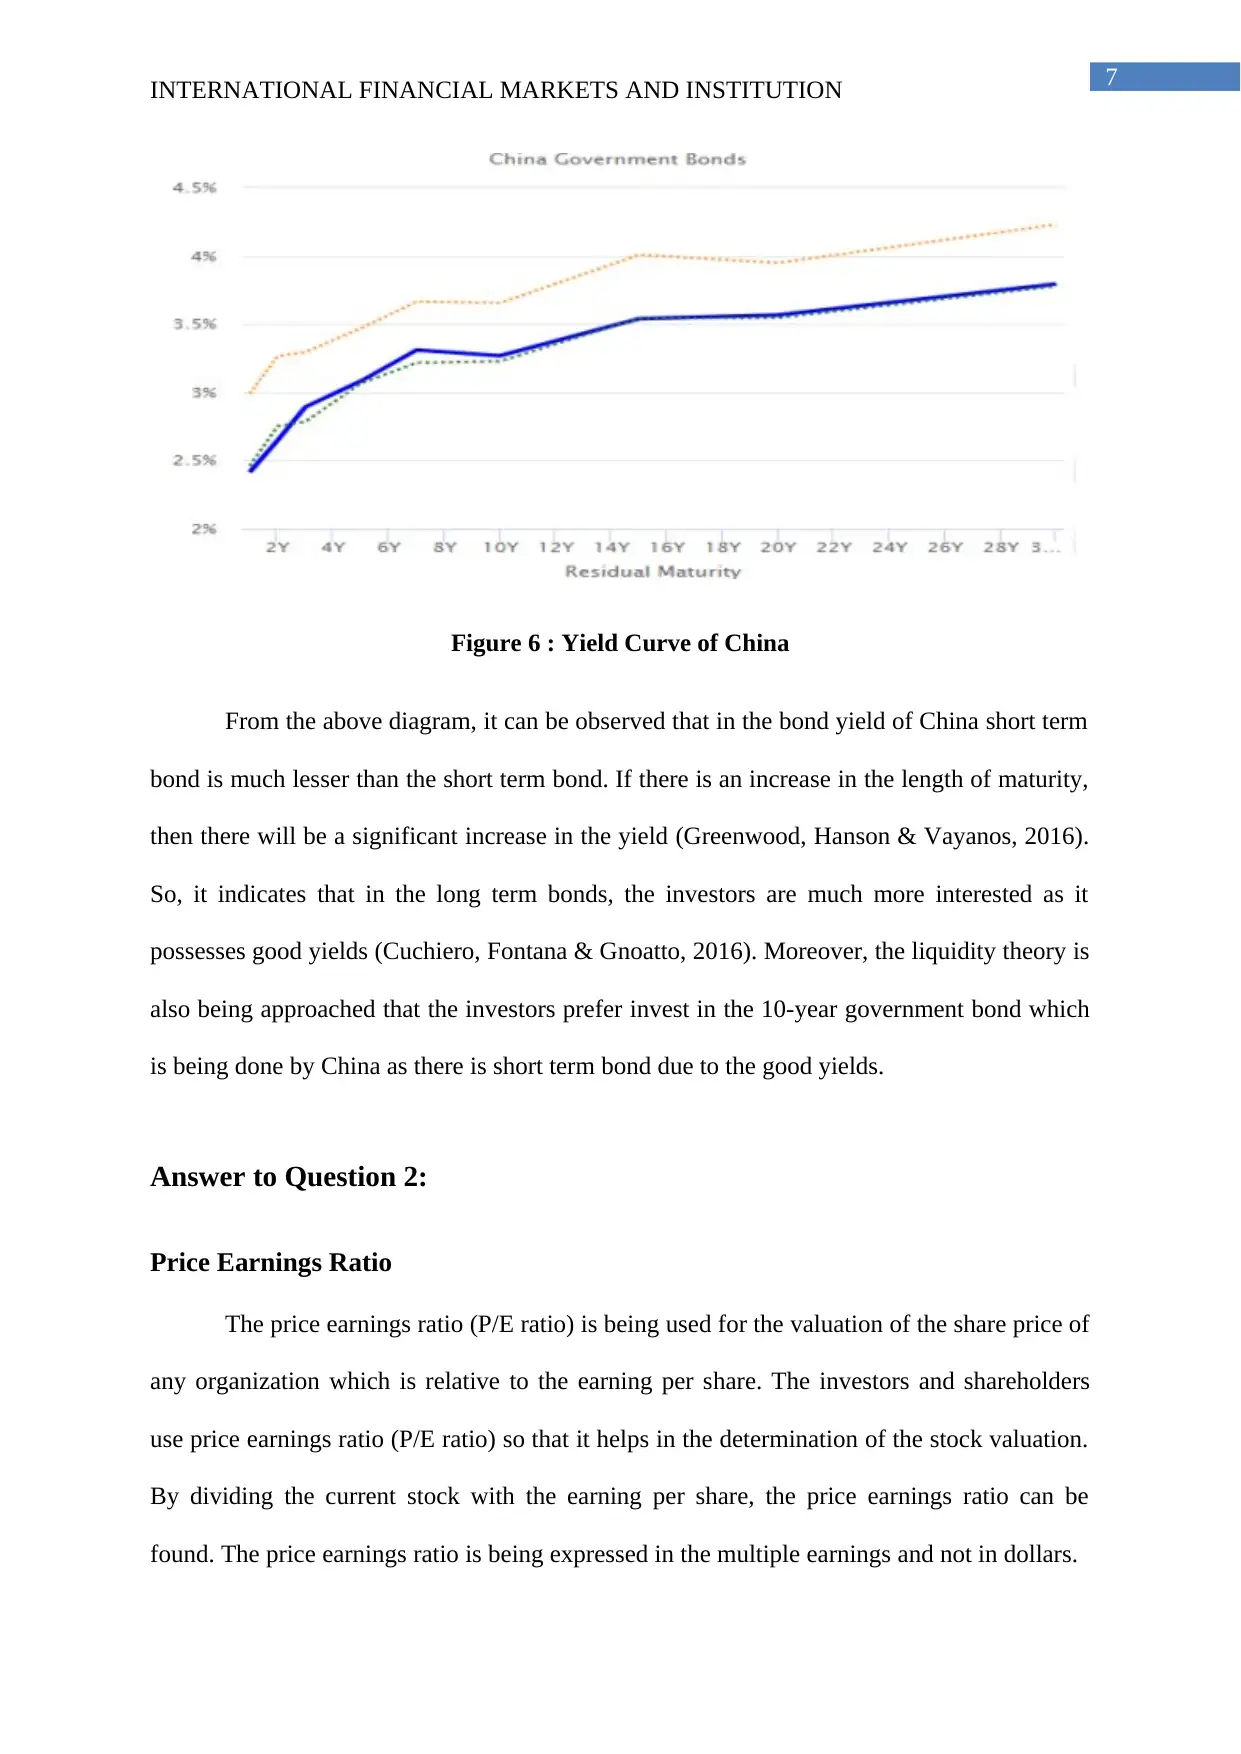
Figure 6 : Yield Curve of China
From the above diagram, it can be observed that in the bond yield of China short term
bond is much lesser than the short term bond. If there is an increase in the length of maturity,
then there will be a significant increase in the yield (Greenwood, Hanson & Vayanos, 2016).
So, it indicates that in the long term bonds, the investors are much more interested as it
possesses good yields (Cuchiero, Fontana & Gnoatto, 2016). Moreover, the liquidity theory is
also being approached that the investors prefer invest in the 10-year government bond which
is being done by China as there is short term bond due to the good yields.
Answer to Question 2:
Price Earnings Ratio
The price earnings ratio (P/E ratio) is being used for the valuation of the share price of
any organization which is relative to the earning per share. The investors and shareholders
use price earnings ratio (P/E ratio) so that it helps in the determination of the stock valuation.
By dividing the current stock with the earning per share, the price earnings ratio can be
found. The price earnings ratio is being expressed in the multiple earnings and not in dollars.
INTERNATIONAL FINANCIAL MARKETS AND INSTITUTION
Figure 6 : Yield Curve of China
From the above diagram, it can be observed that in the bond yield of China short term
bond is much lesser than the short term bond. If there is an increase in the length of maturity,
then there will be a significant increase in the yield (Greenwood, Hanson & Vayanos, 2016).
So, it indicates that in the long term bonds, the investors are much more interested as it
possesses good yields (Cuchiero, Fontana & Gnoatto, 2016). Moreover, the liquidity theory is
also being approached that the investors prefer invest in the 10-year government bond which
is being done by China as there is short term bond due to the good yields.
Answer to Question 2:
Price Earnings Ratio
The price earnings ratio (P/E ratio) is being used for the valuation of the share price of
any organization which is relative to the earning per share. The investors and shareholders
use price earnings ratio (P/E ratio) so that it helps in the determination of the stock valuation.
By dividing the current stock with the earning per share, the price earnings ratio can be
found. The price earnings ratio is being expressed in the multiple earnings and not in dollars.
8
INTERNATIONAL FINANCIAL MARKETS AND INSTITUTION
Theory of Price Earnings Ratio
On study of certain economists, it can be seen that the investors do have the concern
of checking the other share of organization. Thus, the ratio through which the investors does
the comparison and check it is with the price earnings ratio so that it can give a clear idea
about the financial status of the organization (Kumar & Venoor, 2018). Though at the time of
interpretation, sometimes it is difficult to find out the results by analyst. The information that
has been provided is being important as well as informative so further it is very much
difficult at the time of analyzing.
The study shows that, at the time of looking into the price earnings ratio, the
information that is being analyzed are either compared to the historical data of the
organization or with the competitor’s organization which is usually on the same industry. At
the time of buying the shares of the organization, the investors do want to invest at the
organization in which they are will get a better return. With the help of price earnings ratio, it
can be easily determined the value of the stock as it shows the fair price that is being paid
(Öztürk & Karabulut, 2018). The organizations that have a high price earnings ratio it is
known as the growth stocks that will state that it will give a better result in the future and the
expectation sis much higher compared to the other organizations. There has been a
disadvantage in the growing stock as it can be risk at the time of investment due to the much
more vitality (Siladjaja & Anwar, 2019). If the organizations do have the high price earnings
ratio, then it is being indicated that the stock is being overvalued. On the other side, it can be
seen that the organizations those have a lower price earnings ratio, will be considered as an
undervalued stock.
⊘ This is a preview!⊘
Do you want full access?
Subscribe today to unlock all pages.
Trusted by 1+ million students worldwide
9
INTERNATIONAL FINANCIAL MARKETS AND INSTITUTION
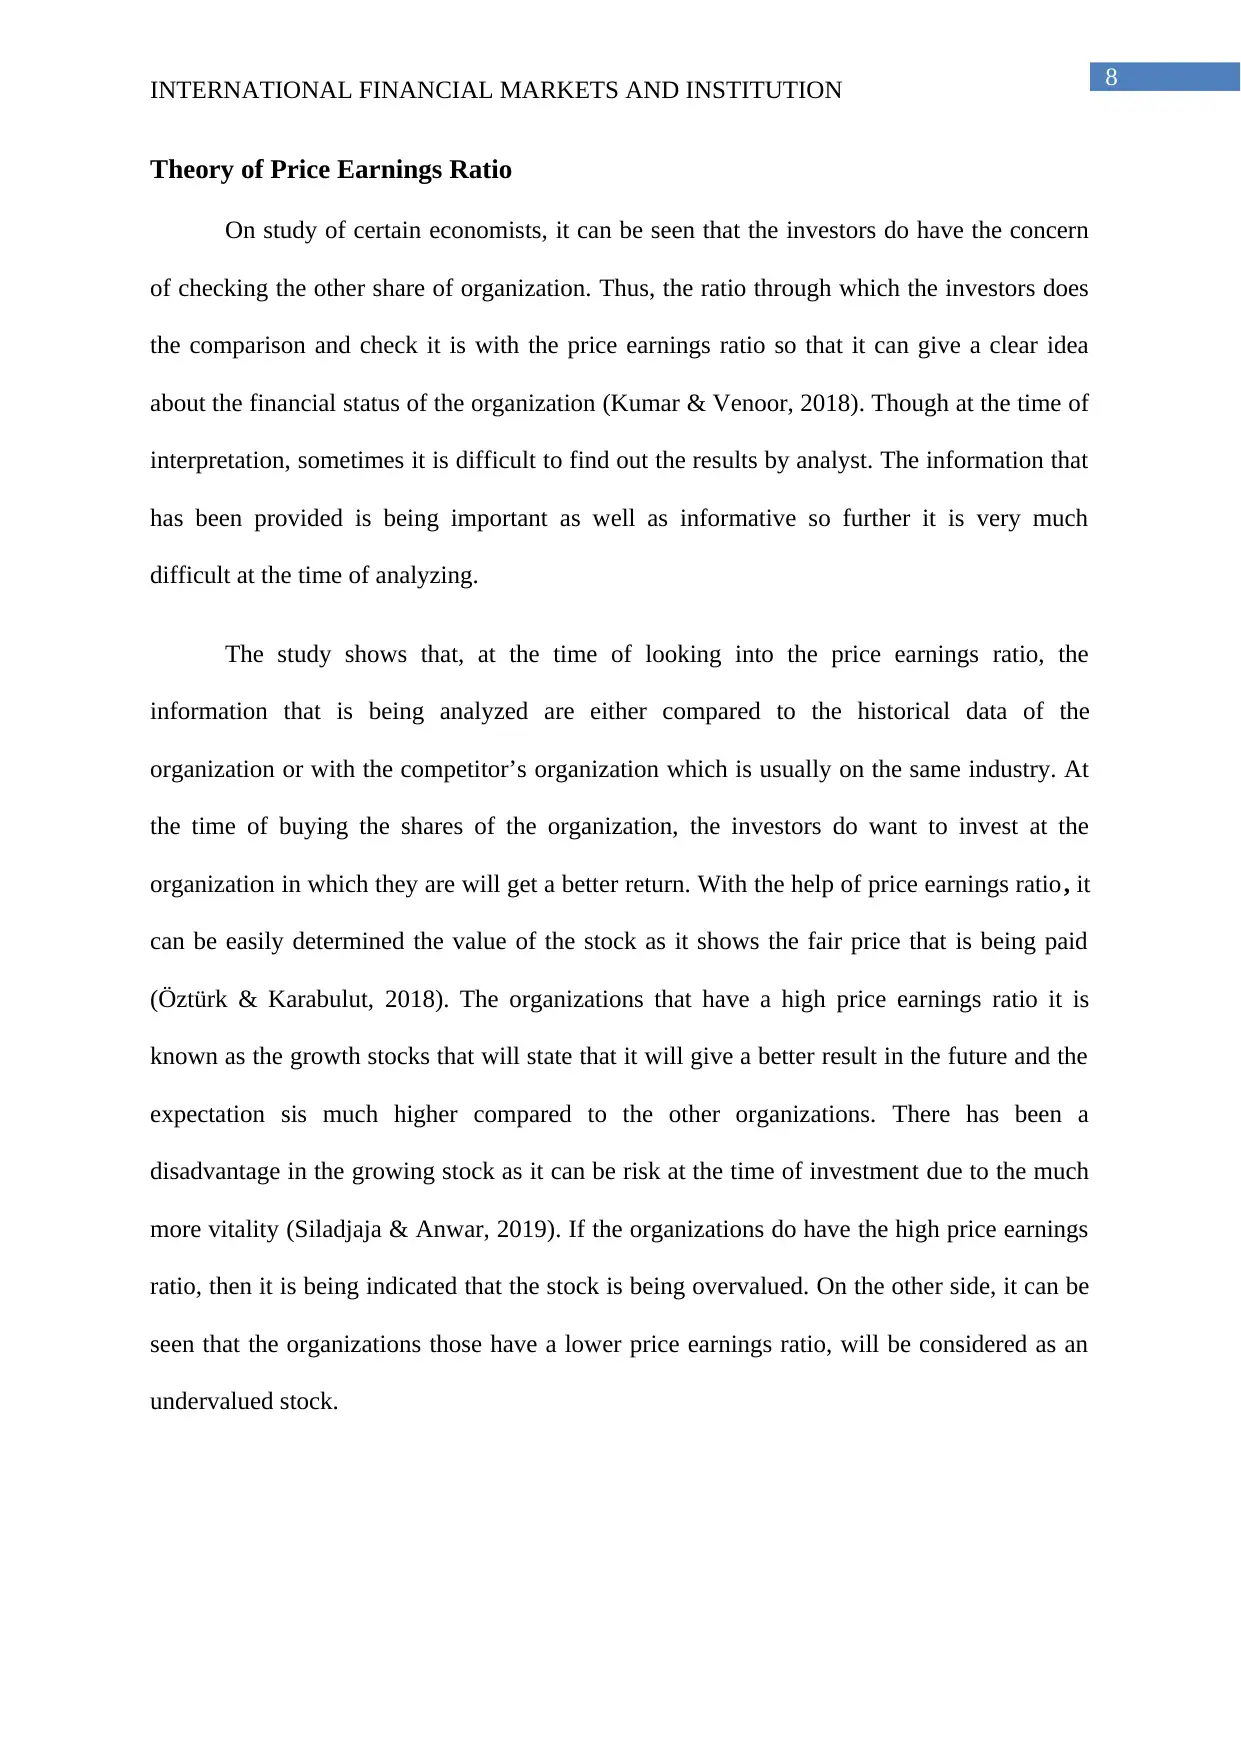
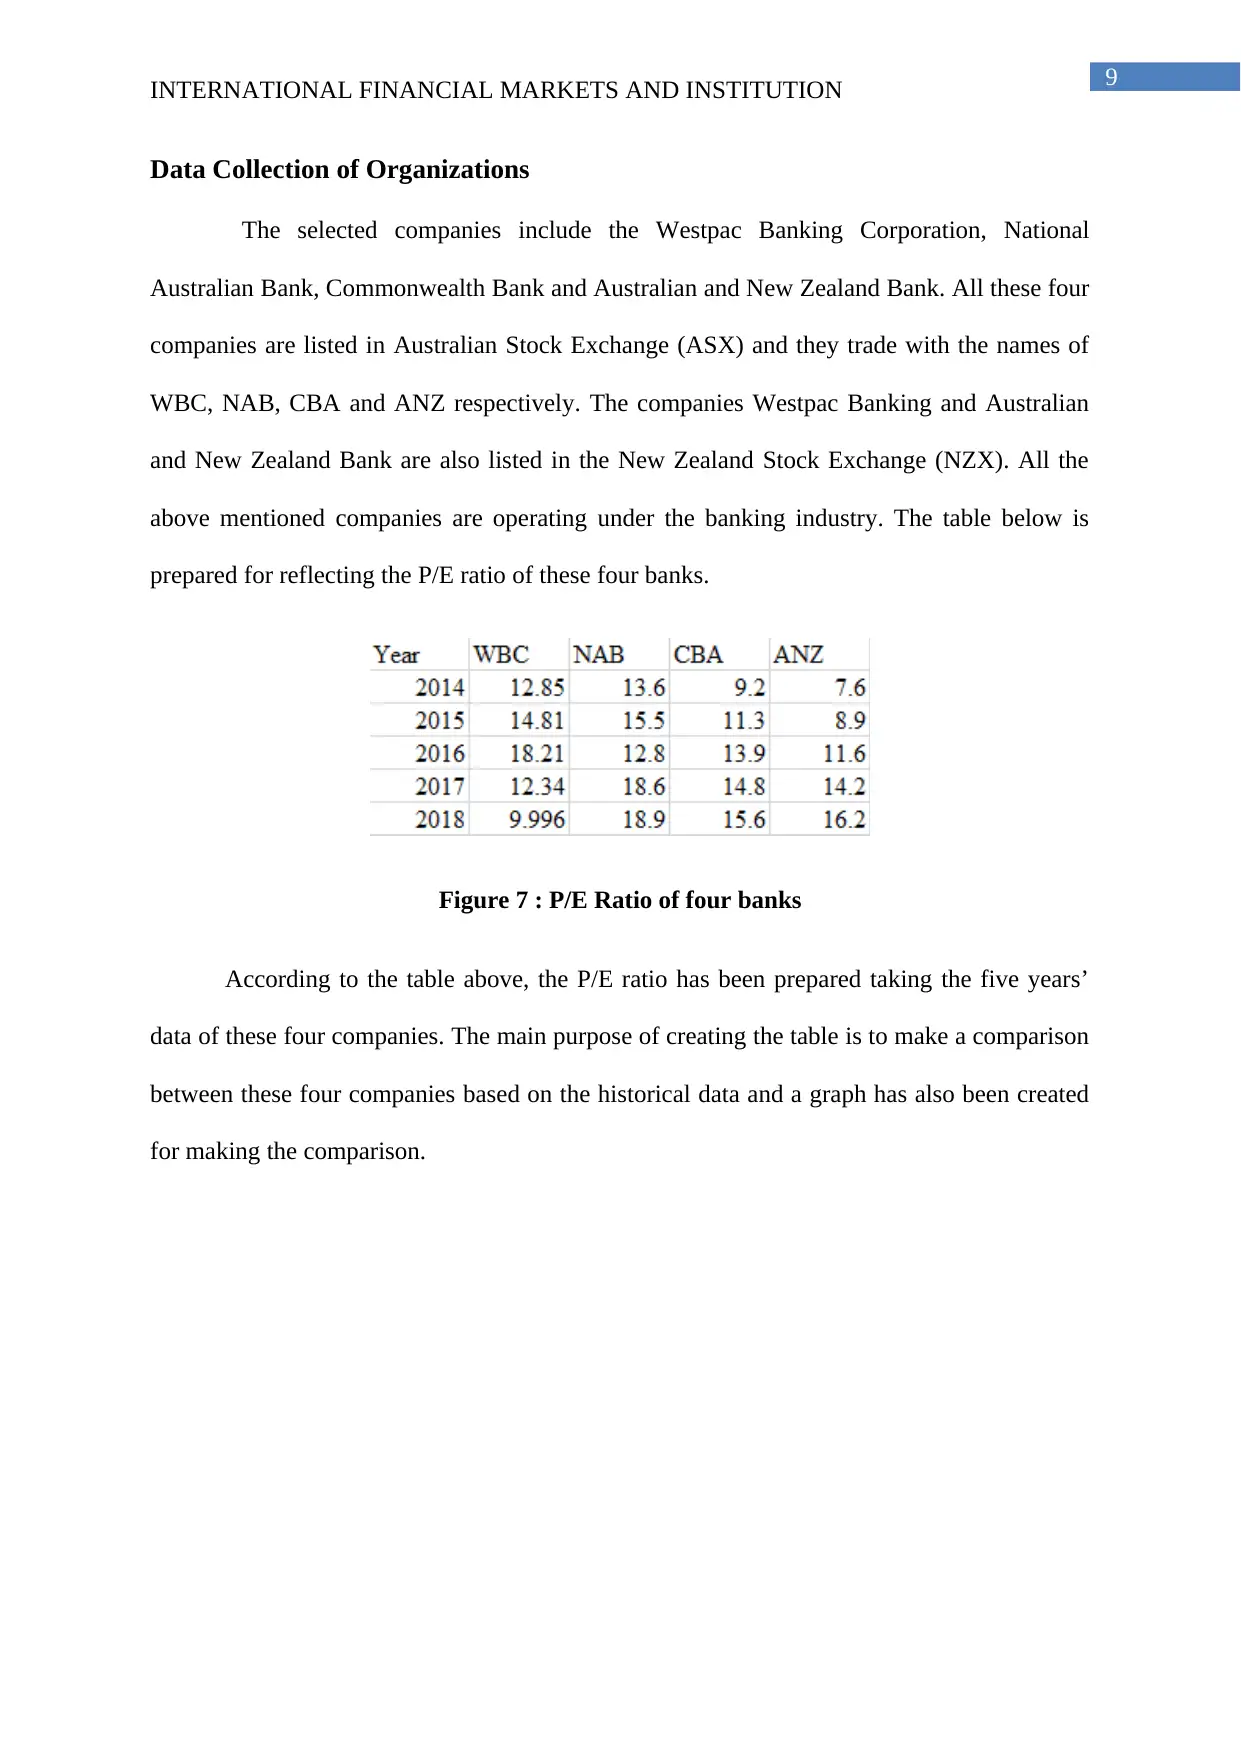
Data Collection of Organizations
The selected companies include the Westpac Banking Corporation, National
Australian Bank, Commonwealth Bank and Australian and New Zealand Bank. All these four
companies are listed in Australian Stock Exchange (ASX) and they trade with the names of
WBC, NAB, CBA and ANZ respectively. The companies Westpac Banking and Australian
and New Zealand Bank are also listed in the New Zealand Stock Exchange (NZX). All the
above mentioned companies are operating under the banking industry. The table below is
prepared for reflecting the P/E ratio of these four banks.
Figure 7 : P/E Ratio of four banks
According to the table above, the P/E ratio has been prepared taking the five years’
data of these four companies. The main purpose of creating the table is to make a comparison
between these four companies based on the historical data and a graph has also been created
for making the comparison.
INTERNATIONAL FINANCIAL MARKETS AND INSTITUTION
Data Collection of Organizations
The selected companies include the Westpac Banking Corporation, National
Australian Bank, Commonwealth Bank and Australian and New Zealand Bank. All these four
companies are listed in Australian Stock Exchange (ASX) and they trade with the names of
WBC, NAB, CBA and ANZ respectively. The companies Westpac Banking and Australian
and New Zealand Bank are also listed in the New Zealand Stock Exchange (NZX). All the
above mentioned companies are operating under the banking industry. The table below is
prepared for reflecting the P/E ratio of these four banks.
Figure 7 : P/E Ratio of four banks
According to the table above, the P/E ratio has been prepared taking the five years’
data of these four companies. The main purpose of creating the table is to make a comparison
between these four companies based on the historical data and a graph has also been created
for making the comparison.
Paraphrase This Document
Need a fresh take? Get an instant paraphrase of this document with our AI Paraphraser
10
INTERNATIONAL FINANCIAL MARKETS AND INSTITUTION
Figure 8 : Graphical representation of P/E Ratio
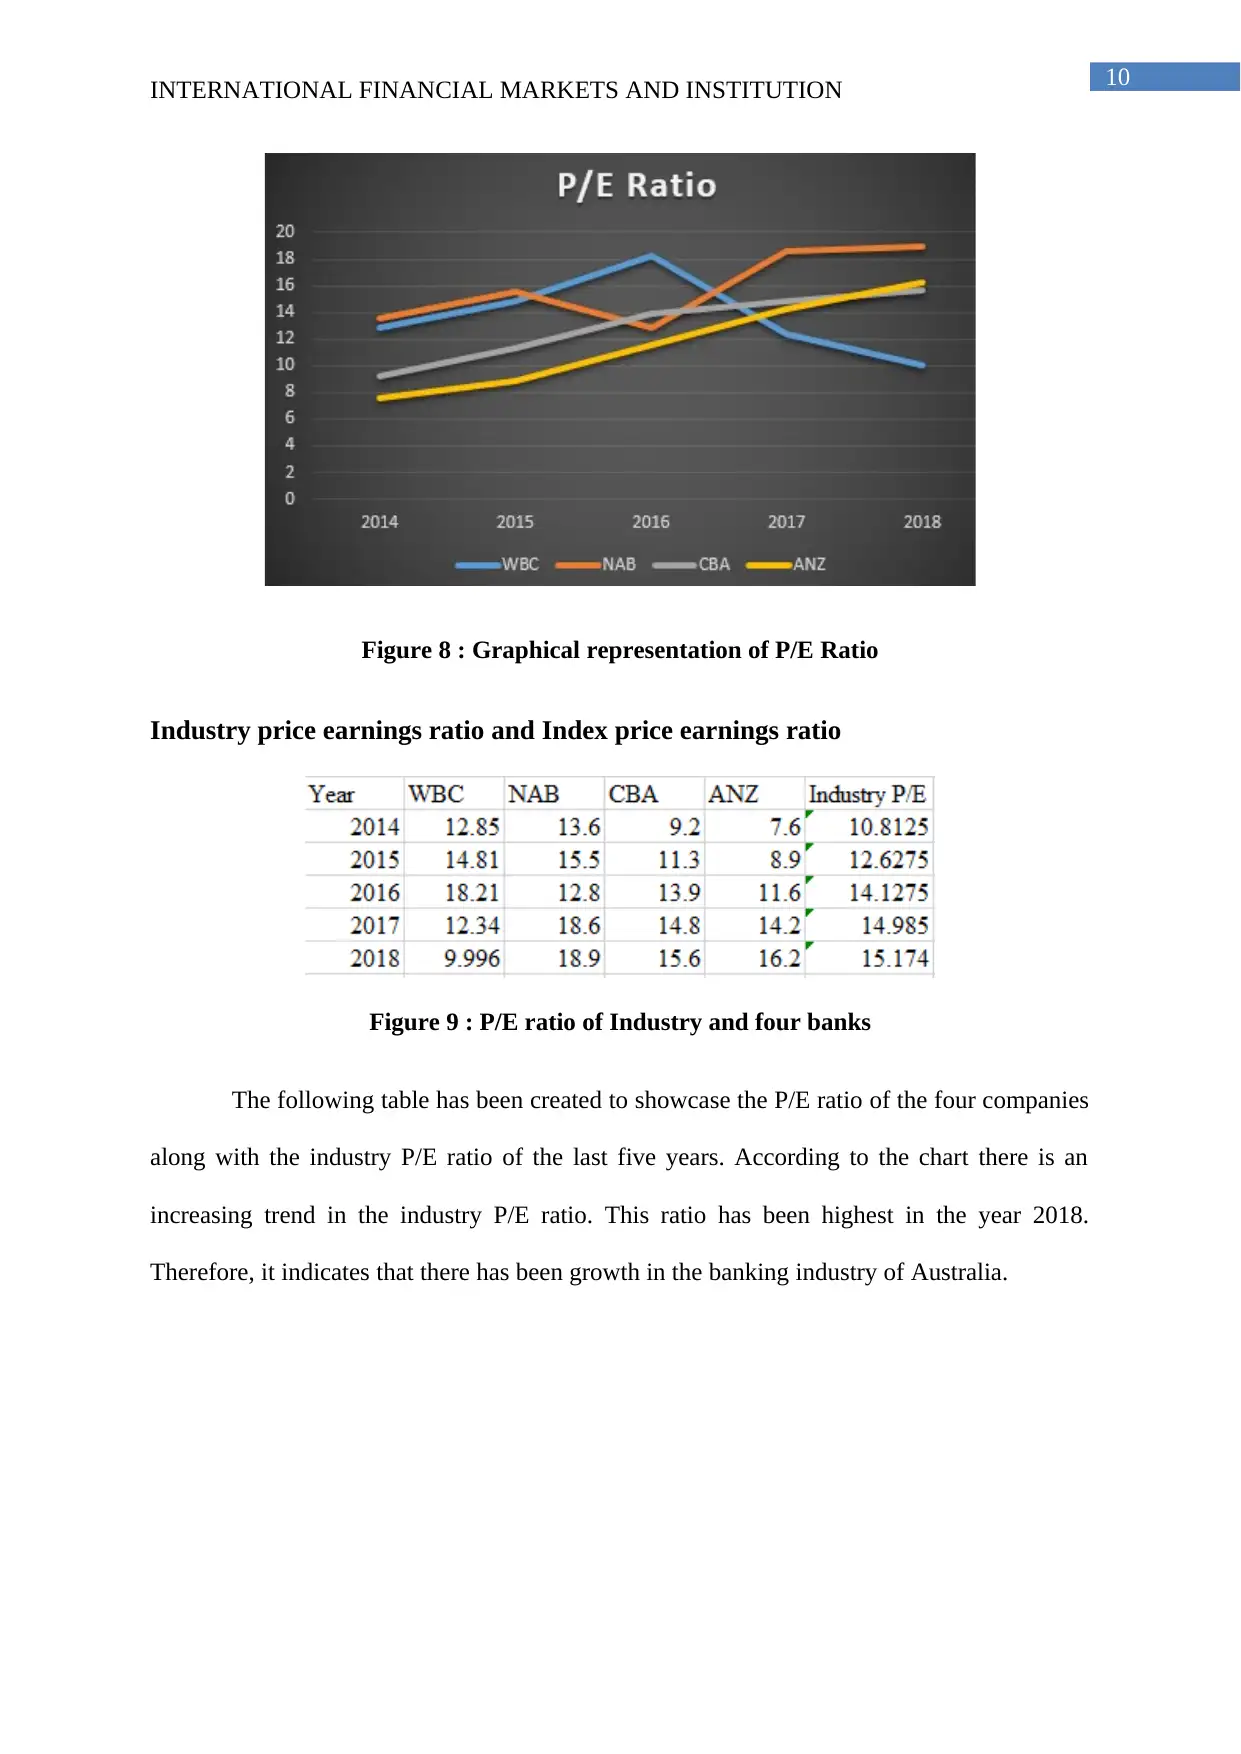
Industry price earnings ratio and Index price earnings ratio
Figure 9 : P/E ratio of Industry and four banks
The following table has been created to showcase the P/E ratio of the four companies
along with the industry P/E ratio of the last five years. According to the chart there is an
increasing trend in the industry P/E ratio. This ratio has been highest in the year 2018.
Therefore, it indicates that there has been growth in the banking industry of Australia.
INTERNATIONAL FINANCIAL MARKETS AND INSTITUTION
Figure 8 : Graphical representation of P/E Ratio
Industry price earnings ratio and Index price earnings ratio
Figure 9 : P/E ratio of Industry and four banks
The following table has been created to showcase the P/E ratio of the four companies
along with the industry P/E ratio of the last five years. According to the chart there is an
increasing trend in the industry P/E ratio. This ratio has been highest in the year 2018.
Therefore, it indicates that there has been growth in the banking industry of Australia.
11
INTERNATIONAL FINANCIAL MARKETS AND INSTITUTION
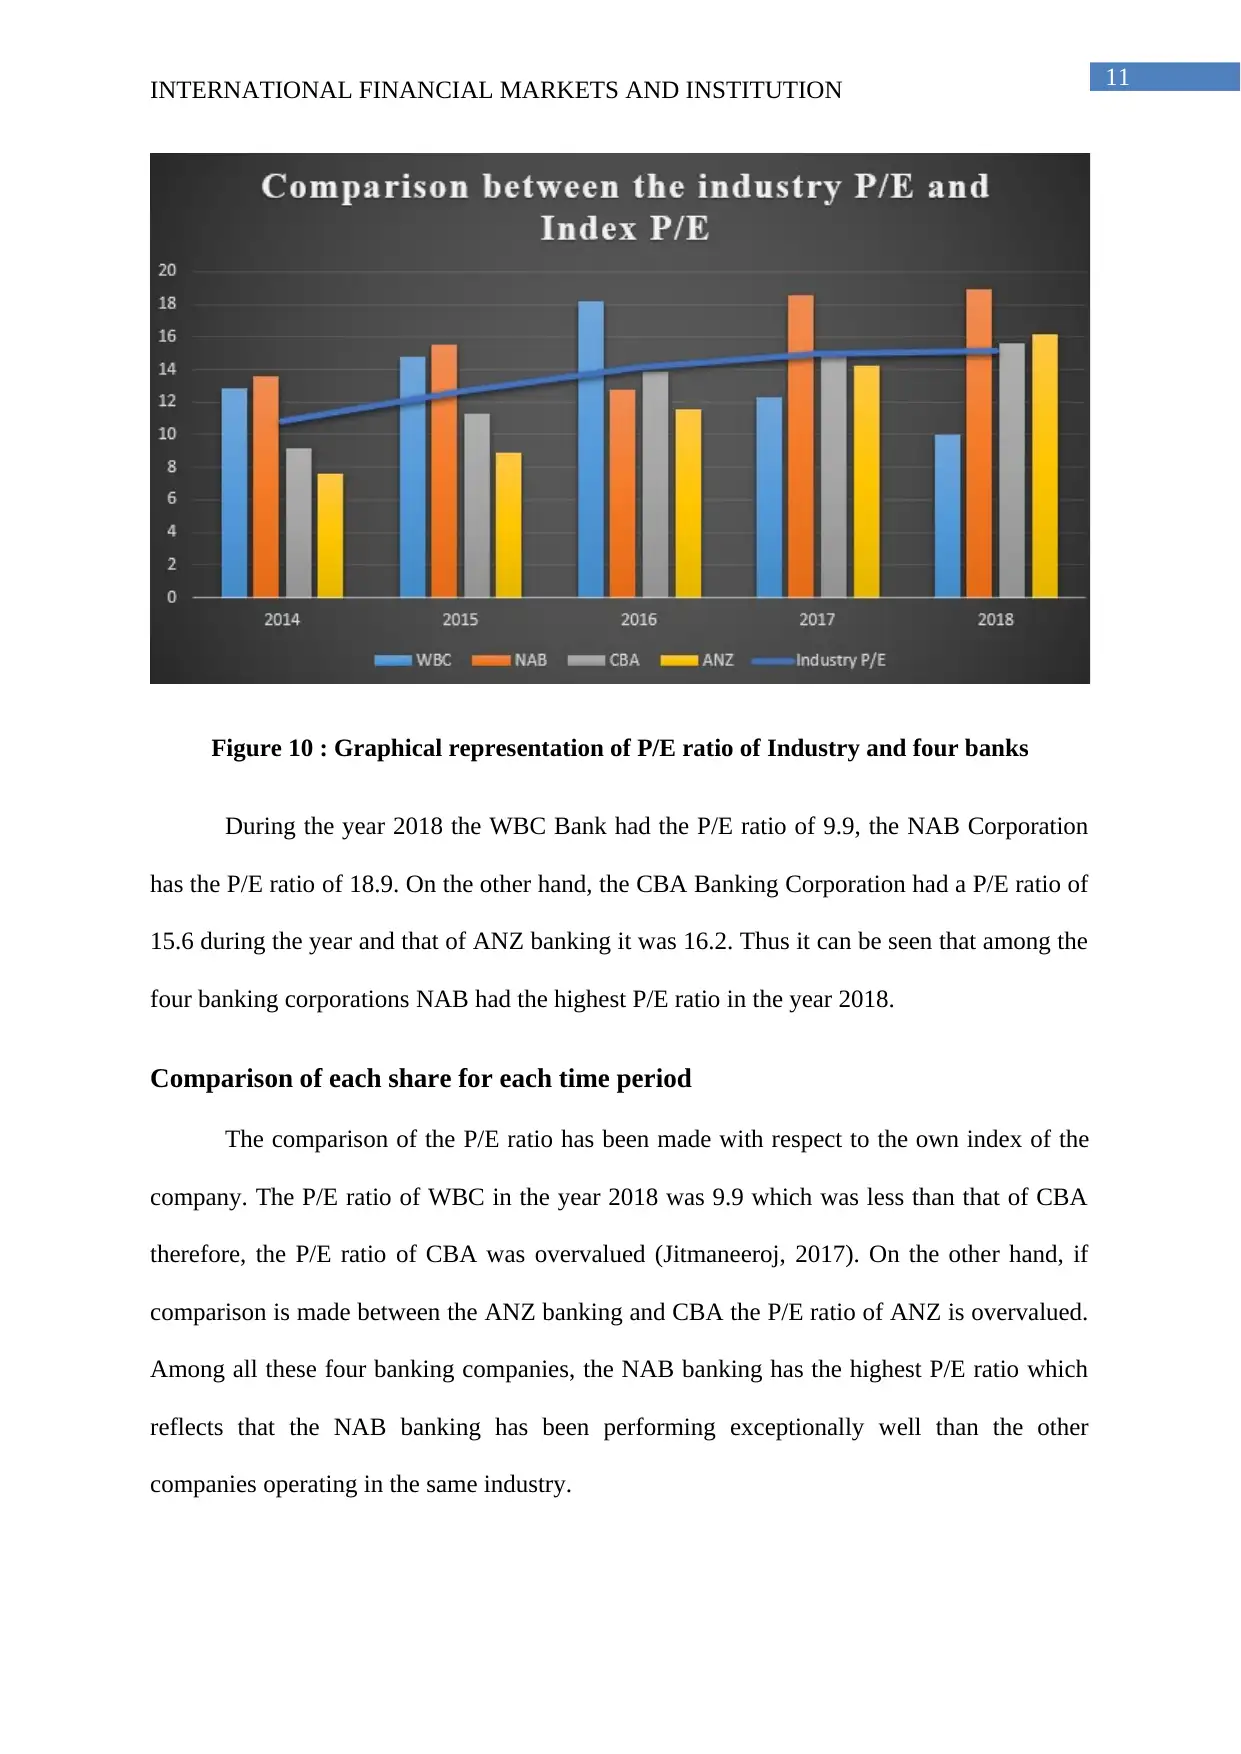
Figure 10 : Graphical representation of P/E ratio of Industry and four banks
During the year 2018 the WBC Bank had the P/E ratio of 9.9, the NAB Corporation
has the P/E ratio of 18.9. On the other hand, the CBA Banking Corporation had a P/E ratio of
15.6 during the year and that of ANZ banking it was 16.2. Thus it can be seen that among the
four banking corporations NAB had the highest P/E ratio in the year 2018.
Comparison of each share for each time period
The comparison of the P/E ratio has been made with respect to the own index of the
company. The P/E ratio of WBC in the year 2018 was 9.9 which was less than that of CBA
therefore, the P/E ratio of CBA was overvalued (Jitmaneeroj, 2017). On the other hand, if
comparison is made between the ANZ banking and CBA the P/E ratio of ANZ is overvalued.
Among all these four banking companies, the NAB banking has the highest P/E ratio which
reflects that the NAB banking has been performing exceptionally well than the other
companies operating in the same industry.
INTERNATIONAL FINANCIAL MARKETS AND INSTITUTION
Figure 10 : Graphical representation of P/E ratio of Industry and four banks
During the year 2018 the WBC Bank had the P/E ratio of 9.9, the NAB Corporation
has the P/E ratio of 18.9. On the other hand, the CBA Banking Corporation had a P/E ratio of
15.6 during the year and that of ANZ banking it was 16.2. Thus it can be seen that among the
four banking corporations NAB had the highest P/E ratio in the year 2018.
Comparison of each share for each time period
The comparison of the P/E ratio has been made with respect to the own index of the
company. The P/E ratio of WBC in the year 2018 was 9.9 which was less than that of CBA
therefore, the P/E ratio of CBA was overvalued (Jitmaneeroj, 2017). On the other hand, if
comparison is made between the ANZ banking and CBA the P/E ratio of ANZ is overvalued.
Among all these four banking companies, the NAB banking has the highest P/E ratio which
reflects that the NAB banking has been performing exceptionally well than the other
companies operating in the same industry.
⊘ This is a preview!⊘
Do you want full access?
Subscribe today to unlock all pages.
Trusted by 1+ million students worldwide
1 out of 15
Related Documents


Your All-in-One AI-Powered Toolkit for Academic Success.
+13062052269
info@desklib.com
Available 24*7 on WhatsApp / Email
![[object Object]](/_next/static/media/star-bottom.7253800d.svg)
Unlock your academic potential
Copyright © 2020–2026 A2Z Services. All Rights Reserved. Developed and managed by ZUCOL.