University Biology: Standard Curve, Electrophoresis, Dilution Homework
VerifiedAdded on 2023/01/16
|9
|1583
|88
Homework Assignment
AI Summary
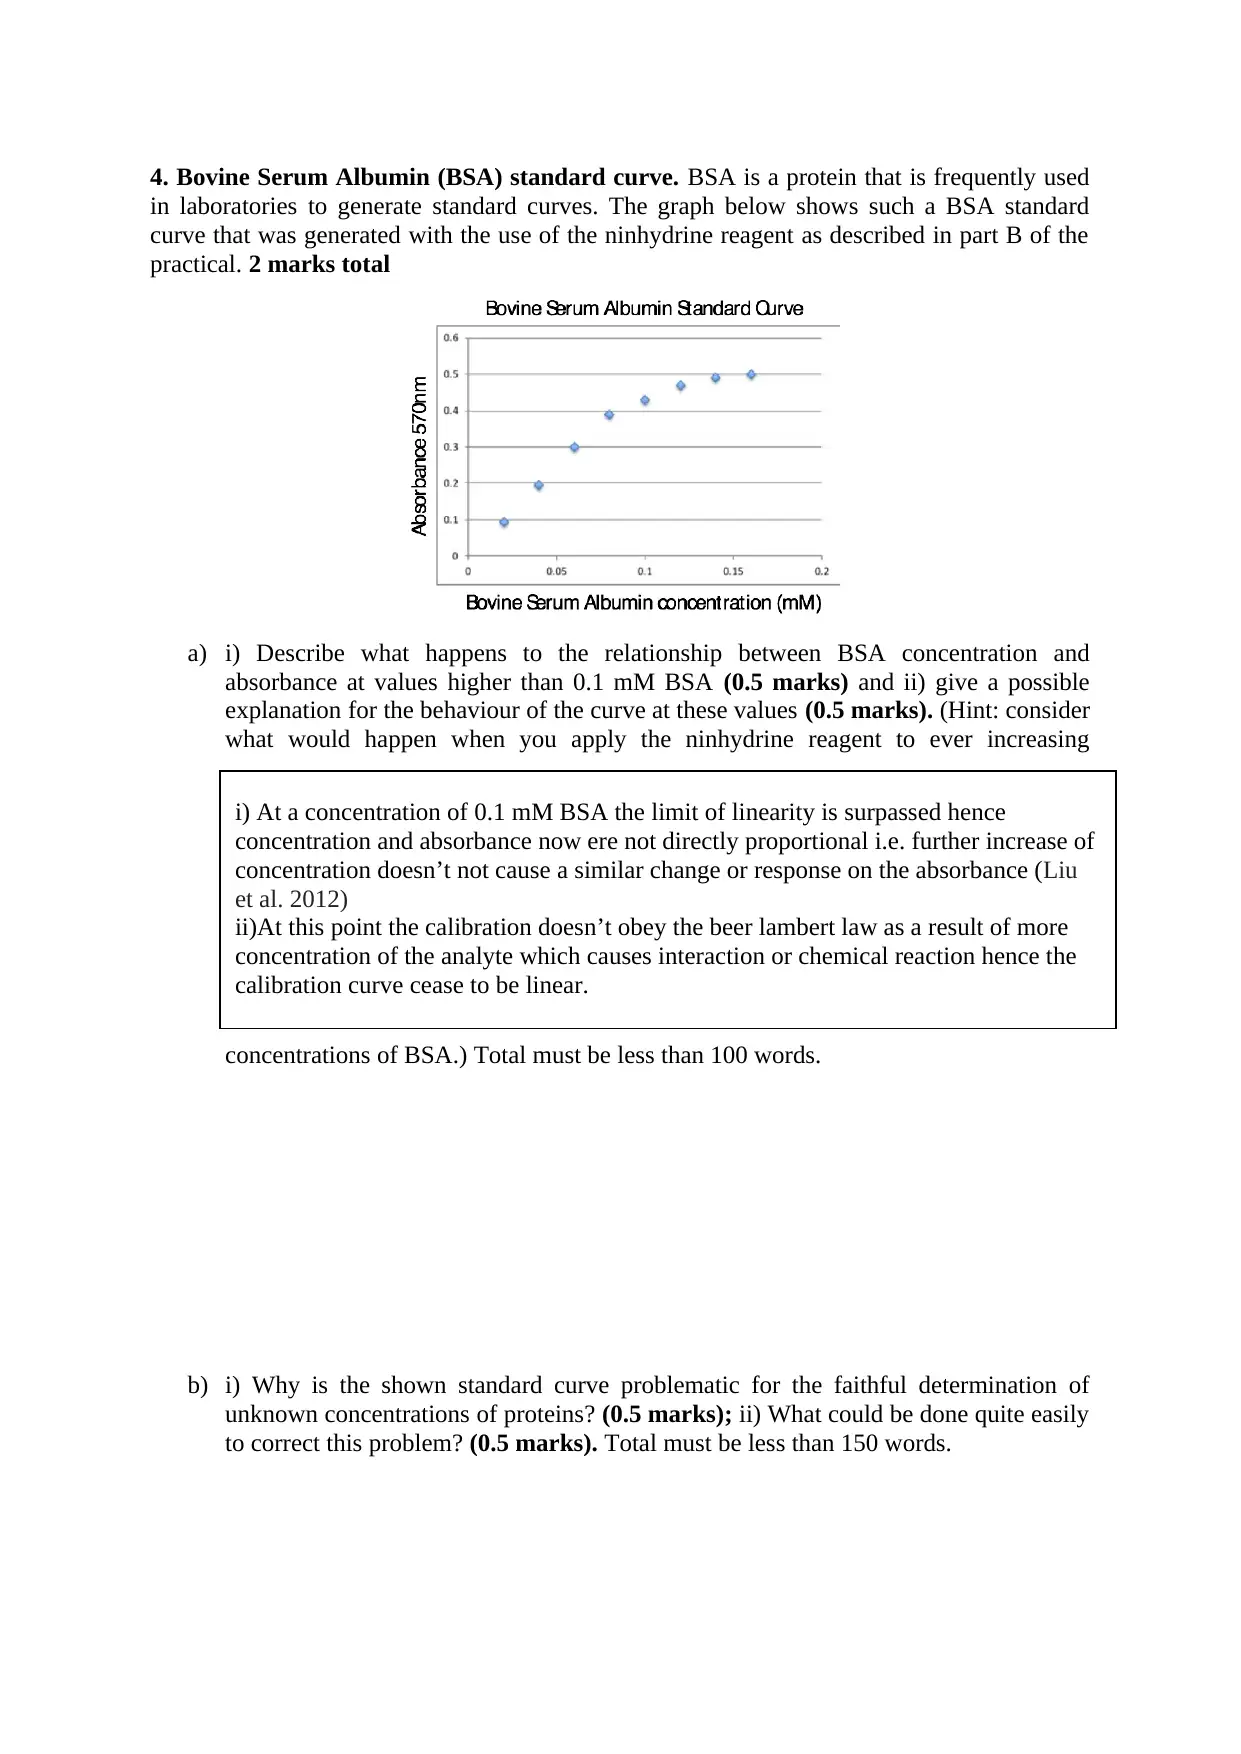
This biology homework assignment analyzes a glycine standard curve generated using Excel, including the generation of a linear regression line, equation derivation, and concentration calculations. The assignment also explores the purpose and application of standard curves in biochemistry, along with an analysis of a Bovine Serum Albumin (BSA) standard curve, addressing its limitations and potential improvements. Additionally, the assignment covers the interpretation of an amino acid electrophoresis diagram, identifying the charged ends and the charge of the amino acids. Finally, the assignment requires a dilution calculation to prepare a threonine solution, including equation components, detailed working, and a final sentence answer.

1 out of 9
Related Documents


Your All-in-One AI-Powered Toolkit for Academic Success.
+13062052269
info@desklib.com
Available 24*7 on WhatsApp / Email
![[object Object]](/_next/static/media/star-bottom.7253800d.svg)
Copyright © 2020–2026 A2Z Services. All Rights Reserved. Developed and managed by ZUCOL.