Server Availability Monitoring Tools
VerifiedAdded on 2023/01/19
|13
|2568
|82
AI Summary
This article discusses various server monitoring tools and their impact on system performance. It explores the issue of data vulnerability and provides measures to prevent it. The article also highlights the importance of failure prediction in server availability monitoring.
Contribute Materials
Your contribution can guide someone’s learning journey. Share your
documents today.

1
System Management
Name of Student
Name of Supervisor
Course Affiliated
Date
System Management
Name of Student
Name of Supervisor
Course Affiliated
Date
Secure Best Marks with AI Grader
Need help grading? Try our AI Grader for instant feedback on your assignments.
SYSTEM MANAGEMENT 2
Executive summary
Scientists have been working so hard to manage data stored in the servers. To cope up with data
increase, more monitoring tools are built to monitor the server monitor tool available. The bandwidth,
CPU, and memory need protection from any default. Security issues have caused challenges that need
attention from all sectors. The window management protocol is used to monitor system and servers
communication. Data communication need regulations; the system should identify who sent the data
and what is data intended to do. Various server monitoring tools vary in terms of performance, disk
usage, CPU, process, bandwidth used, and the overall availability of the instrument. This paper clearly
illustrates each device, evaluate the server architecture and highlight the issue of data vulnerability.
SYSTEM MANAGEMENT 3
Table of Contents
Abstract 2
Introduction 4
Server Monitoring tools 5
Server availability monitoring architecture ……………………………………………………………………………………………..8
Data Vulnerability in monitoring architecture………………………………………………………………………………………..10
Impact of failure in prediction on server availability monitoring …………………………………………………………..11
Summary ………………………………………………………………………………………………………………………………………………12
References ……………………………………………………………………………………………………………………………………………13

SYSTEM MANAGEMENT 4
Introduction
Data management has become a challenge for most Companies. The use of server monitoring
tools helps in increasing network availability and reducing downtime. These tools take part in
monitoring; assessing and troubleshooting the network to ensure the system operate efficiently. Also,
the platforms use Simple Network Management Protocol (SNMP) to collect and monitor the servers. The
tool's performance varies from one device to another. Identifying the type of network one uses is
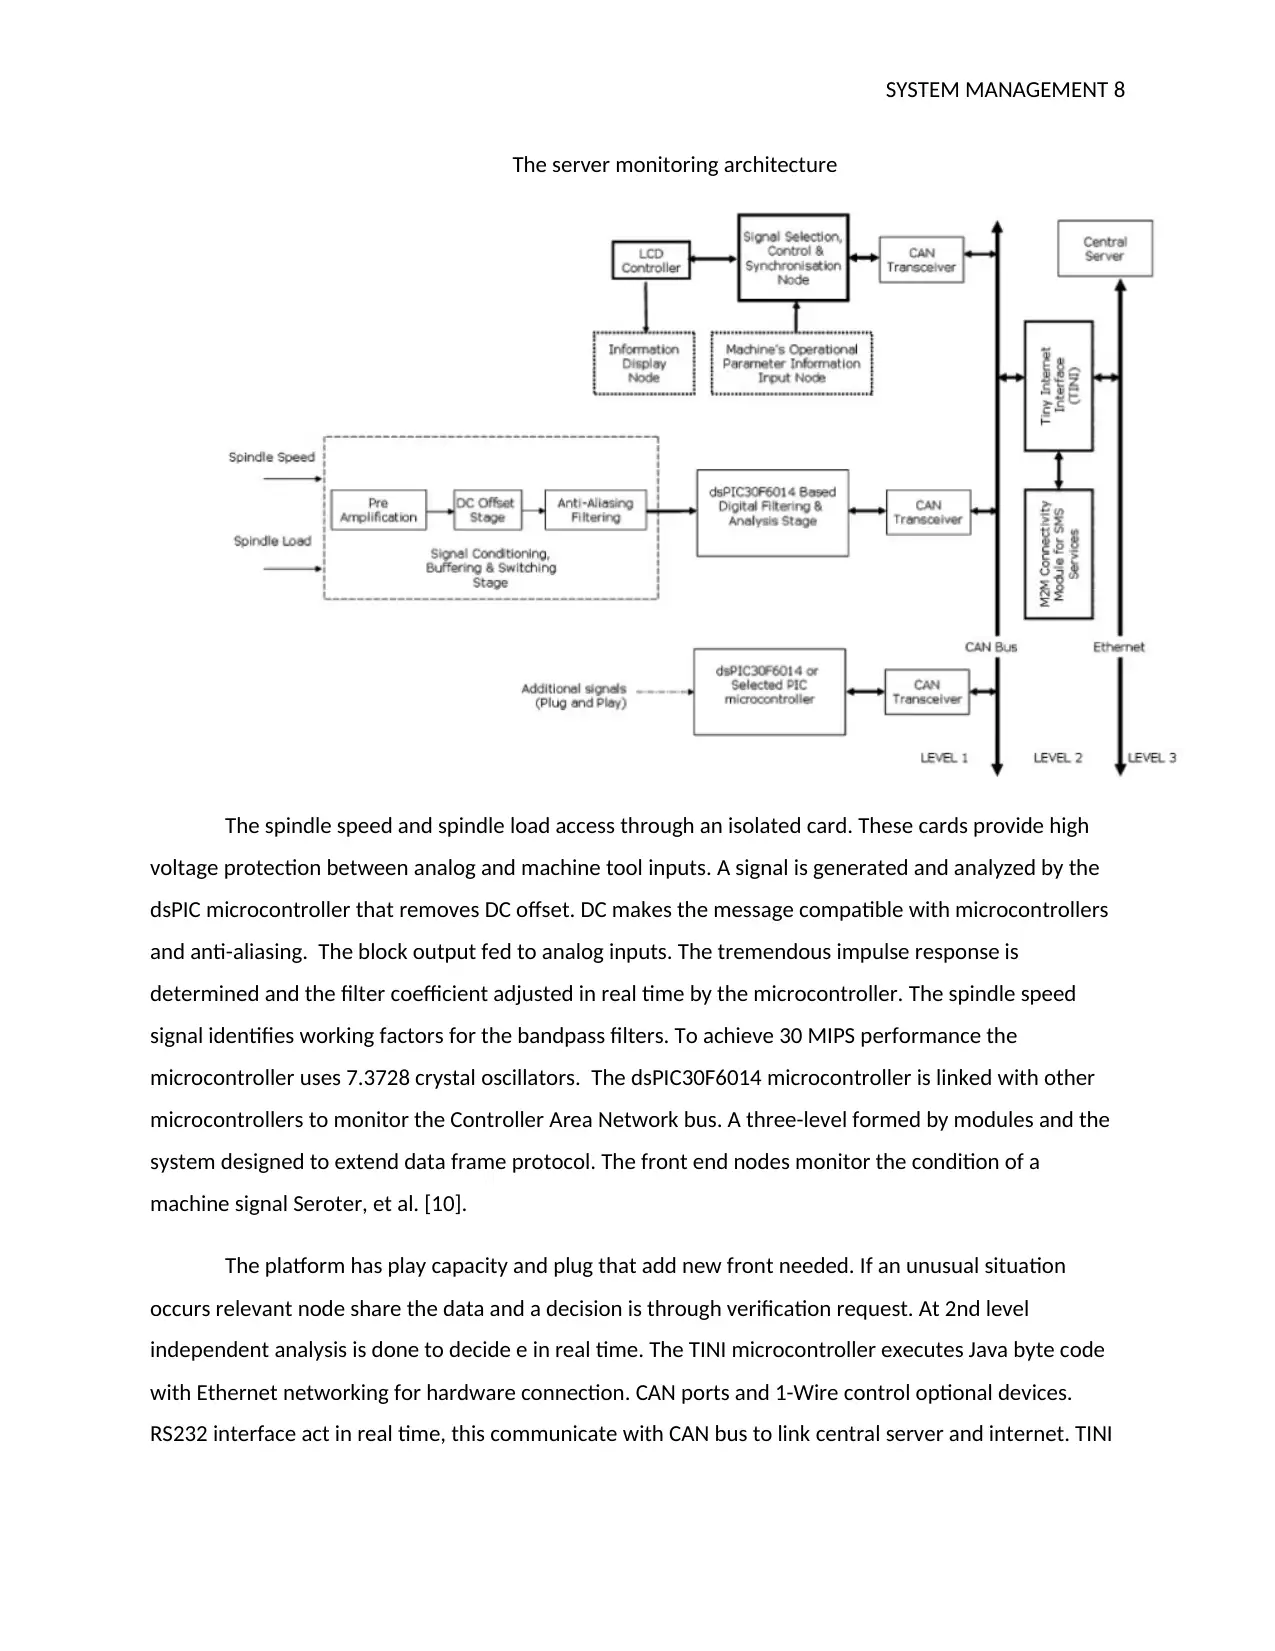
essential in selecting server tools to adopt [1]. Figure one identifies varies components of monitoring
tool architecture.
Secure Best Marks with AI Grader
Need help grading? Try our AI Grader for instant feedback on your assignments.
SYSTEM MANAGEMENT 5
Server availability monitoring tools
The Nagios core is one open sources server designed to run on the Linux operating system and
monitor devices running on Windows, Linux, and UNIX. It acts as an alert engine of original application
[2]. Nagios core monitor disk usage by using NRPE on a remote machine. To access remote host
command installing the nrpe plugin is required on the remote. To evaluate the CPU monitoring the
Nagios core configure the NRPE file to check any default, after executing a command prompt execution
is obtain that explain the status of the CPU.
Nagios can monitor Microsoft Windows processes and provide feedback when a process
executes. It thus increases services application and detects process fault. Nations provide a
comprehensive bandwidth monitoring through SNMP V1 or 2c to deliver the bandwidth utilization. It
allows running of the router and switches monitoring wizard. Also, it can track per-port bandwidth
errors and usage. Nations act as event scheduler in measuring resources; monitor the system
infrastructure to ensure the application is functioning. Finally, Nagios Core is an open source monitoring
tool that allows one to build Nagios projects [1], [3].
Ganglia is a distributed tool that works on high-performance systems like Grids and clusters.
Ganglia cluster nodes have the same full disk usage percentage. It does not discern the remote file
system in the right manner. The function machine/Linux determines the partitioning. To access CPU
monitoring, the Ganglia has in-built composite graphs that reflect the number of loads, number of CPUs
and number of processes currently running. The CPU reports generated indicate CPU users are
functioning at that moment. Ganglia is a distributed system that allows the collection of information on
their appliance [3]. Multicast allows monitoring of devices on the network; unicast helps in improving
system performance. In Ganglia bandwidth are measured between gmetads in the wide area network.
The architecture helps in regulating the bandwidth usage between two locations.
Ganglia can measure Host resources such as Cluster and Grid computing. Though resources are
highly volatile, the Ganglia system is developed to monitor the grid of computers and has low overhead.
The Ganglia package is freely available designed for a scalable purpose. The gmond is developed for
clients, gmetad for Ganglia collector and Ganglia web frontend needed on web front-end.
Collectd is a Unix daemon responsible for collecting, transferring and storing the performance
information for networks and computers [4]. Data usage control plugins shared in the form of objects. It
offers the possibility of storing data in RRD or CSV files. The plugins also show the task occupied in the
SYSTEM MANAGEMENT 6
CPU. The CPU should not be 100% utilized as this indicates the system is not dominant. The Collectd
suggests the number of processes and groups them by stage. It also shows detailed statistics of a
selected method. The Collectd exec plugin is for collecting and monitoring the bandwidth usage. The
collectd is written C to improve performance and portability; it runs on an embedded WLAN router with
no impact on the CPU. Collectd package is available for CentOS, Ubuntu and it integrated with Nagios.
Several studies [2, 5] have elaborated that Spiceworks tool helps in discovering, management
and monitoring hardware and software assets in the networks. The Netwrix helps Spiceworks to monitor
deep disk space on servers automatically. The free space keeps breast for servers getting close to low
disk space condition to prevent unexpected failures and downtime. Spiceworks Network monitors the
CPU utilization for both the Windows and Linux servers. It follows the process through keeping tabs on
IP-enable cameras, websites, and VoIP which optimize its monitoring tools. Spiceworks allows network
bandwidth management through a data usage device. Resource measuring depends on the environment
since the plugin is resource intensive that increases network performance. It offers IT management tools
like inventory.
A cactus is a graphical network tool designed to gather network information and give a graph
basing on the data. It uses RRD tool to store data used to create charts, Cacti for the Linux shows disk
space currently in use. Cacti measure the CPU load and drive capacity to obtain maximum output. It
monitors network traffic, CPU usage, memory, temperature and speed up processes. The Cactus tool
allows the addition of routers that control bandwidth. Resource monitoring achieved through the
periodic measuring of resources utilization level for the network devices. Cacti are one of open-source
network with the greatest of graphing capabilities [9].
Zabbix monitoring tool is software that monitors network utilization, disk consumption, and CPU
load. The vfs.dev.read and vfs.dev.write are standard parameters that measure the disk space usage.
Zabbix utilizes the CPU with an average of 5 minutes by creating an appropriate trigger [6]. The Zabbix
server discovers and monitors the windows process, and integrated with Commotion routers, but it does
not measure the bandwidth directly. Zabbix tool performs monitoring availability on network devices in
the resource measuring process. Also, it’s a free network monitoring tool.
Icinga monitors the performance and availability of a system. It focuses on reflecting community
needs and integrates patches [7]. It checks for disk usage, and the process then gives notification on the
status. It tests CPU load through SNMP plugin. Icinga2 monitor hosts and services availability it does not
SYSTEM MANAGEMENT 7
monitor throughput, but it collects perfdata and sends data to graphite. Icinga measure performance by
configuring with the end users to measure the resource used. Icinga is an open-source application that
provides an integration script for Windows.
OpenNMS platform has used the organization to find network solution. It’s extensible and
flexible. It is configured to send an email response in cases where disk usage is high or server thrash. It
has inbuilt SNMP agent that monitors CPU utilization on Window systems. OpenNMS can process
125,000 Syslog per minute continuously. Resource allocation is flexible with high-capacity integrated
alert support. Also, OpenNMS is free source software with no license required [8].
WhatsUp Gold provides performance and application status. SQL server store and configure
stored data. It displays the percentage of CPU used in real time. WhatsUp Gold can perform an
automatic assessment. It provides bandwidth utilization with an insight of bandwidth usage [1]. It
measures networkability, and it monitors the infrastructure performance.
Paraphrase This Document
Need a fresh take? Get an instant paraphrase of this document with our AI Paraphraser
SYSTEM MANAGEMENT 8
The server monitoring architecture
The spindle speed and spindle load access through an isolated card. These cards provide high
voltage protection between analog and machine tool inputs. A signal is generated and analyzed by the
dsPIC microcontroller that removes DC offset. DC makes the message compatible with microcontrollers
and anti-aliasing. The block output fed to analog inputs. The tremendous impulse response is
determined and the filter coefficient adjusted in real time by the microcontroller. The spindle speed
signal identifies working factors for the bandpass filters. To achieve 30 MIPS performance the
microcontroller uses 7.3728 crystal oscillators. The dsPIC30F6014 microcontroller is linked with other
microcontrollers to monitor the Controller Area Network bus. A three-level formed by modules and the
system designed to extend data frame protocol. The front end nodes monitor the condition of a
machine signal Seroter, et al. [10].
The platform has play capacity and plug that add new front needed. If an unusual situation
occurs relevant node share the data and a decision is through verification request. At 2nd level
independent analysis is done to decide e in real time. The TINI microcontroller executes Java byte code
with Ethernet networking for hardware connection. CAN ports and 1-Wire control optional devices.
RS232 interface act in real time, this communicate with CAN bus to link central server and internet. TINI

SYSTEM MANAGEMENT 9
is connected with Machine to Machine connection module to respond in real time to provide a timely
message. The server undertakes management function and house signal processing and analysis.
is connected with Machine to Machine connection module to respond in real time to provide a timely
message. The server undertakes management function and house signal processing and analysis.

SYSTEM MANAGEMENT 10
Vulnerability in server availability monitoring tool
Helmke, et al. [11] explained that data vulnerability in the server affects system performance.
One measure is installing the Firewalls in the server which controls services accessing the network by
restricting and blocking access. Installing public key infrastructure designed to validate certificate
identification and encryption of communication.
Using VPNs and making the network private prevent unauthorized people from accessing the
system. VPNs secure network connections between networks by converting the web as a local private
network. Adopting Service Auditing discover the services on service infrastructure.it also indicate the
ports used in communication that helps in configuring the firewalls this prevent server data
vulnerability.
Isolating the executing environment prevent data vulnerability. It includes separating discrete
application components from the entire system. Auditing the files uploaded in the order is essential, and
intrusion detective systems help in identifying the authorized system. All this measure if implemented
well prevents data vulnerability.
Secure Best Marks with AI Grader
Need help grading? Try our AI Grader for instant feedback on your assignments.

SYSTEM MANAGEMENT 11
Impact of failure prediction on server availability monitoring
Prediction failure on server availability affects system performance. The system might run low
on disk space as data volume expands. Disk space affects the server’s stability thus affecting memory
management. Also, the failure affects the Databases and Application responses. The SQL server might
not respond adequately to logins thus hindering the security of the system.
Another impact is unexpected spikes in the network traffic. Virus scanner and backup tools
might cause significant spikes in the network. Unnecessary installation of security measure may hinder
the smooth running of the system hence affecting its performance. The server monitoring tools aim to
enhance the efficiency of the system not to make it slow [12].
The system runs high CPU affecting the storage capacity. The CPU must not occupy an
unnecessary process that affects the performance of the system. A poorly written application may also
change the server CPU configuration. As a result, the server may break down.

SYSTEM MANAGEMENT 12
Summary
The server availability monitoring metric manages the servers to achieve the best output of the
system. The platform aims at maximum utilization of CPU, Memory and frees the disk space to ensure
the system performs efficiently. The primary function of the monitoring tool is to check the overloading
processes, networking defaults, and memory allocation. The choosing of a monitoring tool should base
on the efficiency and the capacity of the device. Most tools can be downloaded freely and installed
quickly.
SYSTEM MANAGEMENT 13
Reference
[1]J. Hernantes, G. Gallardo and N. Serrano, "IT Infrastructure-Monitoring Tools", IEEE Software, vol. 32,
no. 4, pp. 88-93, 2015. Available: 10.1109/ms.2015.96.
[2]”HCV core antigen assay reliable, cost-effective monitoring tool", PharmacoEconomics & Outcomes
News, vol. 730, no. 1, pp. 19-19, 2015. Available: 10.1007/s40274-015-2212-9.
[3] A. Mistry, Expert AWS Development. Birmingham: Packt Publishing, 2018.
[4]"Related sites – collectd – The system statistics collection daemon", Collectd.org, 2019. [Online].
Available: https://www.collectd.org/related.shtml. [Accessed: 17- Apr- 2019].
[5]"Software, Forums & Tools for IT Pros | Spiceworks", Spiceworks, 2019. [Online]. Available:
https://www.spiceworks.com/. [Accessed: 17- Apr- 2019].
[6]R. Olups, Zabbix Network Monitoring. Birmingham: Packt Publishing, Limited, 2016.
[7]V. Mehta, Icinga Network Monitoring. Packt Publishing, 2013.
[8]M. Alibi and B. Roy, Mastering CentOS 7 Linux Server. Birmingham: Packt Publishing, Limited, 2016.
[9]A. Kamada and M. Amishima, "QuantiFERON-TB® Gold Plus as a potential tuberculosis treatment
monitoring tool", European Respiratory Journal, vol. 49, no. 3, p. 1601976, 2017. Available:
10.1183/13993003.01976-2016.
[10]R. Seroter, E. Fairweather and R. Ramani, Applied Architecture Patterns on the Microsoft Platform.
Birmingham: Packt Pub., 2010.
[11]M. Helmke, A. Hudson and P. Hudson, Ubuntu unleashed. .
[12]"Monitoring server based server selection strategy in content delivery networks", INTERNATIONAL
JOURNAL OF LATEST TRENDS IN ENGINEERING AND TECHNOLOGY, vol. 7, no. 3, 2016. Available:
10.21172/1.73.523.
1 out of 13
Related Documents
Your All-in-One AI-Powered Toolkit for Academic Success.
+13062052269
info@desklib.com
Available 24*7 on WhatsApp / Email
![[object Object]](/_next/static/media/star-bottom.7253800d.svg)
Unlock your academic potential
© 2024 | Zucol Services PVT LTD | All rights reserved.


