Massey University 161.120 Ass2 2019: Confidence Interval Report
VerifiedAdded on 2022/10/17
|7
|804
|92
Homework Assignment
AI Summary
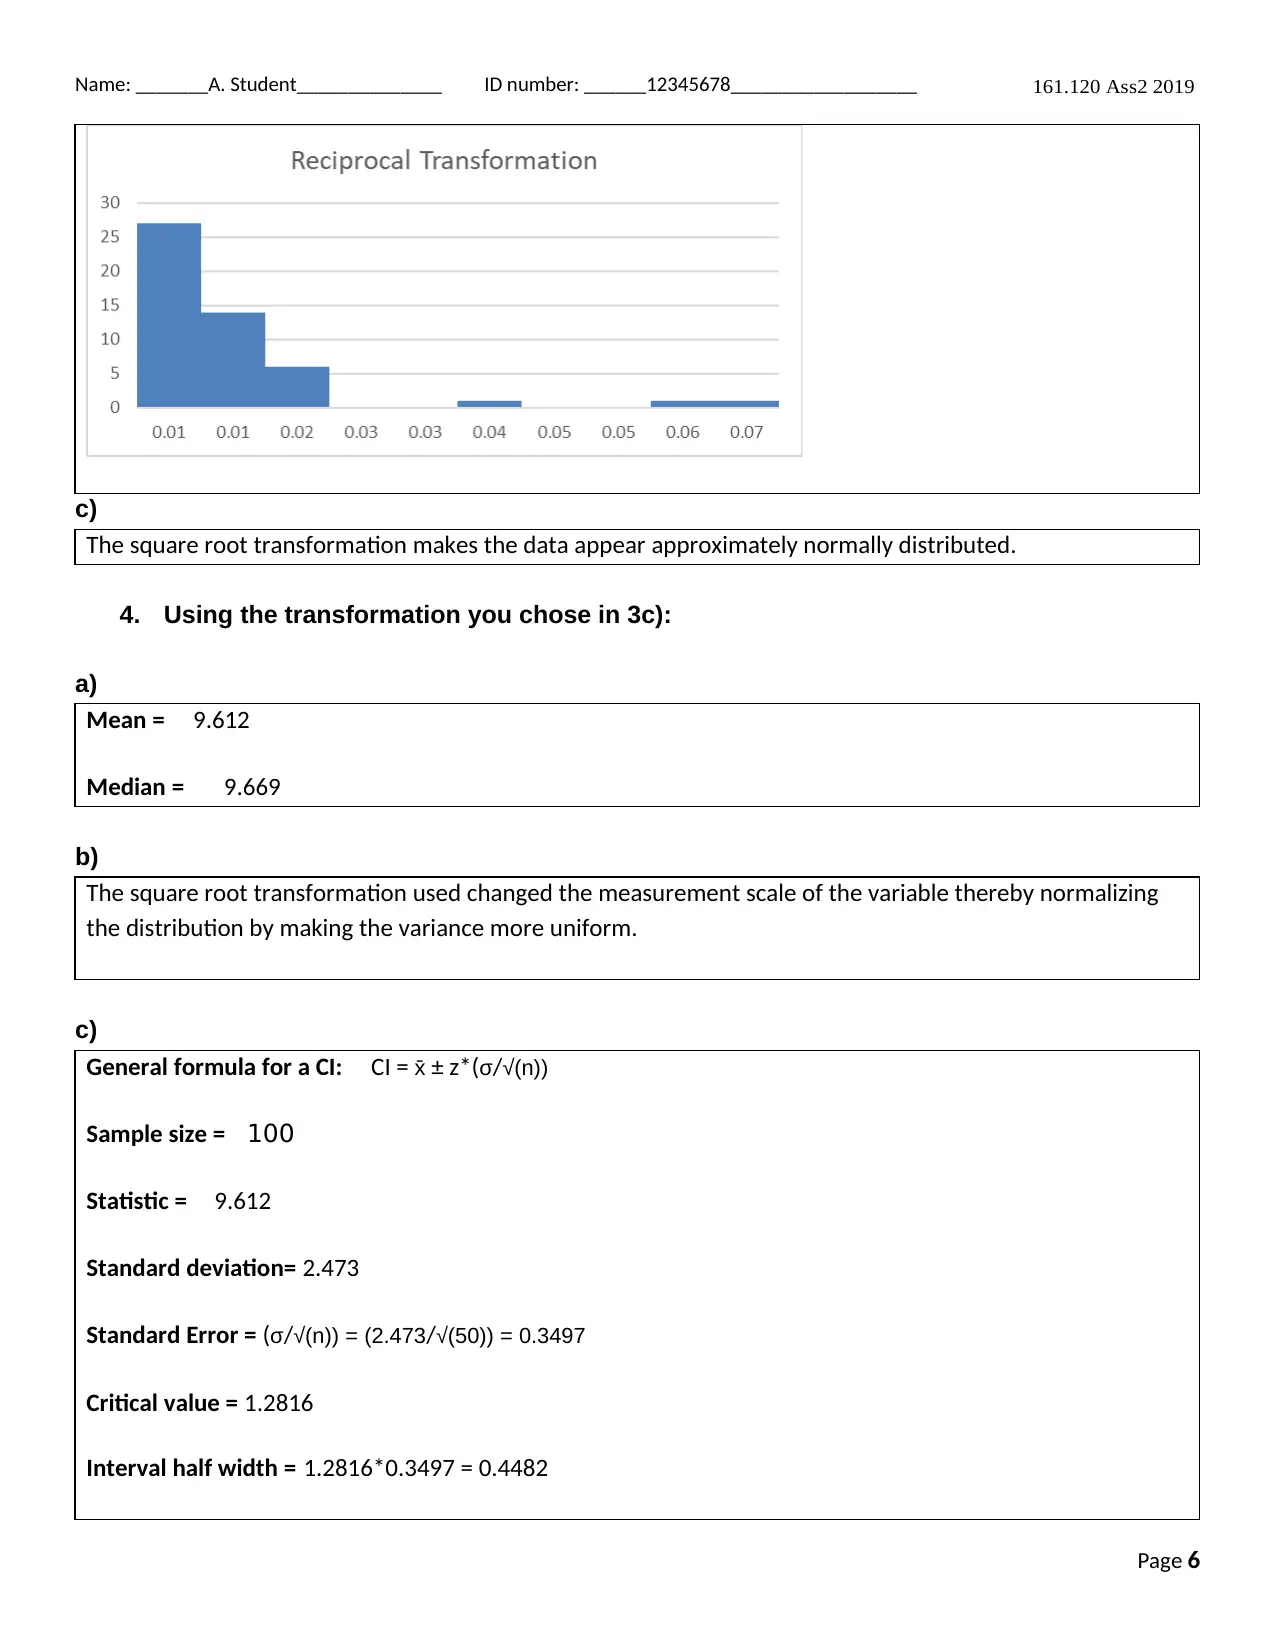
This assignment solution addresses statistical concepts including confidence intervals for proportions and means, and hypothesis testing. The assignment involves analyzing data from a sample of kuku (New Zealand green-lipped mussels) to determine the proportion of female kuku and to construct and interpret confidence intervals. Exploratory data analysis is performed, including assessing the distribution of data and applying transformations to address skewness. The solution demonstrates the calculation of standard errors, critical values, and interval half-widths to construct confidence intervals and make inferences about the population parameters. Furthermore, the assignment includes hypothesis testing to determine if the proportion of male kuku is less than a specified threshold, with conclusions drawn based on p-values and the rejection or acceptance of the null hypothesis. The document also includes interpretations of the confidence intervals within the context of the mussel farm population.

1 out of 7
Related Documents


Your All-in-One AI-Powered Toolkit for Academic Success.
+13062052269
info@desklib.com
Available 24*7 on WhatsApp / Email
![[object Object]](/_next/static/media/star-bottom.7253800d.svg)
Copyright © 2020–2026 A2Z Services. All Rights Reserved. Developed and managed by ZUCOL.