Volkswagen: Corporate Performance and Financial Analysis
VerifiedAdded on 2023/02/01
|16
|3365
|66
AI Summary
This report provides an in-depth analysis of Volkswagen's corporate performance and financial analysis. It includes a macroeconomic analysis, profitability ratios, liquidity ratios, and solvency ratios. The report also discusses the risks and opportunities in the global industry.
Contribute Materials
Your contribution can guide someone’s learning journey. Share your
documents today.

FINANCE
2019
2019
Secure Best Marks with AI Grader
Need help grading? Try our AI Grader for instant feedback on your assignments.
Volkswagen
Executive Summary
Volkswagen is engaged in the development of vehicles and components for the brands. It
even produces vehicles, as well as passenger cars and light commercial vehicles. The current
report sheds light on the corporate performance of the company. Macroeconomic analysis
and global industry analysis has been studied in an in-depth manner to get a detailed view.
The ratios are computed to understand the performance of the company and the same is
contrasted with the industry benchmark to know the performance.
2
Volkswagen
Contents
Introduction...........................................................................................................................................3
Corporate analysis.................................................................................................................................3
Macroeconomic risks and opportunities...............................................................................................4
Financial analysis...................................................................................................................................5
Profitability ratio............................................................................................................................5
Liquidity.........................................................................................................................................7
Solvency.........................................................................................................................................8
Conclusion...........................................................................................................................................10
References...........................................................................................................................................11
Appendix.............................................................................................................................................12
3
Volkswagen
Introduction
Volkswagen group is the biggest manufacturer of the automobile when it comes to Europe.
When it comes to the future of the giant company, it is worth assessing because in the due
course of years there will be an immense change in the car industry. Electric cars will come
into operation and self-driving will hit the market. The passenger car segment encompasses
the development of vehicles, as well as engines, the production, as well as cars and the strong
part business. The commercial vehicle segment is composed of the development, production
of large bore engine, compressor, and testing system. The financial services consist of dealer
and financing of customer, leasing and insurance activities.
The legislation is regularly changing however, there are risks involved too. Evaluation of
corporate performance is an important consideration for the success of the company. To
attain a strong growth it is of utmost importance that the growth and management should be
in the hands of proper management.
Corporate analysis
There are different reasons to invest in a company. Some vouch for returns, some stress on
solid foundations while some go for healthy prospects. While there are companies that look
forward to responsibility and stress upon people and the environment. However, the desired
need is to have a company that is able to provide value, create value and stand high in terms
of value. This is the main area that Volkswagen strived to be. The company aligns the
business to the main pillars that are digitalization, electrification, and increment in the value
of the shareholder. As per the annual report 2018, it is seen that value addition has been made
in spite of the difficult stage. The value is deriving in terms of 10.8 million vehicles that are
delivered. It is seen in more than 70 new models that are launched by the brand. For instance,
sales climbed to €235.8 billion (Fitch Solution, 2017). On the contrary, the operating profit
climbed to €17.1 billion. Further, at 7.3 percent the operating return on sales before special
items was seen at the upper circuit of the target. As per the financial performance, it is seen
that the group is in a dominating position where the operating business is resilient. When it
comes to Europe, the new WLTP procedure of test lead
4
Secure Best Marks with AI Grader
Need help grading? Try our AI Grader for instant feedback on your assignments.
Volkswagen
The introduction of WTLP is a big challenge to the company (Fitch Solution, 2017). The
coming years will be further influenced by the electric campaign. The company is planning to
invest around €30 billion in electric mobility in the next 5 years. The main emphasis is on the
electric car and by 2025 the company is planning to have 50 new models in operation. The
company further aims to have the first vehicle with an electric model that will have a neutral
supply chain and production in terms of CO2
Macroeconomic risks and opportunities
The increment in the number of partnership leads to opportunities and risks. The diesel issue
leads to risk for the Volkswagen Group and even comprises an influence on the existing risk.
The company uses competitive, as well as environmental analysis to trace the risks and
opportunities that can be related with the help of the products and the efficiency with which
the company produces goods. The risks, as well as opportunities, are already presented in the
medium-term planning and prediction.
The risks are present in the global scenario and turbulence is witnessed in the financial
markets due to the deficit in the structure that poses a huge threat to the performance of the
economies and the markets that are emerging. The transition from a monetary policy of an
expansion one into a restrictive one calls for risks for the macroeconomic environment.
Furthermore, the uncertainty can be witnessed from the withdrawal of the UK from the EU.
Moreover, the presence of high private and public sector debt in various places is proving a
threat to the growth and might cause the market to respond in a negative manner. The decline
in countries, as well as regions, has an instant reaction on the state of the global economy and
hence is a central risk (Adra & Barbopoulos, 2018).
Economic performance varies from one region to another. In lieu of this, it can be
commented that the challenges in terms of trading and sales like efficient inventory
management and a profitable dealer network can be easily meet with the help of appropriate
measures. But, the major financing activities by way of bank loans. The company is exposed
to rivalry for two causes that are the provision of the regulation of the block exemption that
has been applied to after sales service post-June 2010 and secondly, due to the alterations
included in EU regulations regarding access of independent market participants to
information of technical nature (Laux, 2014).
5
Volkswagen
Financial analysis
Profitability ratio
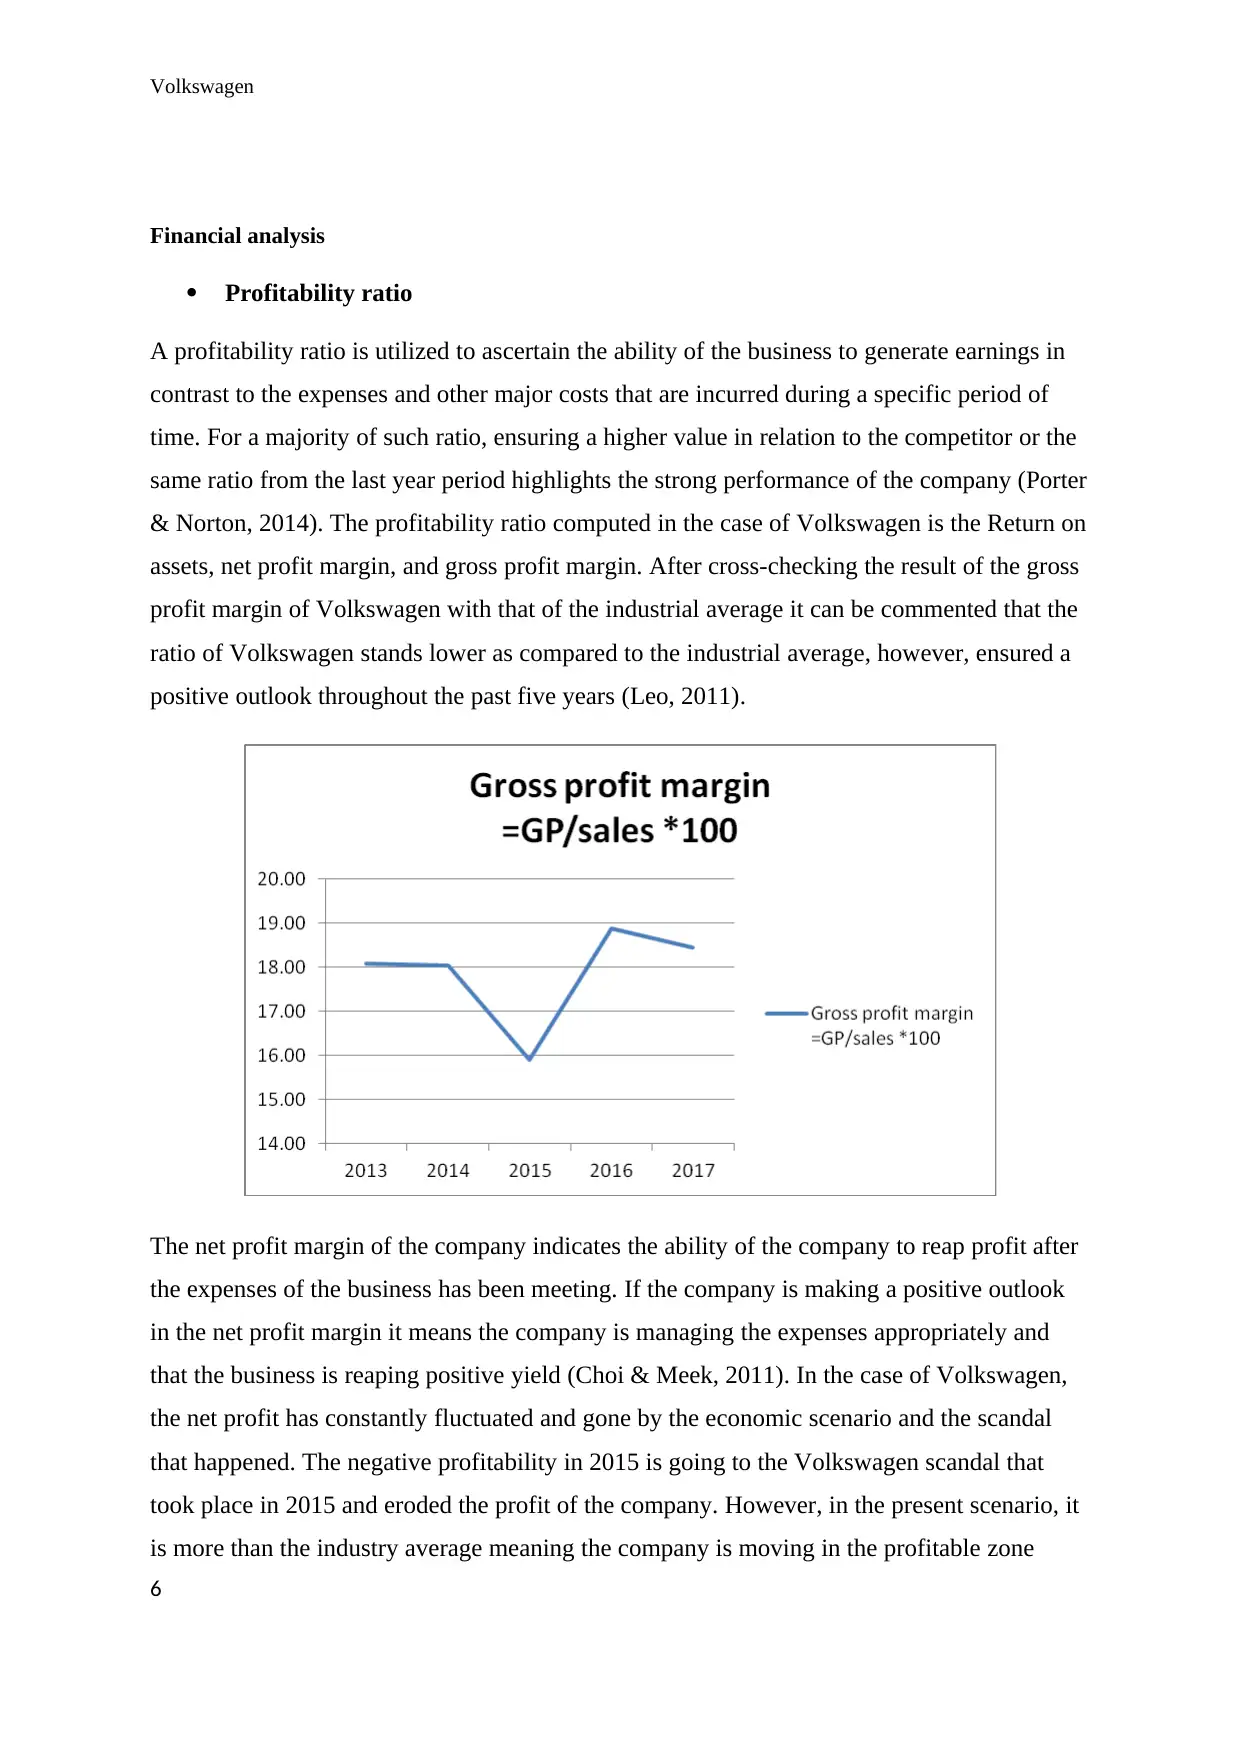
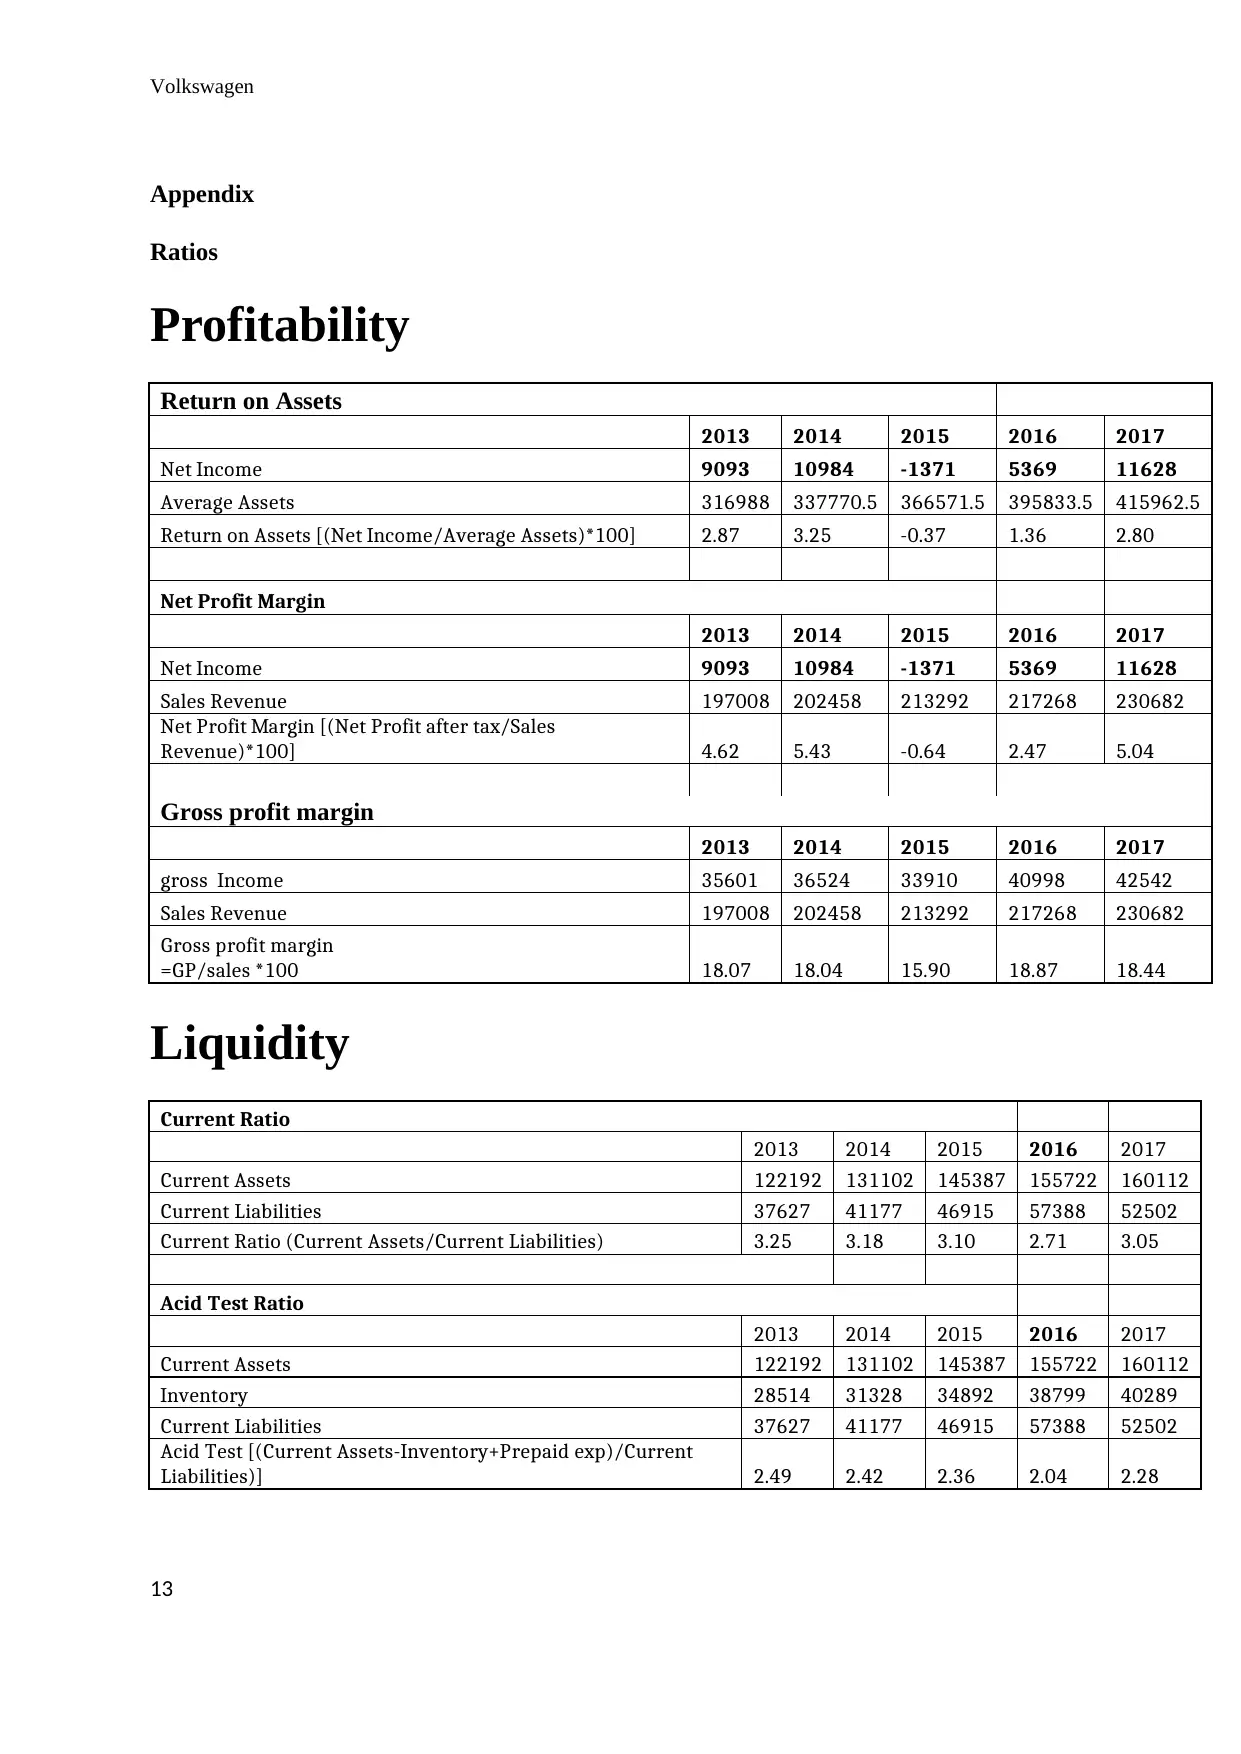
A profitability ratio is utilized to ascertain the ability of the business to generate earnings in
contrast to the expenses and other major costs that are incurred during a specific period of
time. For a majority of such ratio, ensuring a higher value in relation to the competitor or the
same ratio from the last year period highlights the strong performance of the company (Porter
& Norton, 2014). The profitability ratio computed in the case of Volkswagen is the Return on
assets, net profit margin, and gross profit margin. After cross-checking the result of the gross
profit margin of Volkswagen with that of the industrial average it can be commented that the
ratio of Volkswagen stands lower as compared to the industrial average, however, ensured a
positive outlook throughout the past five years (Leo, 2011).
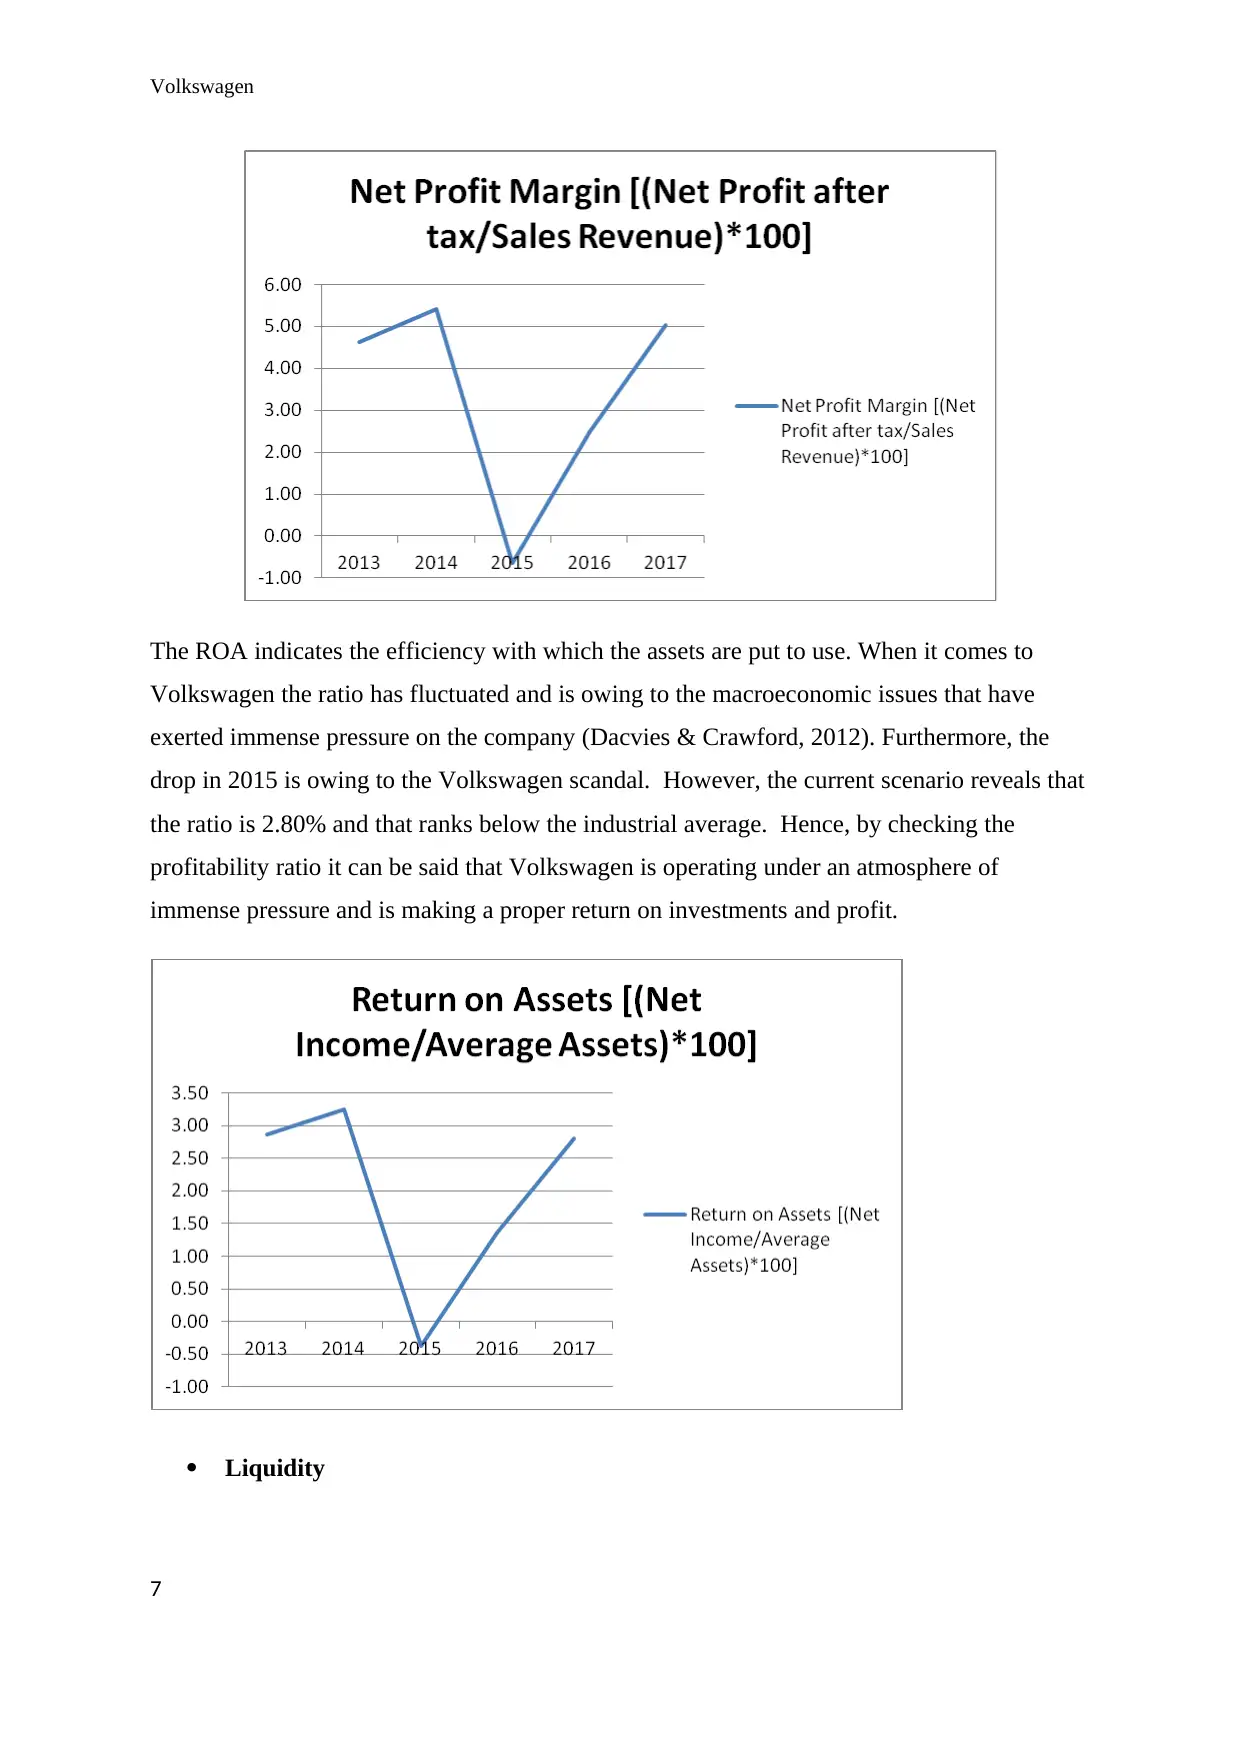
The net profit margin of the company indicates the ability of the company to reap profit after
the expenses of the business has been meeting. If the company is making a positive outlook
in the net profit margin it means the company is managing the expenses appropriately and
that the business is reaping positive yield (Choi & Meek, 2011). In the case of Volkswagen,
the net profit has constantly fluctuated and gone by the economic scenario and the scandal
that happened. The negative profitability in 2015 is going to the Volkswagen scandal that
took place in 2015 and eroded the profit of the company. However, in the present scenario, it
is more than the industry average meaning the company is moving in the profitable zone
6
Financial analysis
Profitability ratio
A profitability ratio is utilized to ascertain the ability of the business to generate earnings in
contrast to the expenses and other major costs that are incurred during a specific period of
time. For a majority of such ratio, ensuring a higher value in relation to the competitor or the
same ratio from the last year period highlights the strong performance of the company (Porter
& Norton, 2014). The profitability ratio computed in the case of Volkswagen is the Return on
assets, net profit margin, and gross profit margin. After cross-checking the result of the gross
profit margin of Volkswagen with that of the industrial average it can be commented that the
ratio of Volkswagen stands lower as compared to the industrial average, however, ensured a
positive outlook throughout the past five years (Leo, 2011).
The net profit margin of the company indicates the ability of the company to reap profit after
the expenses of the business has been meeting. If the company is making a positive outlook
in the net profit margin it means the company is managing the expenses appropriately and
that the business is reaping positive yield (Choi & Meek, 2011). In the case of Volkswagen,
the net profit has constantly fluctuated and gone by the economic scenario and the scandal
that happened. The negative profitability in 2015 is going to the Volkswagen scandal that
took place in 2015 and eroded the profit of the company. However, in the present scenario, it
is more than the industry average meaning the company is moving in the profitable zone
6
Volkswagen
The ROA indicates the efficiency with which the assets are put to use. When it comes to
Volkswagen the ratio has fluctuated and is owing to the macroeconomic issues that have
exerted immense pressure on the company (Dacvies & Crawford, 2012). Furthermore, the
drop in 2015 is owing to the Volkswagen scandal. However, the current scenario reveals that
the ratio is 2.80% and that ranks below the industrial average. Hence, by checking the
profitability ratio it can be said that Volkswagen is operating under an atmosphere of
immense pressure and is making a proper return on investments and profit.
Liquidity
7
Paraphrase This Document
Need a fresh take? Get an instant paraphrase of this document with our AI Paraphraser
Volkswagen
Liquidity ratio helps in computing the ability of the business to meet the obligations of short
tenure. The current ratio and quick ratio has been computed for Volkswagen that helps in
projecting the liquidity scenario of the business (Dyson, 2010).
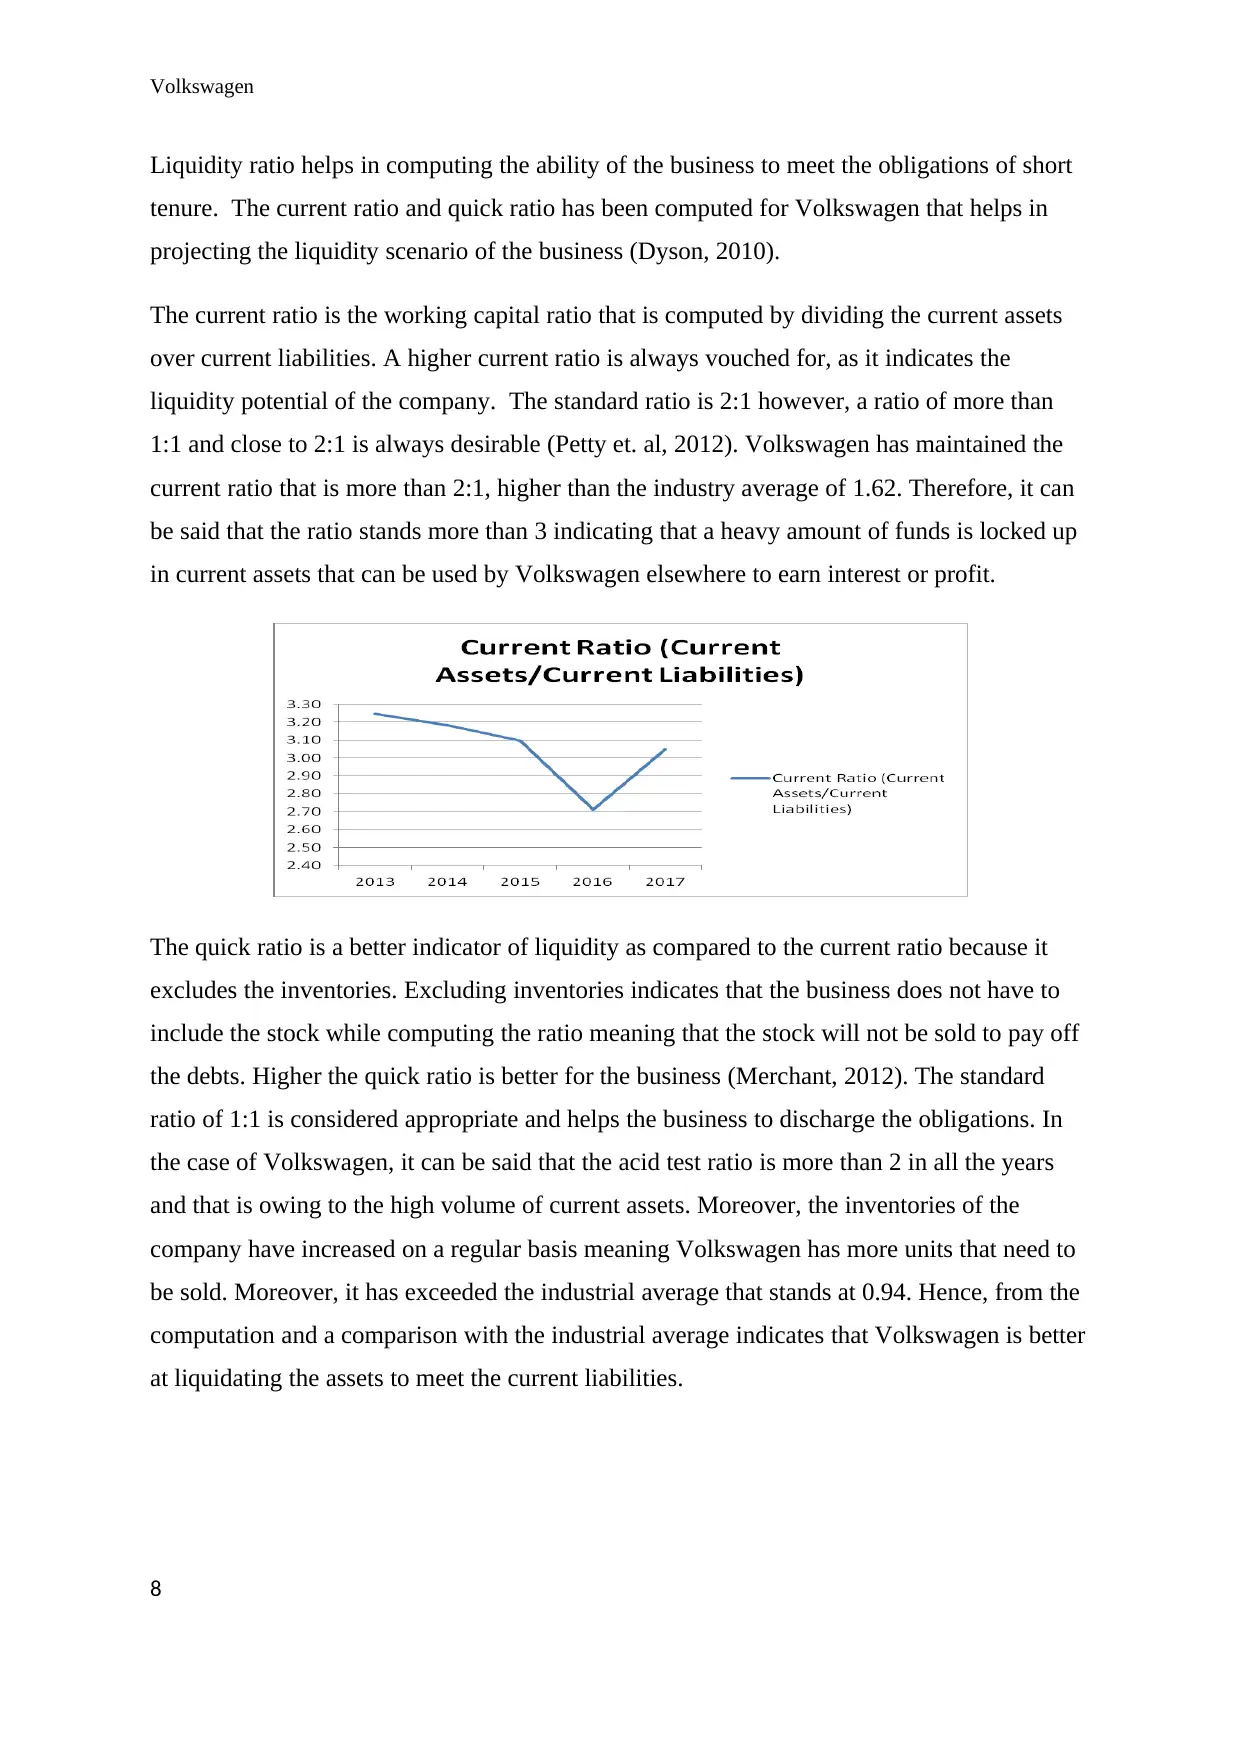
The current ratio is the working capital ratio that is computed by dividing the current assets
over current liabilities. A higher current ratio is always vouched for, as it indicates the
liquidity potential of the company. The standard ratio is 2:1 however, a ratio of more than
1:1 and close to 2:1 is always desirable (Petty et. al, 2012). Volkswagen has maintained the
current ratio that is more than 2:1, higher than the industry average of 1.62. Therefore, it can
be said that the ratio stands more than 3 indicating that a heavy amount of funds is locked up
in current assets that can be used by Volkswagen elsewhere to earn interest or profit.
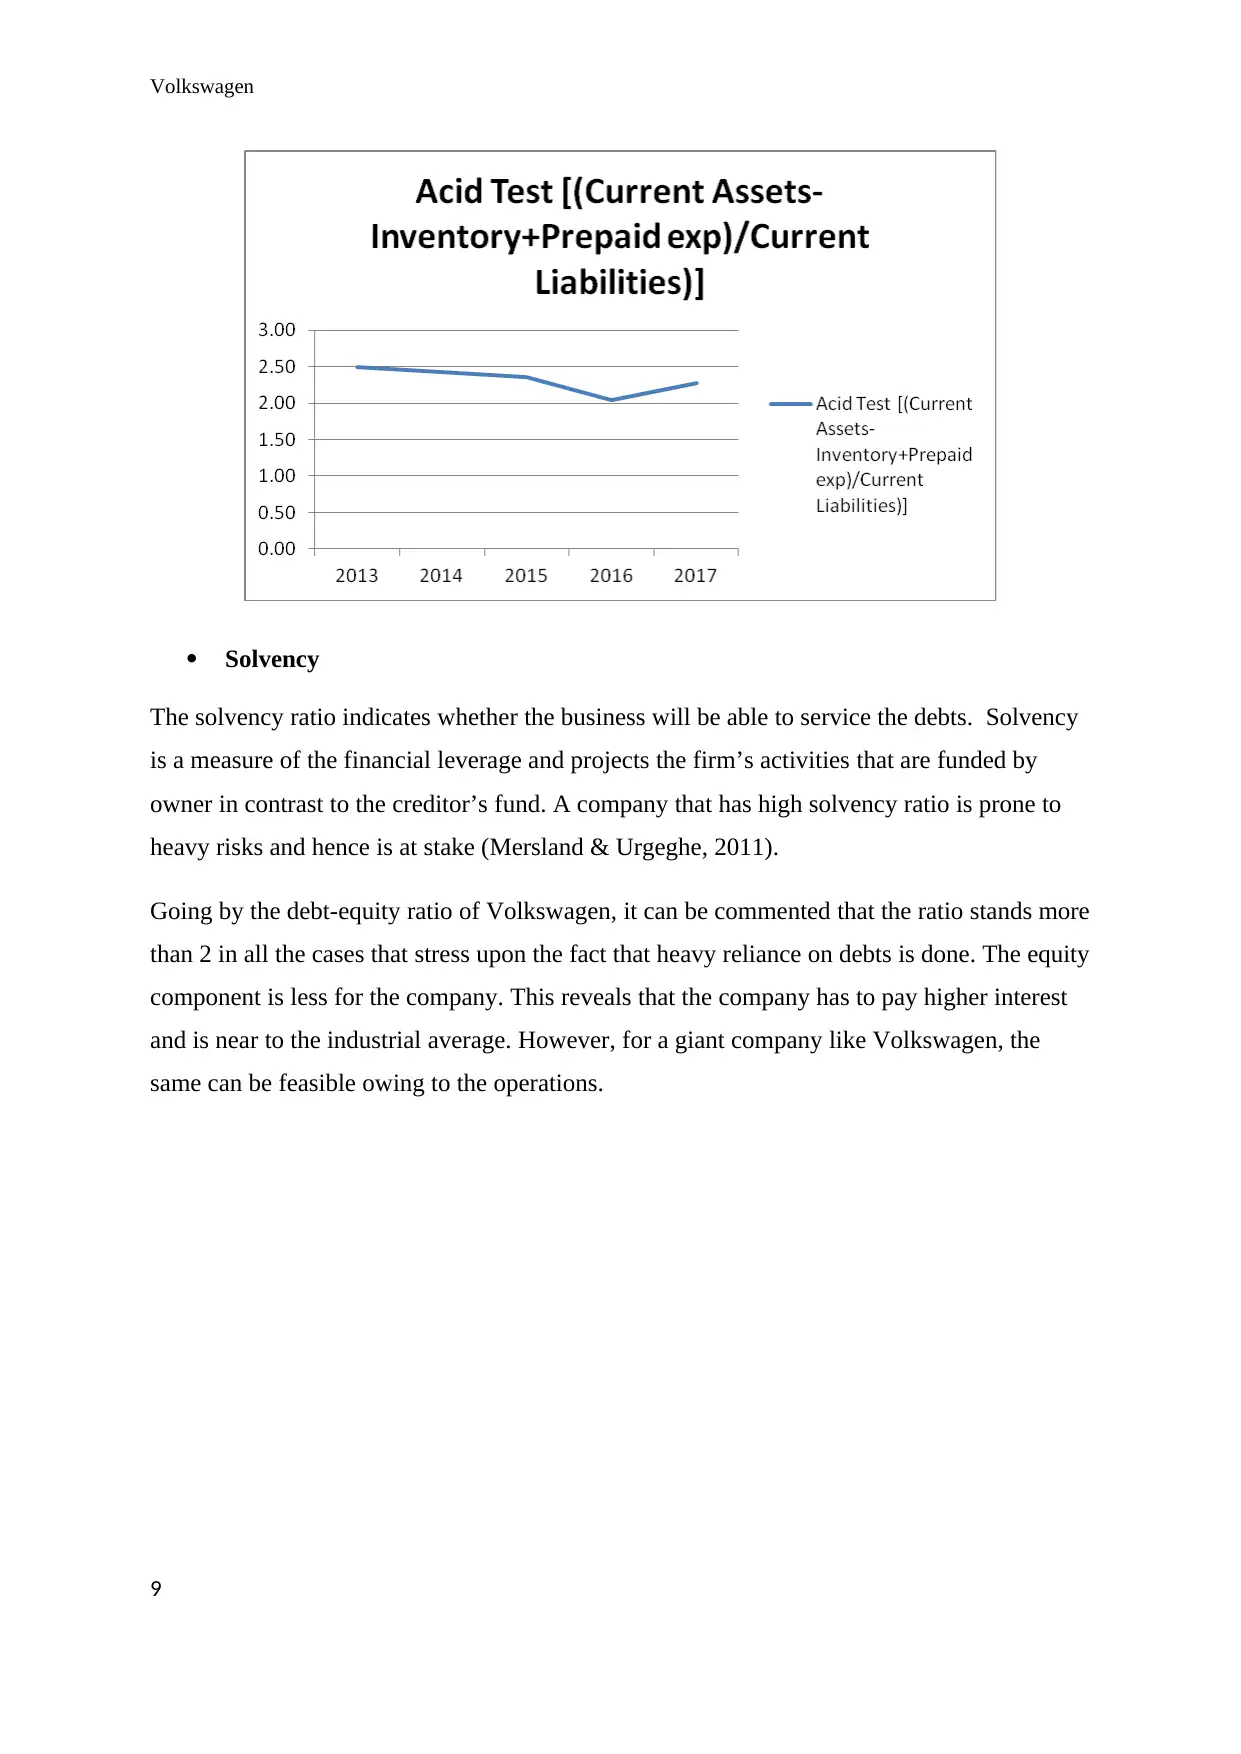
The quick ratio is a better indicator of liquidity as compared to the current ratio because it
excludes the inventories. Excluding inventories indicates that the business does not have to
include the stock while computing the ratio meaning that the stock will not be sold to pay off
the debts. Higher the quick ratio is better for the business (Merchant, 2012). The standard
ratio of 1:1 is considered appropriate and helps the business to discharge the obligations. In
the case of Volkswagen, it can be said that the acid test ratio is more than 2 in all the years
and that is owing to the high volume of current assets. Moreover, the inventories of the
company have increased on a regular basis meaning Volkswagen has more units that need to
be sold. Moreover, it has exceeded the industrial average that stands at 0.94. Hence, from the
computation and a comparison with the industrial average indicates that Volkswagen is better
at liquidating the assets to meet the current liabilities.
8
Liquidity ratio helps in computing the ability of the business to meet the obligations of short
tenure. The current ratio and quick ratio has been computed for Volkswagen that helps in
projecting the liquidity scenario of the business (Dyson, 2010).
The current ratio is the working capital ratio that is computed by dividing the current assets
over current liabilities. A higher current ratio is always vouched for, as it indicates the
liquidity potential of the company. The standard ratio is 2:1 however, a ratio of more than
1:1 and close to 2:1 is always desirable (Petty et. al, 2012). Volkswagen has maintained the
current ratio that is more than 2:1, higher than the industry average of 1.62. Therefore, it can
be said that the ratio stands more than 3 indicating that a heavy amount of funds is locked up
in current assets that can be used by Volkswagen elsewhere to earn interest or profit.
The quick ratio is a better indicator of liquidity as compared to the current ratio because it
excludes the inventories. Excluding inventories indicates that the business does not have to
include the stock while computing the ratio meaning that the stock will not be sold to pay off
the debts. Higher the quick ratio is better for the business (Merchant, 2012). The standard
ratio of 1:1 is considered appropriate and helps the business to discharge the obligations. In
the case of Volkswagen, it can be said that the acid test ratio is more than 2 in all the years
and that is owing to the high volume of current assets. Moreover, the inventories of the
company have increased on a regular basis meaning Volkswagen has more units that need to
be sold. Moreover, it has exceeded the industrial average that stands at 0.94. Hence, from the
computation and a comparison with the industrial average indicates that Volkswagen is better
at liquidating the assets to meet the current liabilities.
8
Volkswagen
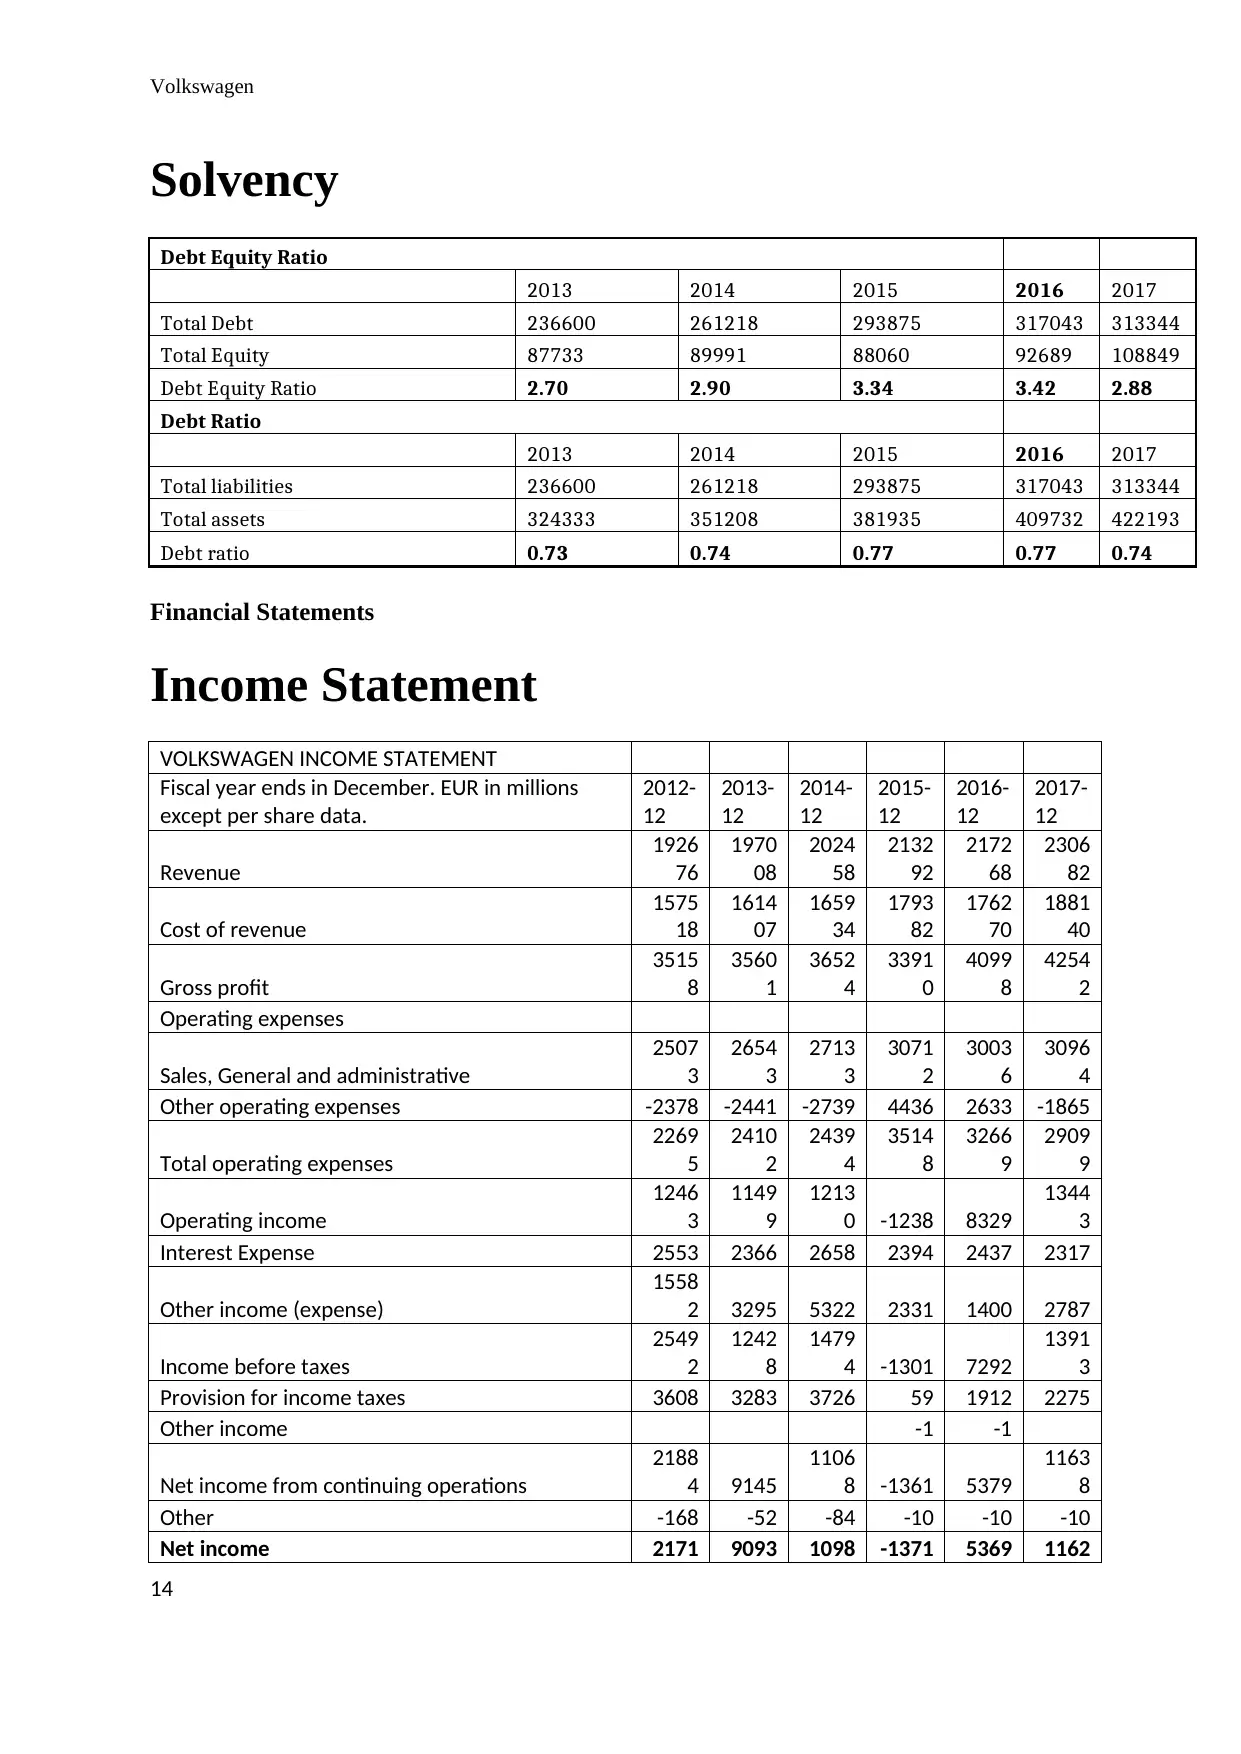
Solvency
The solvency ratio indicates whether the business will be able to service the debts. Solvency
is a measure of the financial leverage and projects the firm’s activities that are funded by
owner in contrast to the creditor’s fund. A company that has high solvency ratio is prone to
heavy risks and hence is at stake (Mersland & Urgeghe, 2011).
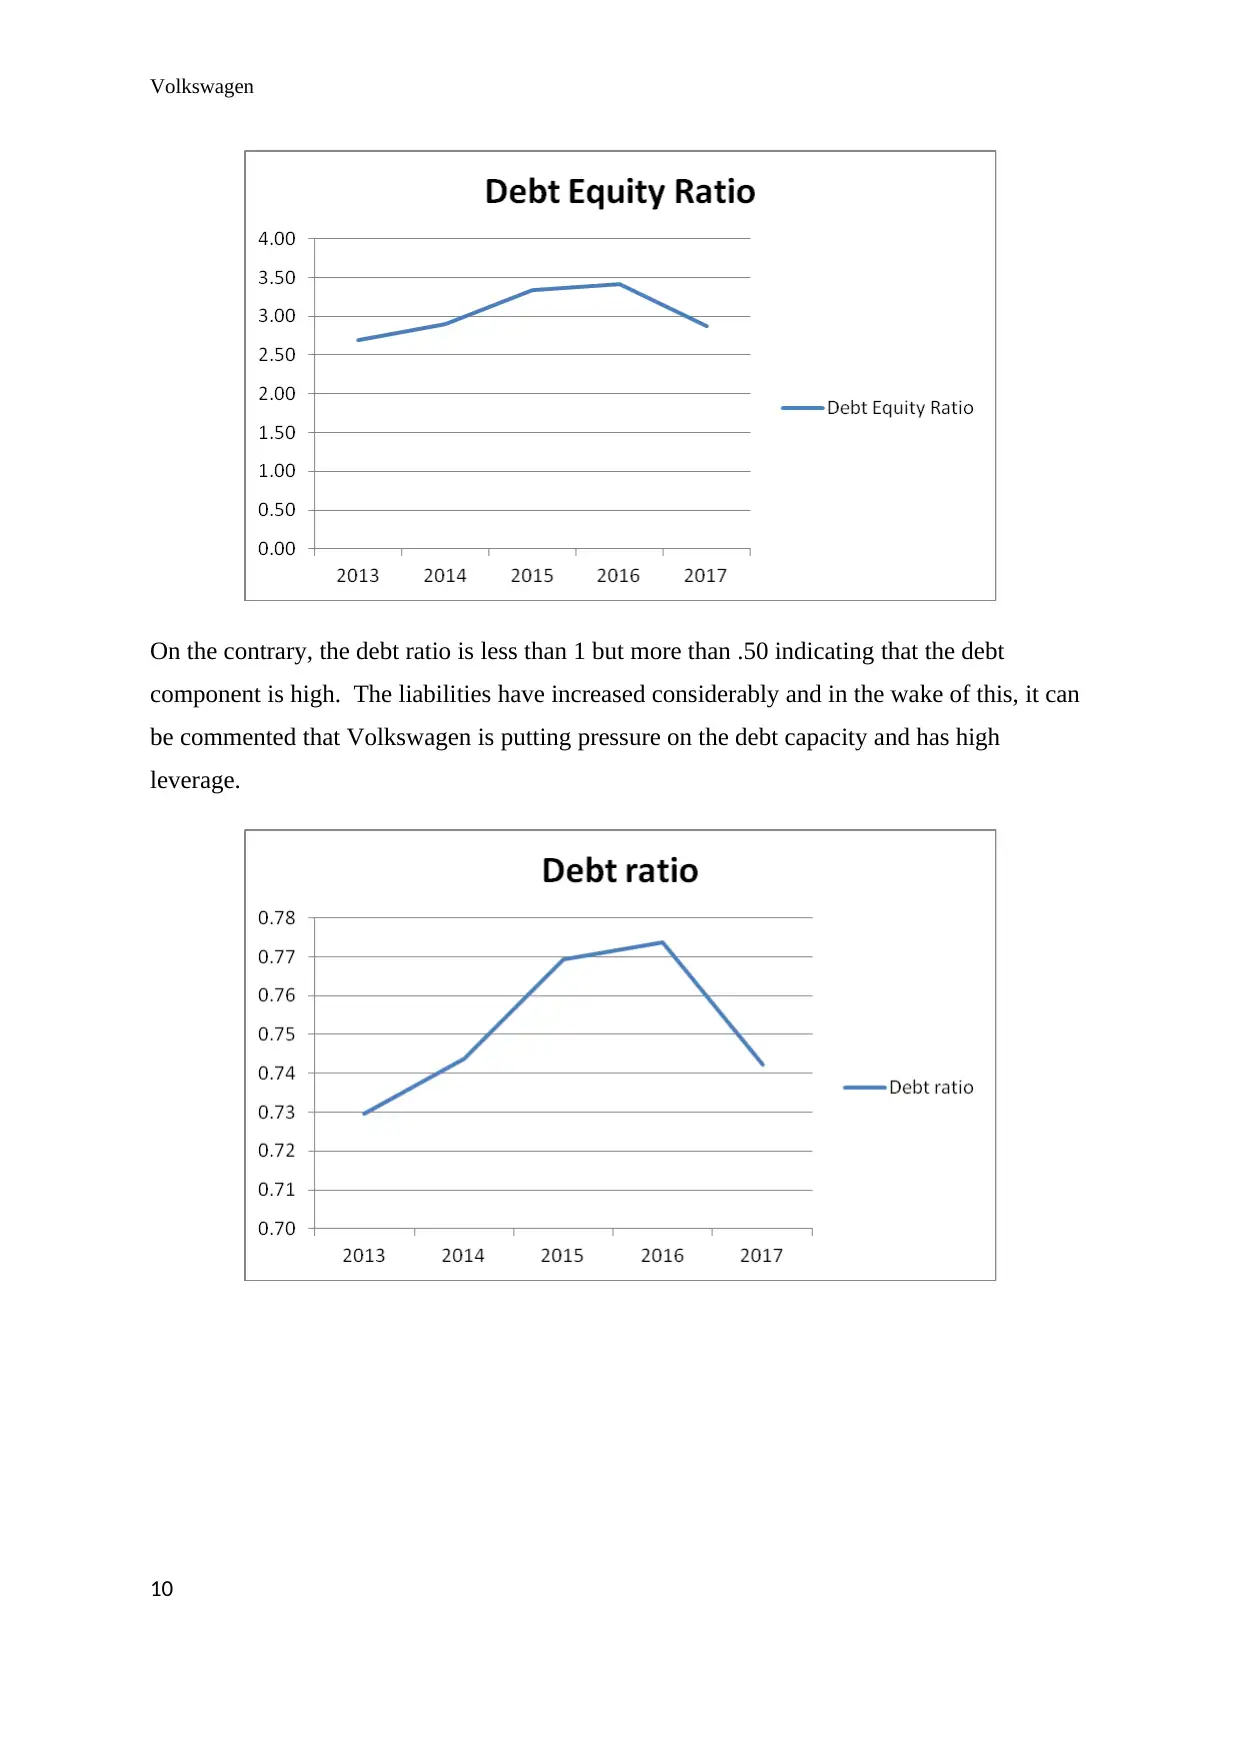
Going by the debt-equity ratio of Volkswagen, it can be commented that the ratio stands more
than 2 in all the cases that stress upon the fact that heavy reliance on debts is done. The equity
component is less for the company. This reveals that the company has to pay higher interest
and is near to the industrial average. However, for a giant company like Volkswagen, the
same can be feasible owing to the operations.
9
Solvency
The solvency ratio indicates whether the business will be able to service the debts. Solvency
is a measure of the financial leverage and projects the firm’s activities that are funded by
owner in contrast to the creditor’s fund. A company that has high solvency ratio is prone to
heavy risks and hence is at stake (Mersland & Urgeghe, 2011).
Going by the debt-equity ratio of Volkswagen, it can be commented that the ratio stands more
than 2 in all the cases that stress upon the fact that heavy reliance on debts is done. The equity
component is less for the company. This reveals that the company has to pay higher interest
and is near to the industrial average. However, for a giant company like Volkswagen, the
same can be feasible owing to the operations.
9
Volkswagen
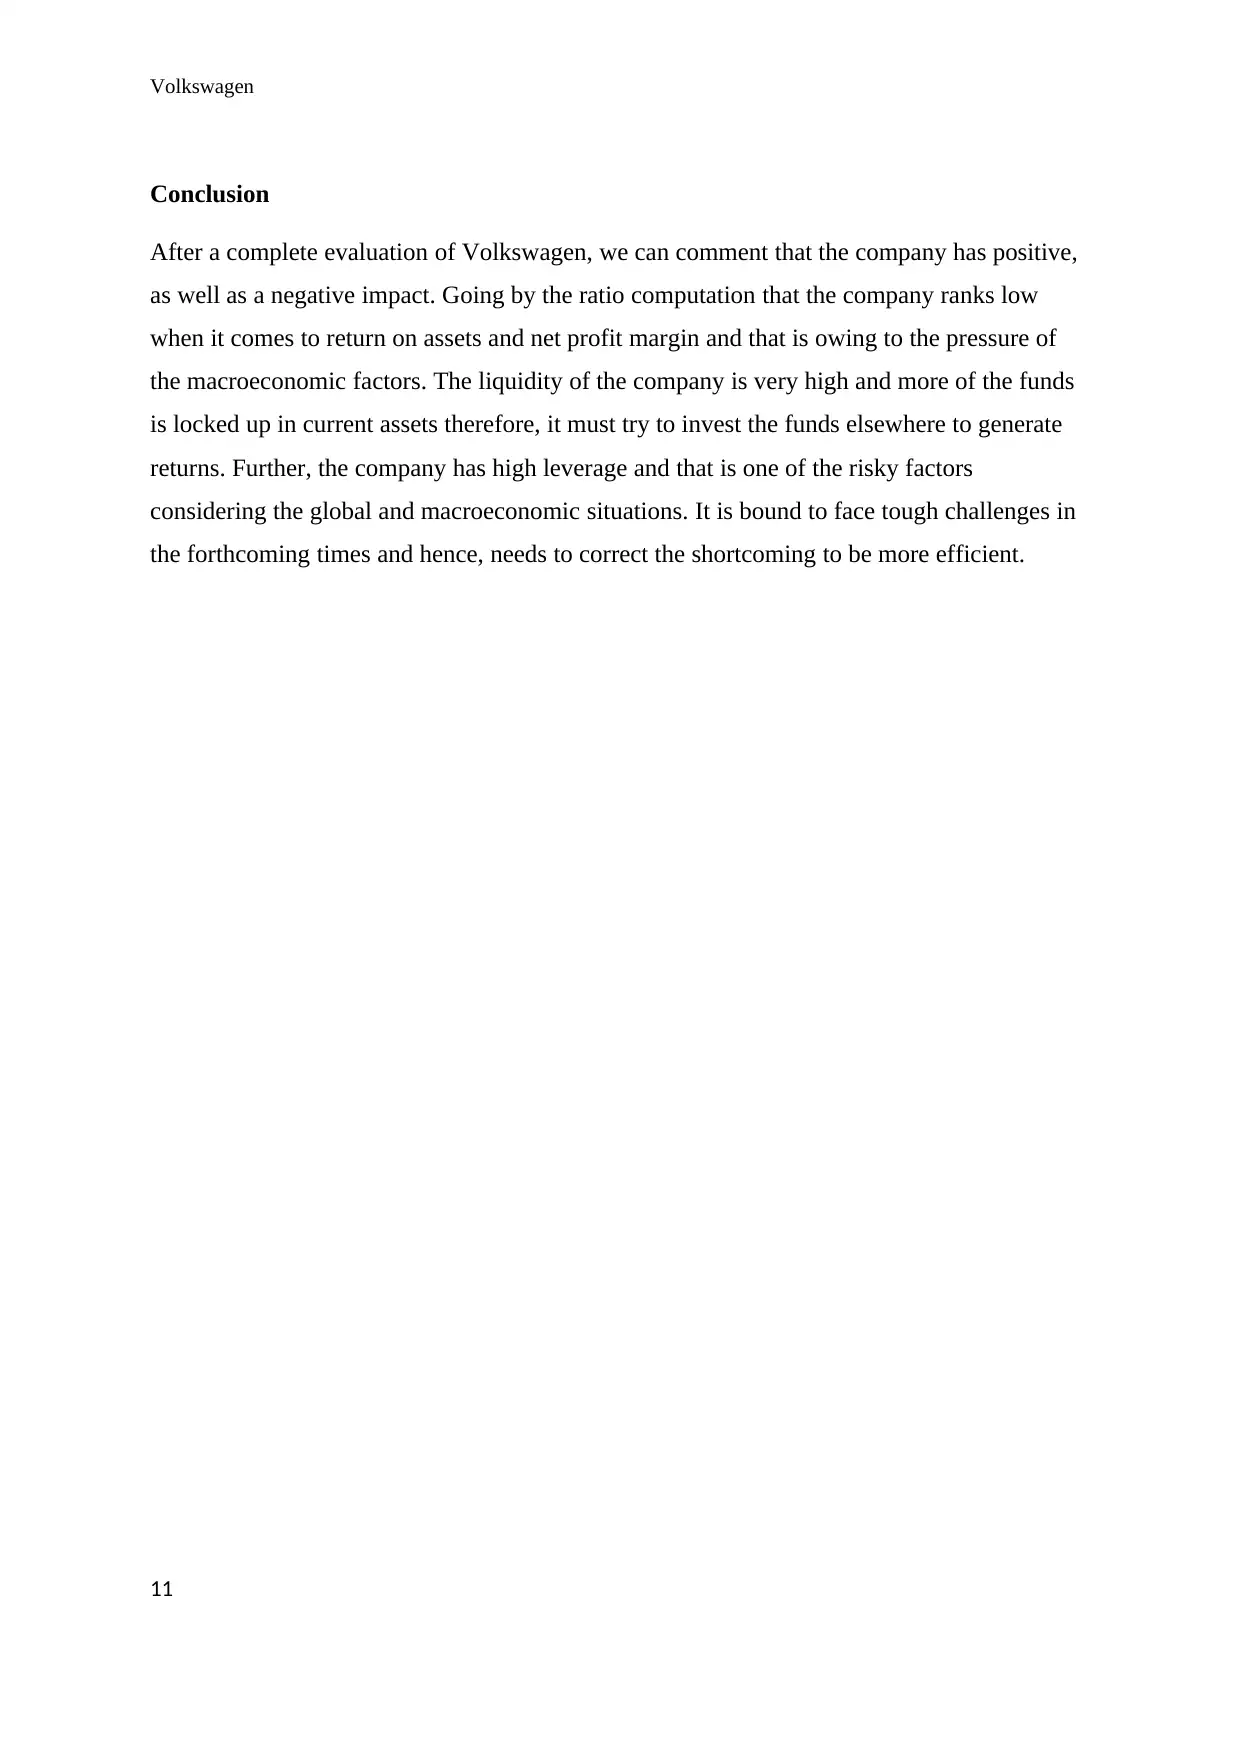
On the contrary, the debt ratio is less than 1 but more than .50 indicating that the debt
component is high. The liabilities have increased considerably and in the wake of this, it can
be commented that Volkswagen is putting pressure on the debt capacity and has high
leverage.
10
On the contrary, the debt ratio is less than 1 but more than .50 indicating that the debt
component is high. The liabilities have increased considerably and in the wake of this, it can
be commented that Volkswagen is putting pressure on the debt capacity and has high
leverage.
10
Secure Best Marks with AI Grader
Need help grading? Try our AI Grader for instant feedback on your assignments.
Volkswagen
Conclusion
After a complete evaluation of Volkswagen, we can comment that the company has positive,
as well as a negative impact. Going by the ratio computation that the company ranks low
when it comes to return on assets and net profit margin and that is owing to the pressure of
the macroeconomic factors. The liquidity of the company is very high and more of the funds
is locked up in current assets therefore, it must try to invest the funds elsewhere to generate
returns. Further, the company has high leverage and that is one of the risky factors
considering the global and macroeconomic situations. It is bound to face tough challenges in
the forthcoming times and hence, needs to correct the shortcoming to be more efficient.
11
Volkswagen
References
Adra, S., & Barbopoulos, L.G. (2018). The valuation effects of investor attention in stock-
financed acquisitions. Journal of Empirical Finance. [online]. 45, 108-125.
https://doi.org/10.1016/j.jempfin.2017.10.001
Choi, R.D. and Meek, G.K. (2011) International accounting. Pearson.
Davies, T. and Crawford, I. (2012) Financial accounting. Harlow, England: Pearson.
Dyson, J.R. (2010) Accounting for non- accounting students. Financial times prentice hall
Fitch Solution. (2017) Key Risks For Volkswagen In 2017. Available from:
https://www.fitchsolutions.com/corporates/autos/key-risks-volkswagen-23-11-2016
[Accessed 30 April 2019]
Laux, B. (2014) Discussion of The role of revenue recognition in performance reporting.
Accounting and Business Research. [online]. 44(4), 380-382. Available from:
http://www.ccsenet.org/journal/index.php/ijbm/article/viewFile/4235/3672 [Accessed 17
May 2018]
Leo, K. J. (2011). Company Accounting. Boston:McGraw Hill
Merchant, K. A. (2012) Making Management Accounting Research More Useful. Pacific
Accounting Review. 24(3), 1-34. Available from
https://pdfs.semanticscholar.org/6ccf/f78a452763f17ed5e4f4ddc6b96703801403.pdf
Needles,
Mersland, R., & Urgeghe, L. (2013) International Debt Financing and Performance of
Microfinance Institutions. Strategic Change. 22, 36-47. Doi:10.1002/jsc.1919.
Petty, J. W, Titman, S., Keown, A. J., Martin, J. D., Burrow, M. and Nguyen, H. (2012)
Financial Management: Principles and Applications, 6th ed. Australia: Pearson Education
Australia.
Porter, G. and Norton, C. (2014) Financial Accounting: The Impact on Decision Maker.
Texas: Cengage Learning
12
Volkswagen
Appendix
Ratios
Profitability
Return on Assets
2013 2014 2015 2016 2017
Net Income 9093 10984 -1371 5369 11628
Average Assets 316988 337770.5 366571.5 395833.5 415962.5
Return on Assets [(Net Income/Average Assets)*100] 2.87 3.25 -0.37 1.36 2.80
Net Profit Margin
2013 2014 2015 2016 2017
Net Income 9093 10984 -1371 5369 11628
Sales Revenue 197008 202458 213292 217268 230682
Net Profit Margin [(Net Profit after tax/Sales
Revenue)*100] 4.62 5.43 -0.64 2.47 5.04
Gross profit margin
2013 2014 2015 2016 2017
gross Income 35601 36524 33910 40998 42542
Sales Revenue 197008 202458 213292 217268 230682
Gross profit margin
=GP/sales *100 18.07 18.04 15.90 18.87 18.44
Liquidity
Current Ratio
2013 2014 2015 2016 2017
Current Assets 122192 131102 145387 155722 160112
Current Liabilities 37627 41177 46915 57388 52502
Current Ratio (Current Assets/Current Liabilities) 3.25 3.18 3.10 2.71 3.05
Acid Test Ratio
2013 2014 2015 2016 2017
Current Assets 122192 131102 145387 155722 160112
Inventory 28514 31328 34892 38799 40289
Current Liabilities 37627 41177 46915 57388 52502
Acid Test [(Current Assets-Inventory+Prepaid exp)/Current
Liabilities)] 2.49 2.42 2.36 2.04 2.28
13
Paraphrase This Document
Need a fresh take? Get an instant paraphrase of this document with our AI Paraphraser
Volkswagen
Solvency
Debt Equity Ratio
2013 2014 2015 2016 2017
Total Debt 236600 261218 293875 317043 313344
Total Equity 87733 89991 88060 92689 108849
Debt Equity Ratio 2.70 2.90 3.34 3.42 2.88
Debt Ratio
2013 2014 2015 2016 2017
Total liabilities 236600 261218 293875 317043 313344
Total assets 324333 351208 381935 409732 422193
Debt ratio 0.73 0.74 0.77 0.77 0.74
Financial Statements
Income Statement
VOLKSWAGEN INCOME STATEMENT
Fiscal year ends in December. EUR in millions
except per share data.
2012-
12
2013-
12
2014-
12
2015-
12
2016-
12
2017-
12
Revenue
1926
76
1970
08
2024
58
2132
92
2172
68
2306
82
Cost of revenue
1575
18
1614
07
1659
34
1793
82
1762
70
1881
40
Gross profit
3515
8
3560
1
3652
4
3391
0
4099
8
4254
2
Operating expenses
Sales, General and administrative
2507
3
2654
3
2713
3
3071
2
3003
6
3096
4
Other operating expenses -2378 -2441 -2739 4436 2633 -1865
Total operating expenses
2269
5
2410
2
2439
4
3514
8
3266
9
2909
9
Operating income
1246
3
1149
9
1213
0 -1238 8329
1344
3
Interest Expense 2553 2366 2658 2394 2437 2317
Other income (expense)
1558
2 3295 5322 2331 1400 2787
Income before taxes
2549
2
1242
8
1479
4 -1301 7292
1391
3
Provision for income taxes 3608 3283 3726 59 1912 2275
Other income -1 -1
Net income from continuing operations
2188
4 9145
1106
8 -1361 5379
1163
8
Other -168 -52 -84 -10 -10 -10
Net income 2171 9093 1098 -1371 5369 1162
14
Volkswagen
6 4 8
Net income available to common shareholders
2171
6 9093
1098
4 -1371 5369
1162
8
Earnings per share
Basic 46.42 18.63 21.84 -3.2 10.24 22.63
Diluted 46.42 18.63 21.84 -3.2 10.24 22.63
Weighted average shares outstanding
Basic 468 486 496 501 501 501
Diluted 468 486 496 501 501 501
EBITDA
4115
9
2944
4
3424
3
2074
9
3052
2
3826
0
Balance Sheet
VOLKSWAGEN BALANCE SHEET
Fiscal year ends in December. EUR in millions
except per share data.
2012-
12
2013-
12
2014-
12
2015-
12
2016-
12
2017-
12
Assets
Current assets
Cash
Cash and cash equivalents 18488 23178 19124 20872 19264 18457
Short-term investments 9696 10674 13469 18684 21695 19725
Total cash 28184 33852 32593 39556 40959 38182
Receivables 47010 49519 55869 58021 61860 66503
Inventories 28502 28514 31328 34892 38799 40289
Prepaid expenses 172 140 139 156 178 127
Other current assets 9193 10167 11173 12762 13926 15011
Total current assets 113061 122192 131102 145387 155722 160112
Non-current assets
Property, plant and equipment
Gross property, plant and equipment 135899 146769 163671 181950 199973 207796
Accumulated Depreciation -76441 -82122 -89916 -98606
-
107500
-
113300
Net property, plant and equipment 59458 64647 73755 83344 92473 94496
Goodwill 23935 23730 23577 23646 23559 23443
Intangible assets 35223 35513 36358 37501 39040 39976
Deferred income taxes 7915 5622 5878 8026 9756 9810
Other long-term assets 70051 72629 80538 84031 89182 94356
Total non-current assets 196582 202141 220106 236548 254010 262081
Total assets 309643 324333 351208 381935 409732 422193
Liabilities and stockholders' equity
Liabilities
Current liabilities
Short-term debt 32053 37627 41177 46915 57388 52502
Capital leases 33 50 34 40 53 51
15
Volkswagen
Accounts payable 17268 18023 19530 20461 22794 23046
Deferred income taxes 1721 2869 2791 1301 1301 1397
Taxes payable 1890 2068 2300 2303 3111 2731
Other current liabilities 52548 57988 64874 77469 92868 80662
Total current liabilities 105513 118625 130706 148489 177515 160389
Non-current liabilities
Long-term debt 61265 60139 67074 71719 63113 79085
Capital leases 396 363 362 431 486 428
Deferred taxes liabilities 13289 11568 7989 8373 8301 8666
Accrued liabilities 715 559 527 663 750 844
Deferred revenues 779 702 146 150 572 694
Pensions and other benefits 24001 21796 29829 27564 33047 32768
Minority interest 4310 2304 198 210 221 229
Other long-term liabilities 21861 20544 24387 36276 33038 30241
Total non-current liabilities 126616 117975 130512 145386 139528 152955
Total liabilities 232129 236600 261218 293875 317043 313344
Stockholders' equity
Common stock
Additional paid-in capital 1191 1191 1218 1283 1283 1283
Retained earnings 72341 71197 69039 70446 81367
Accumulated other comprehensive income 76324 14201 17576 17738 20960 26199
Total stockholders' equity 77515 87733 89991 88060 92689 108849
Total liabilities and stockholders' equity 309644 324333 351209 381935 409732 422193
16
1 out of 16
Related Documents


Your All-in-One AI-Powered Toolkit for Academic Success.
+13062052269
info@desklib.com
Available 24*7 on WhatsApp / Email
![[object Object]](/_next/static/media/star-bottom.7253800d.svg)
Unlock your academic potential
© 2024 | Zucol Services PVT LTD | All rights reserved.