Introduction to Financial Management (FIN254)
Added on 2021-01-05
34 Pages4782 Words180 Views
Ratio Analysis of 2 Cement Companies in BangladeshCourse: Introduction to Financial Management (FIN254)Section 18Submitted to: Khaiyyum HashemSenior Lecturer, Department of Accounting and FinanceRatio Analysis ofHeidelberg Cement Bangladesh Limited & LafargeHolcim Bangladesh LimitedSubmitted by:Rowzatur Rumman Kashfi1620135020Anika Fairuse1311209630
2December 22nd, 2018Khaiyyum Hashem LecturerDepartment of Accounting and FinanceNorth South University Bashundhara R/A, Dhaka-1229Subject: Submission of Group ProjectDear SirWe would like to express our gratitude to you for giving us the opportunity to do a project onratio analysis which not only helped us learn calculating ratios but also helped us to know theeffects of the change in these ratios in decision making.Hereisthereportyouaskedustosubmitontheanalysisoffinancialstatementoftwopublicly listed companies. We have chosen Heidelberg Cement Bangladesh Ltd andLafargeHolcim Bangladesh Limited to do our report on.We have tried our level best to follow it according to your guidelines along with yourinstructions. Any question about the report or any feedback is most welcomed.Sincerely,Rowzatur Rumman Kashfi............................Anika Fairuse............................
Table of Contents1ExecutiveSummary............................................................................................................................52CompanyIntroductions......................................................................................................................62.1Heidelberg CementBangladesh Limited.....................................................................................62.2LafargeHolcimBangladesh Limited............................................................................................63Ratio Analysis (Time Series &CrossSectional)................................................................................73.1LiquidityRatios...........................................................................................................................73.1.1Current Ratio........................................................................................................................73.1.2Quick(Acid-Test) Ratio.......................................................................................................83.2ActivityRatios.............................................................................................................................93.2.1AccountsReceivableTurnover.............................................................................................93.2.2AverageCollectionPeriod..................................................................................................103.2.3AccountsPayableTurnover................................................................................................113.2.4AveragePaymentPeriod.....................................................................................................123.3.5 InventoryTurnover.............................................................................................................133.2.6Average AgeofInventory...................................................................................................143.2.7Total AssetTurnover..........................................................................................................153.2.8Fixed AssetTurnover..........................................................................................................163.3SolvencyRatios.........................................................................................................................173.3.1Debt Ratio...........................................................................................................................173.3.2Debt-EquityRatio...............................................................................................................183.3.3TimesInterestEarned.........................................................................................................193.4ProfitabilityRatios.....................................................................................................................203.4.1GrossProfitMargin............................................................................................................203.4.2Net ProfitMargin................................................................................................................213.4.3Return on TotalAssets (ROA)............................................................................................223.4.4Returnon Equity.................................................................................................................233.5Market Ratios............................................................................................................................243.5.1EarningPerShare...............................................................................................................24
3.5.2Price/ Earnings (P/E)Ratio.................................................................................................253.5.3Book ValueperShare.........................................................................................................263.5.4Market/BookRatio............................................................................................................273.5.5Dividendper Share.............................................................................................................283.5.6DividendYield....................................................................................................................293.5.7DividendPayout.................................................................................................................304RecommendationsandConclusion...................................................................................................315calculations.......................................................................................................................................325.1HeidelbergCementBangladesh.................................................................................................325.2LafargeHolcimBangladesh.......................................................................................................356References........................................................................................................................................38
1ExecutiveSummaryWe had to calculate the financial ratios of two publicly listed companies using their financialstatements for the range of 3 years- 2014 to 2017. We found out the Liquidity ratios, Activityratios, Solvency ratios, Profitability ratios and Market for both the companies. After that weanalyzed the ratios to understand the real finance standings of the company.We consequently did the ‘year wise’ analysis on the 2 cement industries of Bangladesh(Heidelberg Cement Bangladesh Ltd & LafargeHolcim Bangladesh Limited) and then wecompared the ratios of the two companies with each other. We tried our best to make accuratecalculations and analysis and this term paper has benefitted all of our team members.
2CompanyIntroductions2.1Heidelberg Cement BangladeshLimitedHeidelberg Cement Bangladesh Limited is one of the largest producers of cement inBangladesh. Sale of Portland Composite Cement (PCC) through two brands namely ScanCement and Ruby Cement is the key revenue driver of this company. Its manufacturingunites are situated in Chittagong and Kanchpur having a total installed capacity of 2.1 millionMT. Recently,additionalcapacityofgrindingunitof750,000MT/yearinChittagonghadstartedits commercial operation since January 12,2012.2.2LafargeHolcim BangladeshLimitedLafargeHolcim is the leading global construction materials and solutions company servingmasons, builders, architects and engineers all over the world. LafargeHolcim was born of themerger of Lafarge and Holcim in 2015. With over 180 years of combined experience. Ouroperations produce cement, aggregates and ready-mix concrete which are used in buildingprojects ranging from affordable housing and small, local projects to the biggest, mosttechnicallyandarchitecturallychallenginginfrastructureprojects.Asurbanizationincreasingly impacts people and the planet, we provide innovative products and buildingsolutions with a clear commitment to social and environmental sustainability.
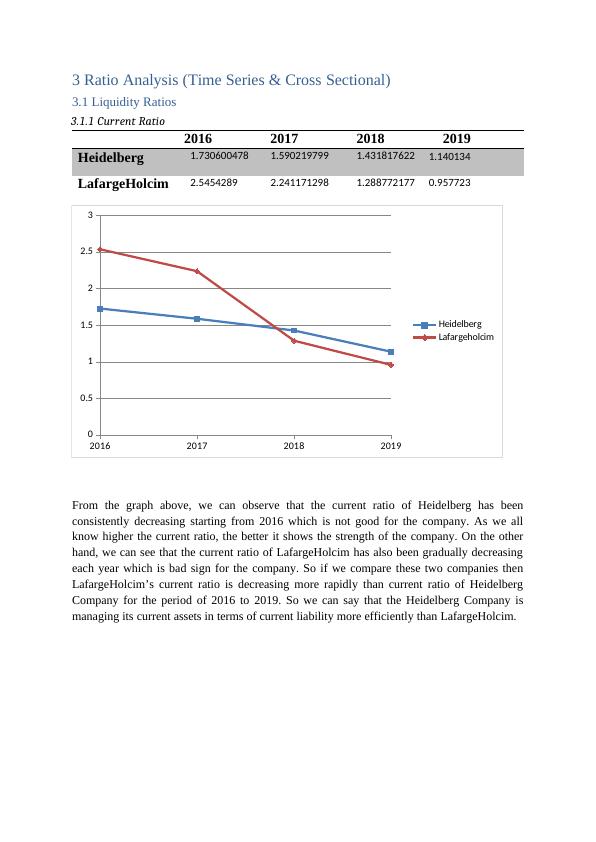
3Ratio Analysis (Time Series & CrossSectional)3.1LiquidityRatios3.1.1CurrentRatio2016201720182019Heidelberg1.7306004781.5902197991.4318176221.140134LafargeHolcim2.54542892.2411712981.2887721770.957723201620172018201900.511.522.53Heidelberg LafargeholcimFromthegraphabove,wecanobservethatthecurrentratioofHeidelberghasbeenconsistently decreasing starting from 2016 which is not good for the company. As we allknow higher the current ratio, the better it shows the strength of the company. On the otherhand, we can see that the current ratio of LafargeHolcim has also been gradually decreasingeach year which is bad sign for the company. So if we compare these two companies thenLafargeHolcim’s current ratio is decreasing more rapidly than current ratio of HeidelbergCompany for the period of 2016 to2019. So we can say that the Heidelberg Company ismanaging its current assets in terms of current liability more efficiently than LafargeHolcim.
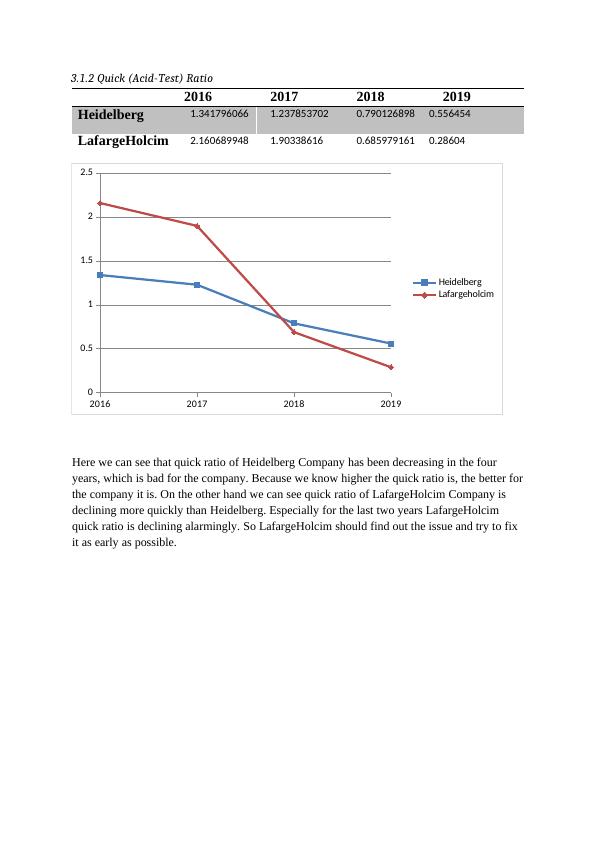
3.1.2Quick (Acid-Test)Ratio2016201720182019Heidelberg1.3417960661.2378537020.7901268980.556454LafargeHolcim2.1606899481.903386160.6859791610.28604201620172018201900.511.522.5HeidelbergLafargeholcimHerewecanseethatquickratioofHeidelbergCompanyhasbeendecreasinginthefouryears, which is bad for the company. Because we know higher the quick ratio is, the better forthe company it is. On the other hand we can see quick ratio of LafargeHolcim Company is declining more quickly than Heidelberg. Especially for the last two years LafargeHolcim quick ratio is declining alarmingly. So LafargeHolcim should find out the issue and try to fix it as early as possible.
End of preview
Want to access all the pages? Upload your documents or become a member.
Related Documents
Calculation and Analysis of Performance Ratios of TPG Telecom Limitedlg...
|18
|3903
|228
Finance for Business - Assignment Samplelg...
|20
|4212
|65
Finance Assignment Solved - Doclg...
|18
|4127
|259
Financial Analysis of Telstra Corporation Limitedlg...
|12
|2396
|51
Financial Management and Analysislg...
|16
|3639
|23
Hospitality Finance And Revenue (pdf)lg...
|15
|3343
|18