401077 Introduction to Biostatistics, Autumn Assignment 1
VerifiedAdded on 2022/08/25
|10
|1229
|15
Assignment
AI Summary
Contribute Materials
Your contribution can guide someone’s learning journey. Share your
documents today.
401077 Introduction to Biostatistics, Autumn 2020
Assignment 1 (Due Sunday March 29, 2020)
“When submitting your assignment to Turnitin you are implicitly ticking these statements:
I retain a backup file of this assignment in case the original file is lost or damaged.
I hereby certify that no part of this assignment or product has been copied from any
other student’s work or from any other source except where due acknowledgement is
made in the assignment.
I hereby certify that no part of this assignment or product has been submitted by me in
another (previous or current) assessment.
I hereby certify that no part of the assignment has been written or produced by any
person.
I hereby certify that no part of this assignment has been made available to any other
student.
I am aware that this work will be reproduced and submitted to plagiarism detection
software for the purpose of detecting possible plagiarism. This software may retain a
copy of this assignment on its database for future plagiarism detection.
I understand that failure to uphold this declaration may result in academic proceedings
in line with the UWS Student Academic Misconduct Policy.”
Your name:
Your student number:
Question 1 (2 marks)
a) Heart rate of a patient is always measured numerically. Hence, it is a quantitative
variable.
b) Student ID is a unique number which is constant. Hence, it is not a variable.
Question 2 (4 marks)
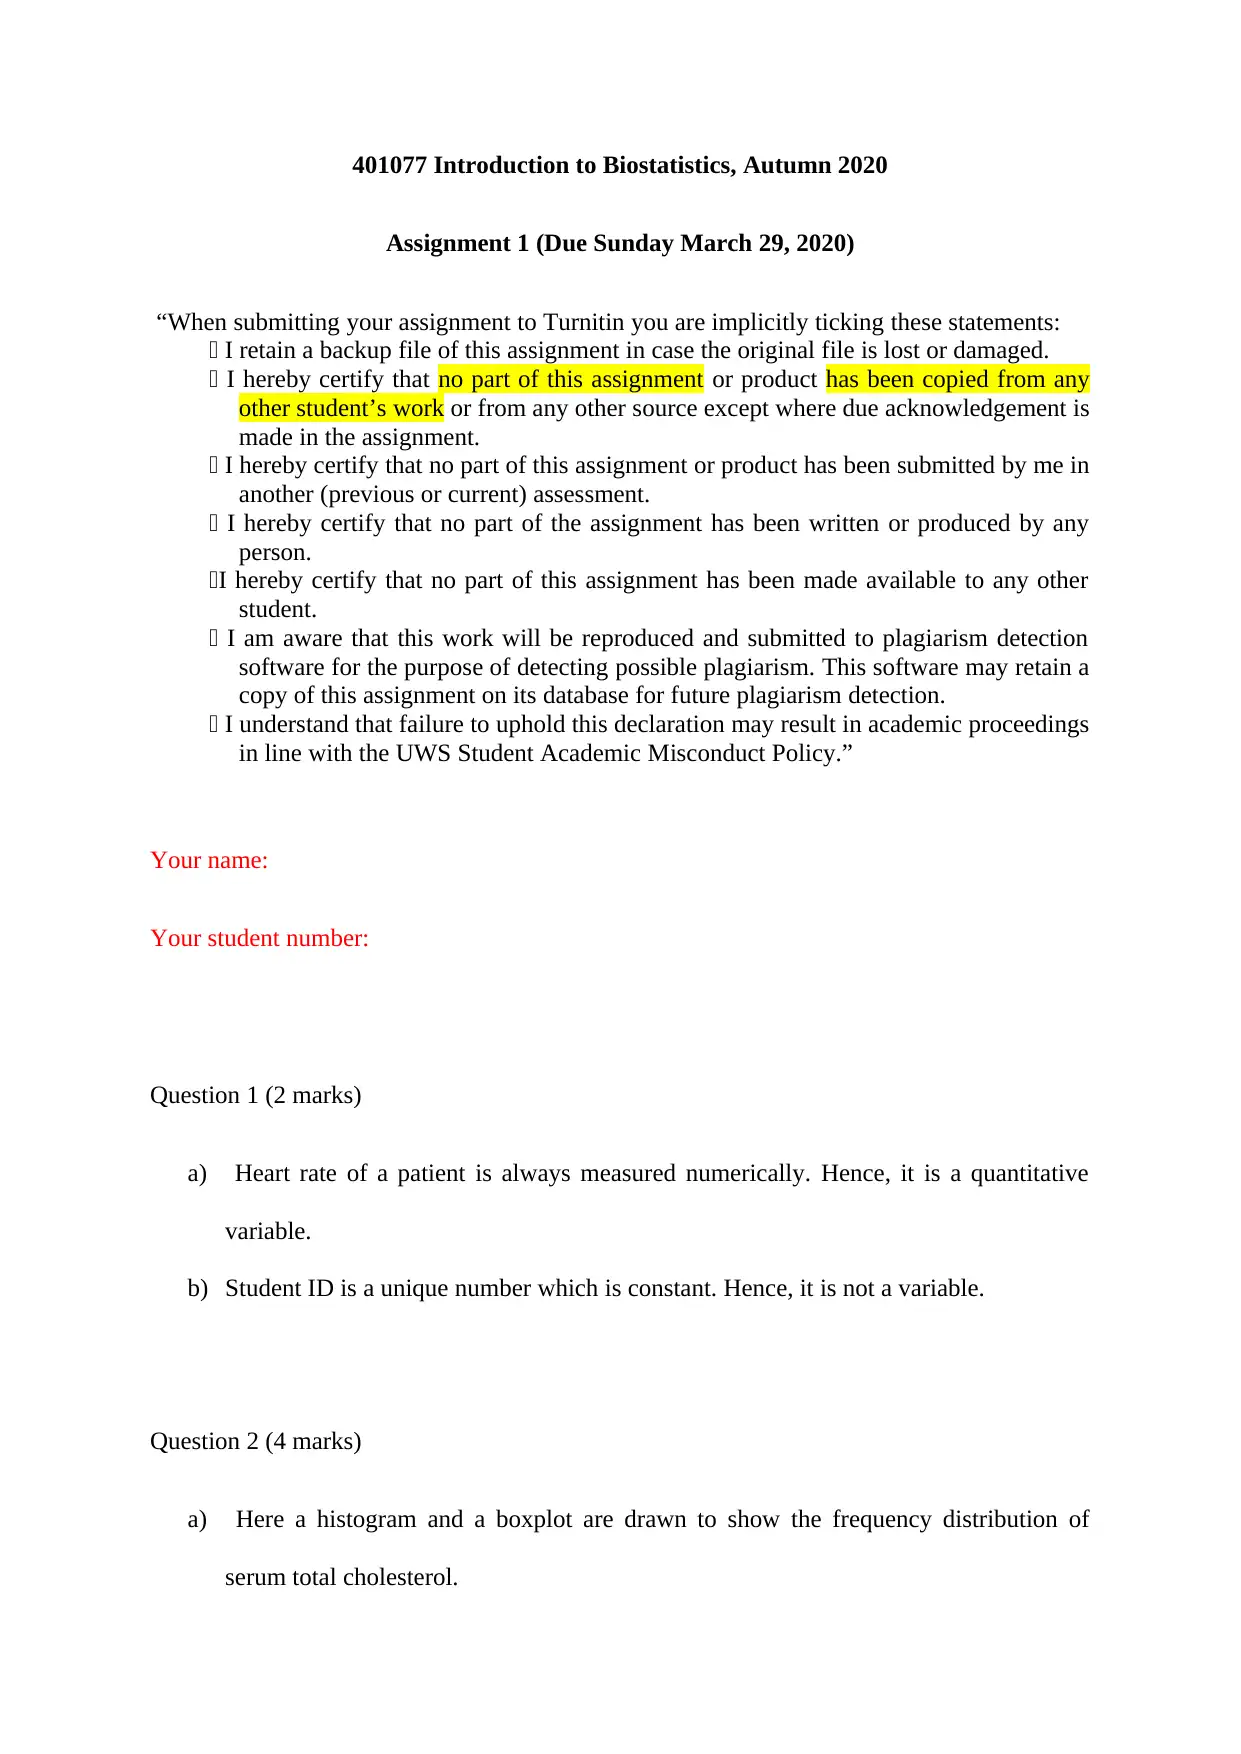
a) Here a histogram and a boxplot are drawn to show the frequency distribution of
serum total cholesterol.
Assignment 1 (Due Sunday March 29, 2020)
“When submitting your assignment to Turnitin you are implicitly ticking these statements:
I retain a backup file of this assignment in case the original file is lost or damaged.
I hereby certify that no part of this assignment or product has been copied from any
other student’s work or from any other source except where due acknowledgement is
made in the assignment.
I hereby certify that no part of this assignment or product has been submitted by me in
another (previous or current) assessment.
I hereby certify that no part of the assignment has been written or produced by any
person.
I hereby certify that no part of this assignment has been made available to any other
student.
I am aware that this work will be reproduced and submitted to plagiarism detection
software for the purpose of detecting possible plagiarism. This software may retain a
copy of this assignment on its database for future plagiarism detection.
I understand that failure to uphold this declaration may result in academic proceedings
in line with the UWS Student Academic Misconduct Policy.”
Your name:
Your student number:
Question 1 (2 marks)
a) Heart rate of a patient is always measured numerically. Hence, it is a quantitative
variable.
b) Student ID is a unique number which is constant. Hence, it is not a variable.
Question 2 (4 marks)
a) Here a histogram and a boxplot are drawn to show the frequency distribution of
serum total cholesterol.
Secure Best Marks with AI Grader
Need help grading? Try our AI Grader for instant feedback on your assignments.
Graph 2.1
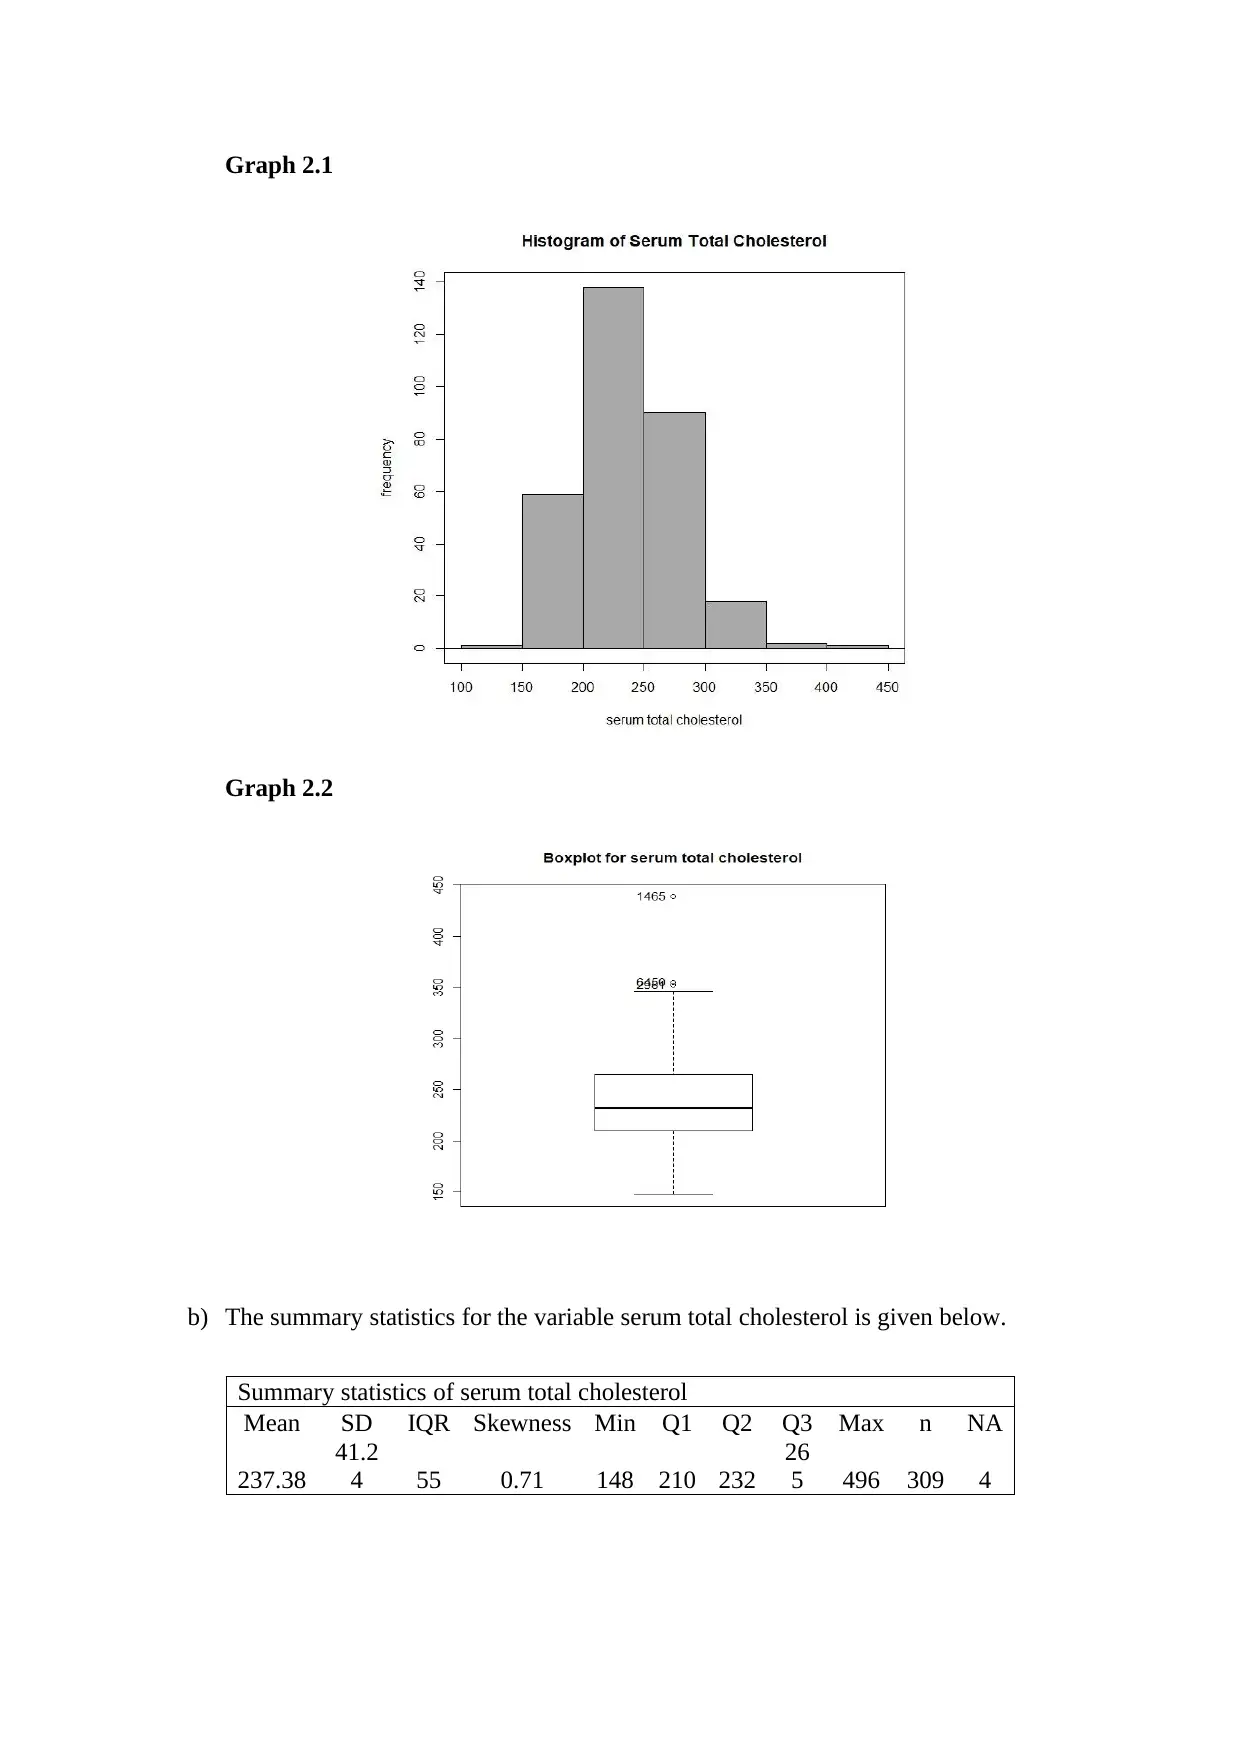
Graph 2.2
b) The summary statistics for the variable serum total cholesterol is given below.
Summary statistics of serum total cholesterol
Mean SD IQR Skewness Min Q1 Q2 Q3 Max n NA
237.38
41.2
4 55 0.71 148 210 232
26
5 496 309 4
Graph 2.2
b) The summary statistics for the variable serum total cholesterol is given below.
Summary statistics of serum total cholesterol
Mean SD IQR Skewness Min Q1 Q2 Q3 Max n NA
237.38
41.2
4 55 0.71 148 210 232
26
5 496 309 4
It can be observed that the mean serum total cholesterol is 237.39mg/dL with
standard deviation 41.24. The minimum and maximum values of the variable are 148
mg/dL and 439mg/dL. The median shows that 50% patients have serum total
cholesterol less than 232mg/dL. The median is less than mean and the skewness is
also positive. Hence, it can be concluded that the distribution of serum total
cholesterol is positively skewed.
Question 3 (3 marks)
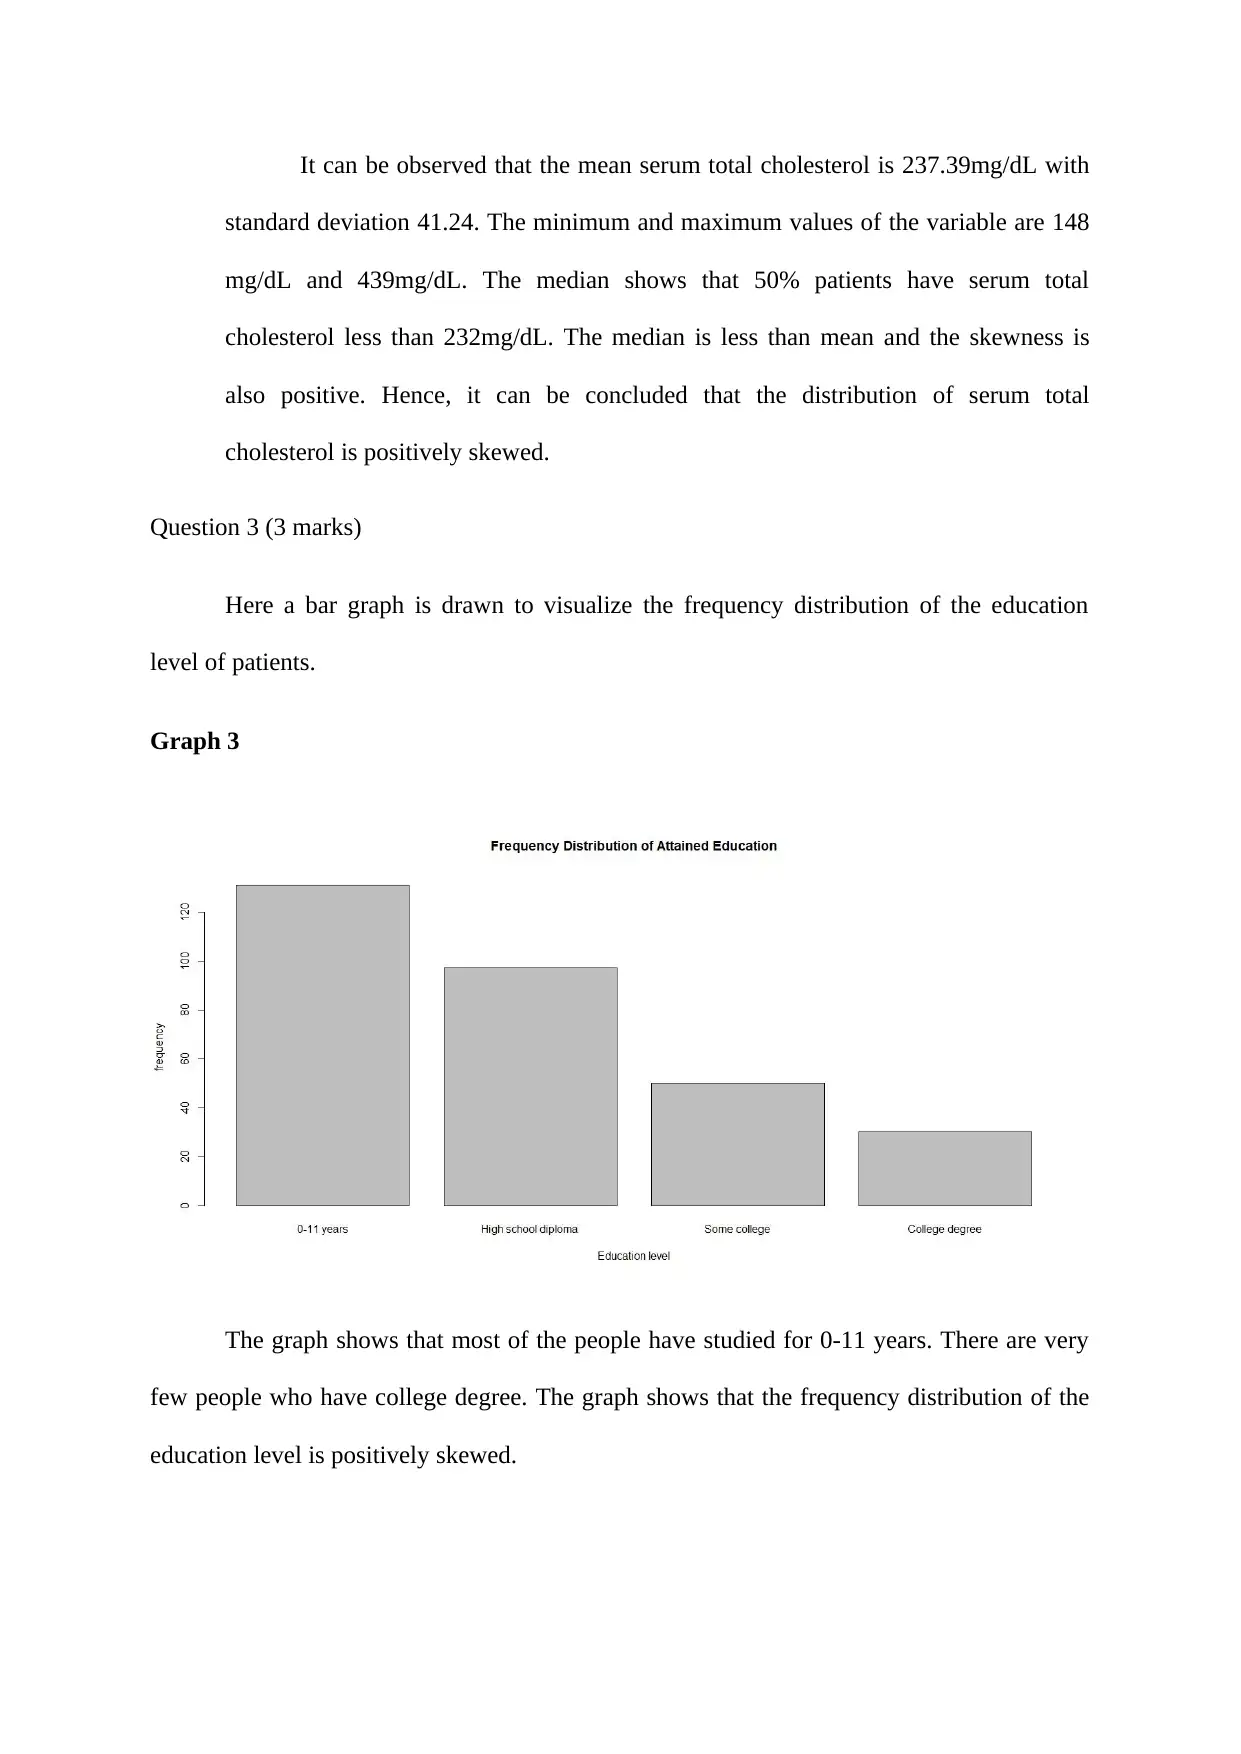
Here a bar graph is drawn to visualize the frequency distribution of the education
level of patients.
Graph 3
The graph shows that most of the people have studied for 0-11 years. There are very
few people who have college degree. The graph shows that the frequency distribution of the
education level is positively skewed.
standard deviation 41.24. The minimum and maximum values of the variable are 148
mg/dL and 439mg/dL. The median shows that 50% patients have serum total
cholesterol less than 232mg/dL. The median is less than mean and the skewness is
also positive. Hence, it can be concluded that the distribution of serum total
cholesterol is positively skewed.
Question 3 (3 marks)
Here a bar graph is drawn to visualize the frequency distribution of the education
level of patients.
Graph 3
The graph shows that most of the people have studied for 0-11 years. There are very
few people who have college degree. The graph shows that the frequency distribution of the
education level is positively skewed.
Question 4 (4 marks)
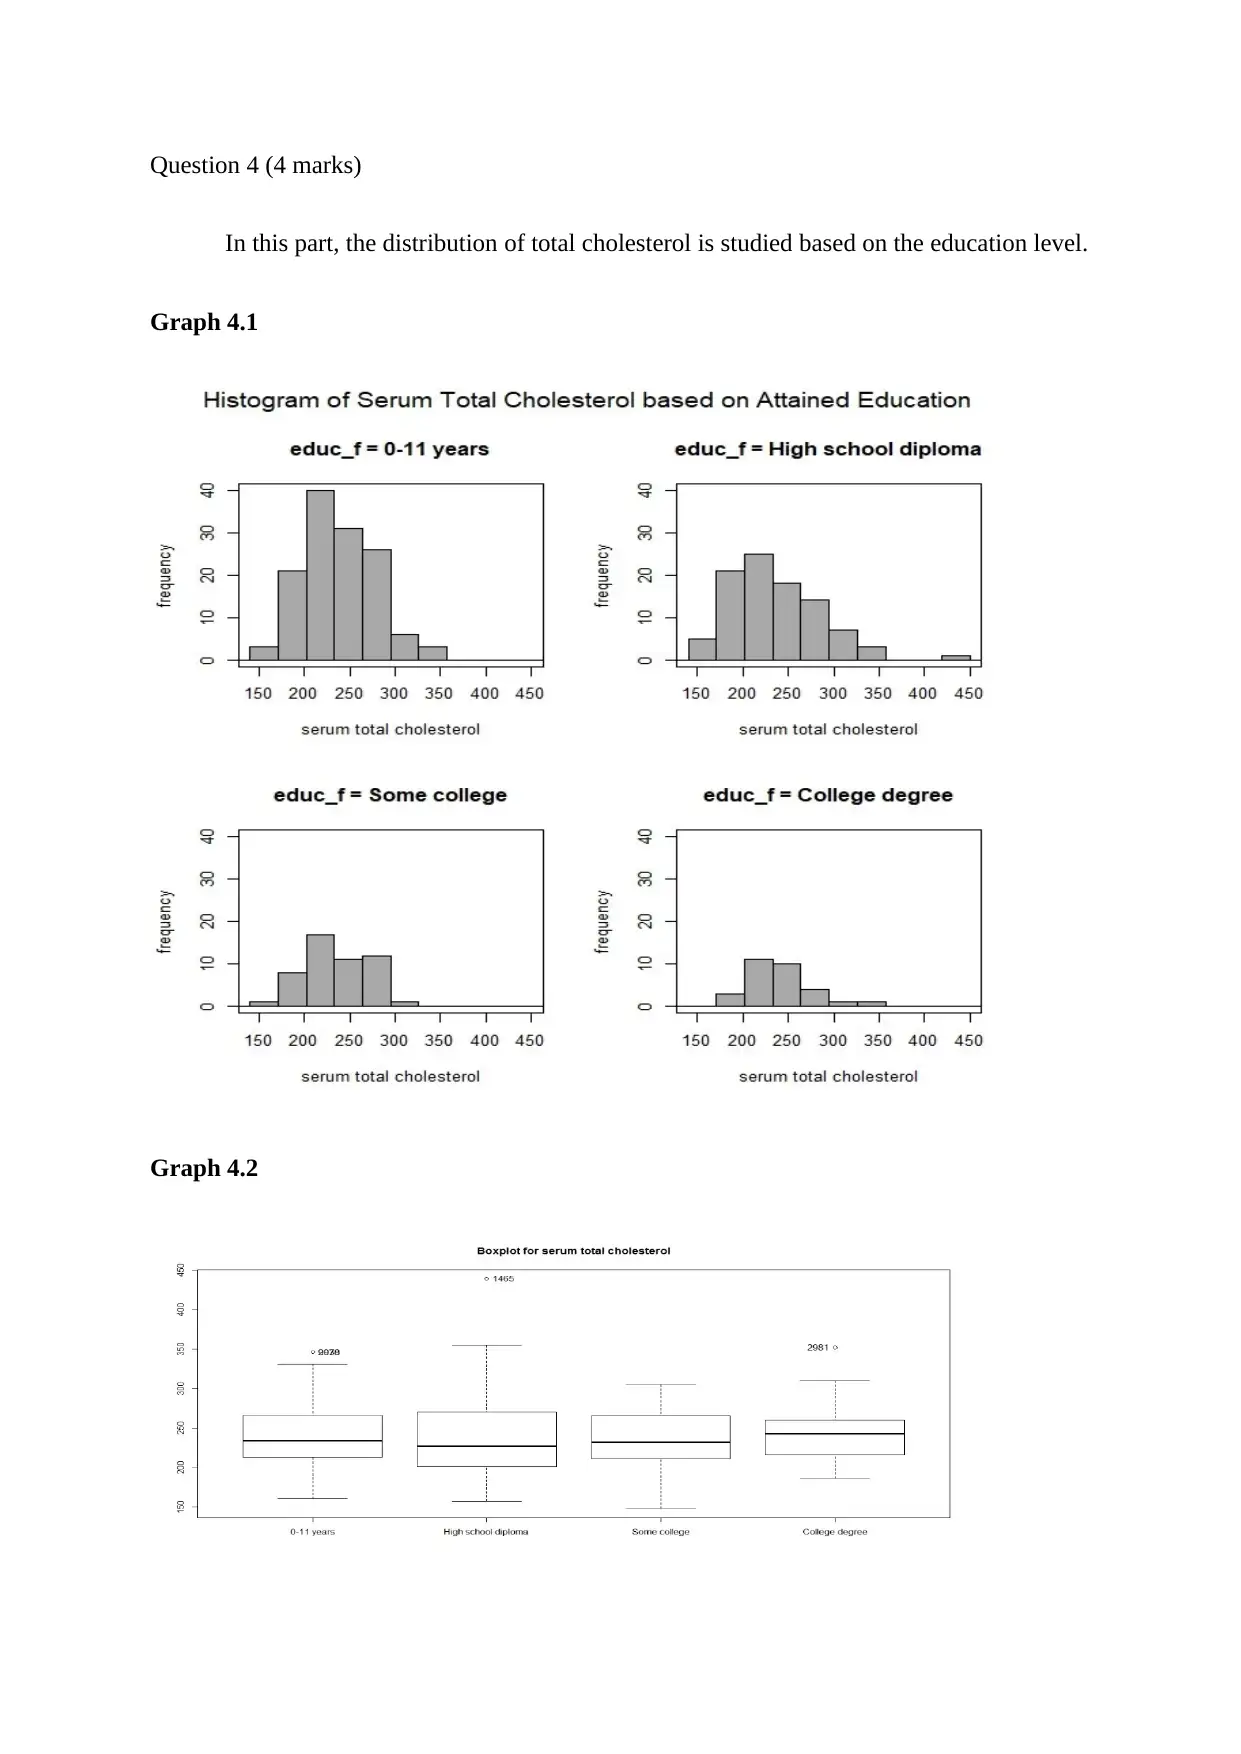
In this part, the distribution of total cholesterol is studied based on the education level.
Graph 4.1
Graph 4.2
In this part, the distribution of total cholesterol is studied based on the education level.
Graph 4.1
Graph 4.2
Secure Best Marks with AI Grader
Need help grading? Try our AI Grader for instant feedback on your assignments.
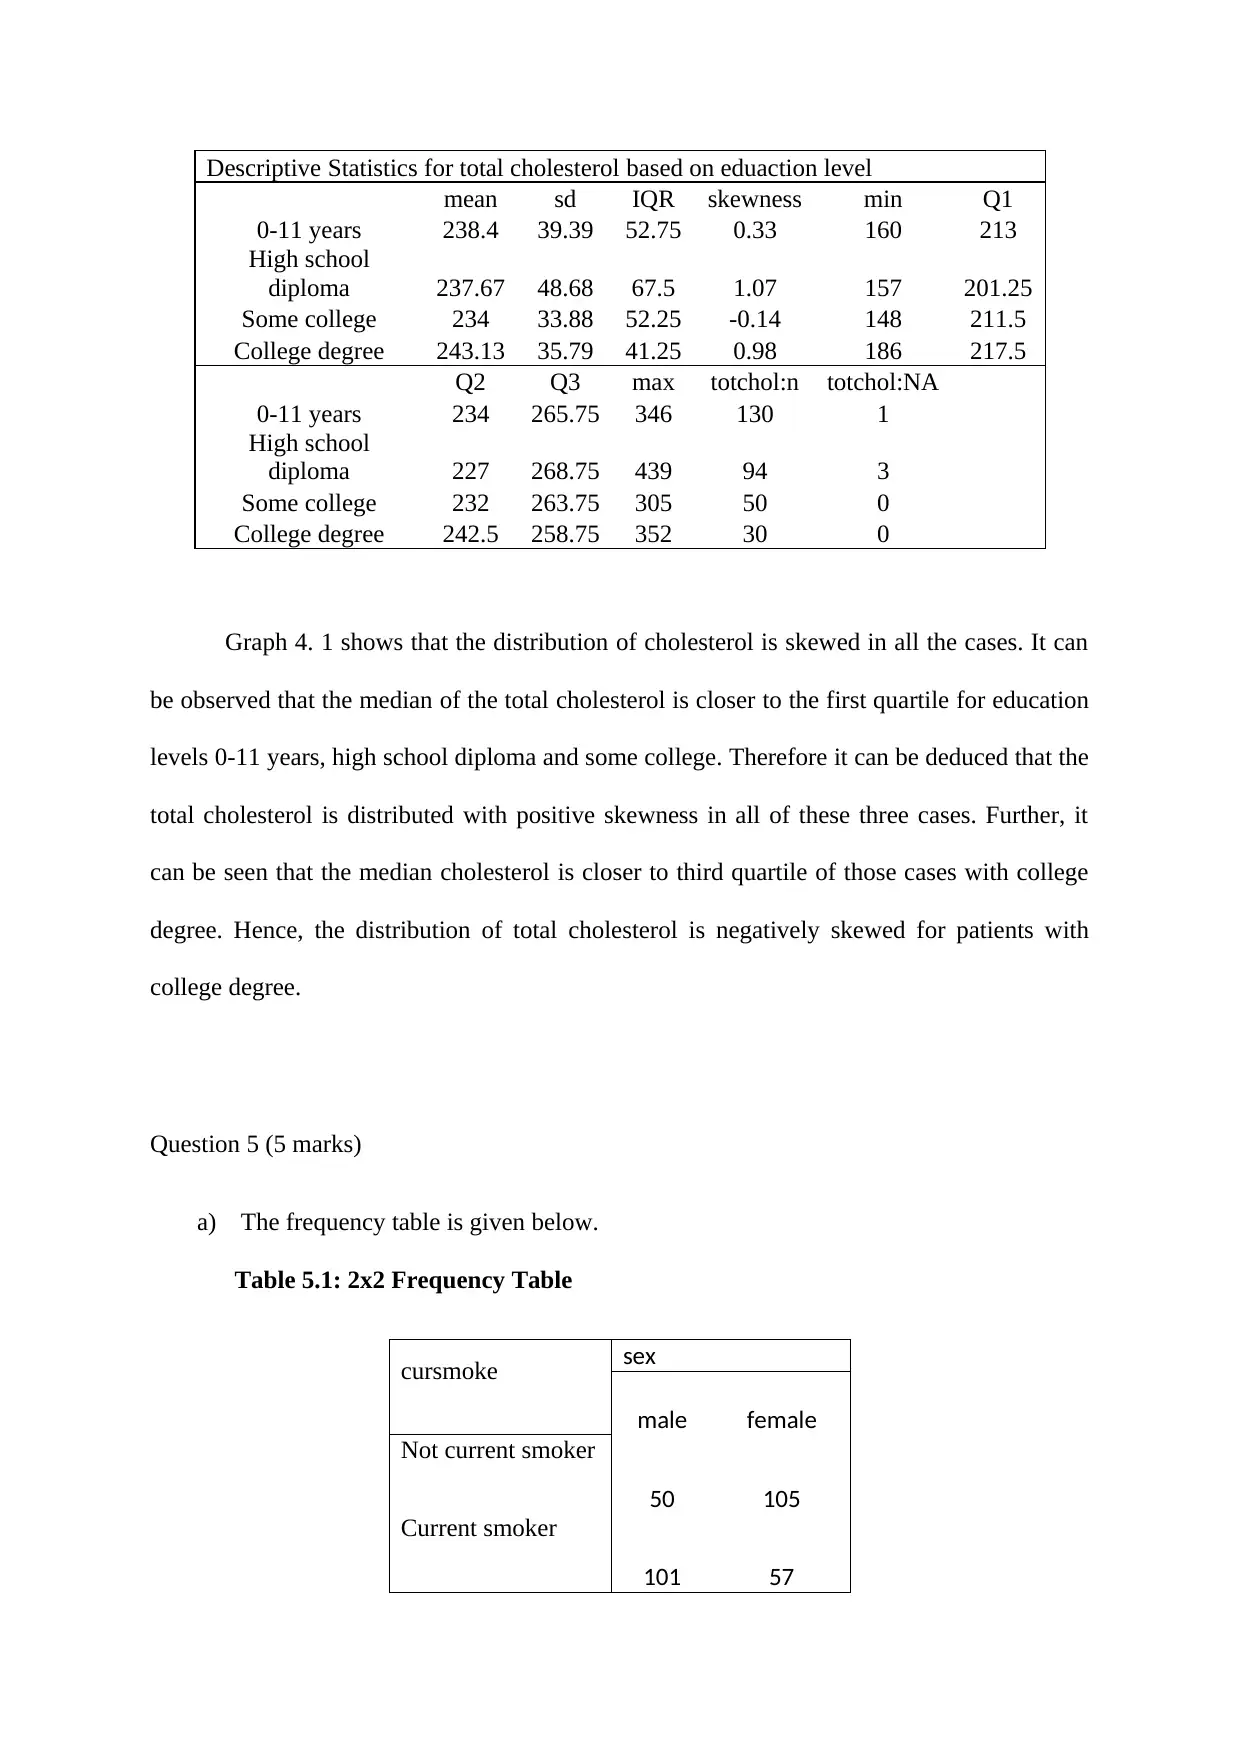
Descriptive Statistics for total cholesterol based on eduaction level
mean sd IQR skewness min Q1
0-11 years 238.4 39.39 52.75 0.33 160 213
High school
diploma 237.67 48.68 67.5 1.07 157 201.25
Some college 234 33.88 52.25 -0.14 148 211.5
College degree 243.13 35.79 41.25 0.98 186 217.5
Q2 Q3 max totchol:n totchol:NA
0-11 years 234 265.75 346 130 1
High school
diploma 227 268.75 439 94 3
Some college 232 263.75 305 50 0
College degree 242.5 258.75 352 30 0
Graph 4. 1 shows that the distribution of cholesterol is skewed in all the cases. It can
be observed that the median of the total cholesterol is closer to the first quartile for education
levels 0-11 years, high school diploma and some college. Therefore it can be deduced that the
total cholesterol is distributed with positive skewness in all of these three cases. Further, it
can be seen that the median cholesterol is closer to third quartile of those cases with college
degree. Hence, the distribution of total cholesterol is negatively skewed for patients with
college degree.
Question 5 (5 marks)
a) The frequency table is given below.
Table 5.1: 2x2 Frequency Table
cursmoke sex
male female
Not current smoker
50 105
Current smoker
101 57
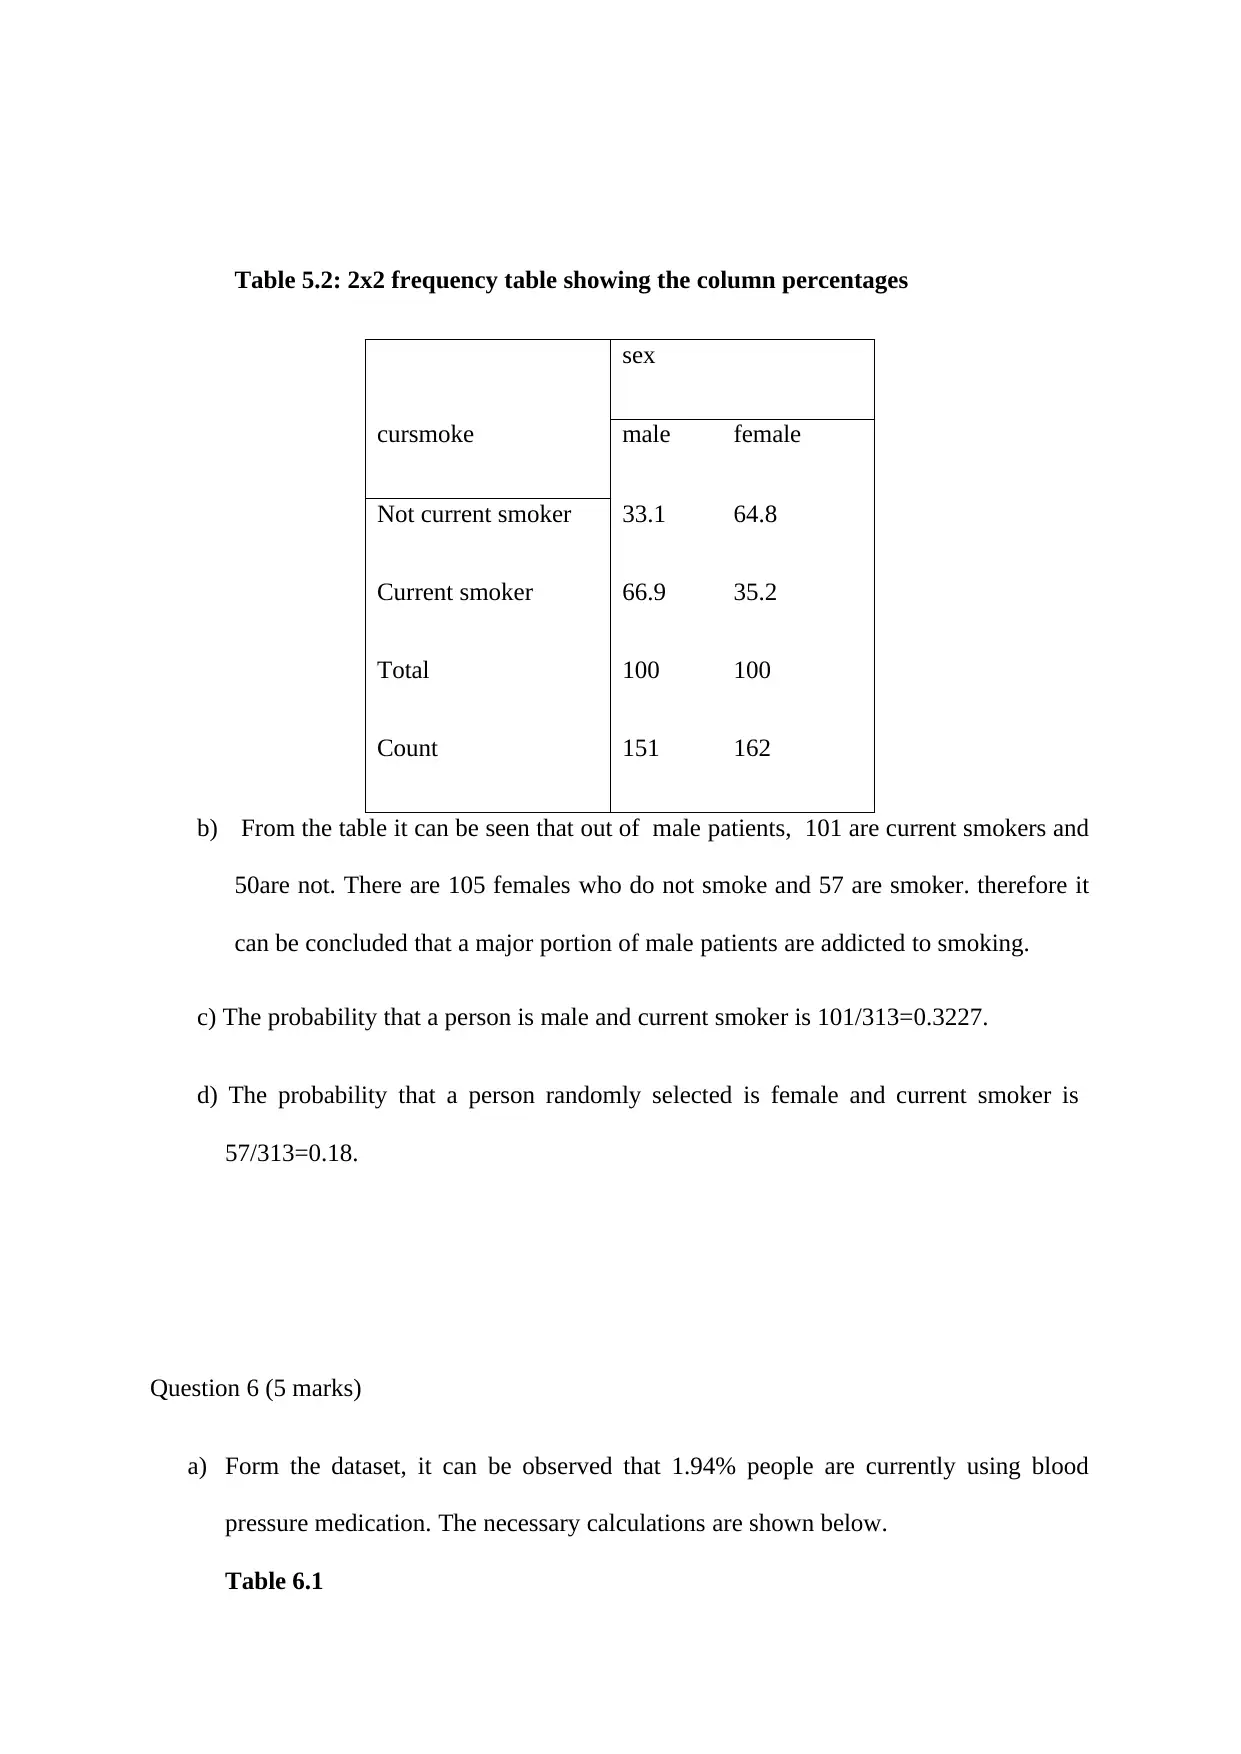
Table 5.2: 2x2 frequency table showing the column percentages
cursmoke
sex
male female
Not current smoker 33.1 64.8
Current smoker 66.9 35.2
Total 100 100
Count 151 162
b) From the table it can be seen that out of male patients, 101 are current smokers and
50are not. There are 105 females who do not smoke and 57 are smoker. therefore it
can be concluded that a major portion of male patients are addicted to smoking.
c) The probability that a person is male and current smoker is 101/313=0.3227.
d) The probability that a person randomly selected is female and current smoker is
57/313=0.18.
Question 6 (5 marks)
a) Form the dataset, it can be observed that 1.94% people are currently using blood
pressure medication. The necessary calculations are shown below.
Table 6.1
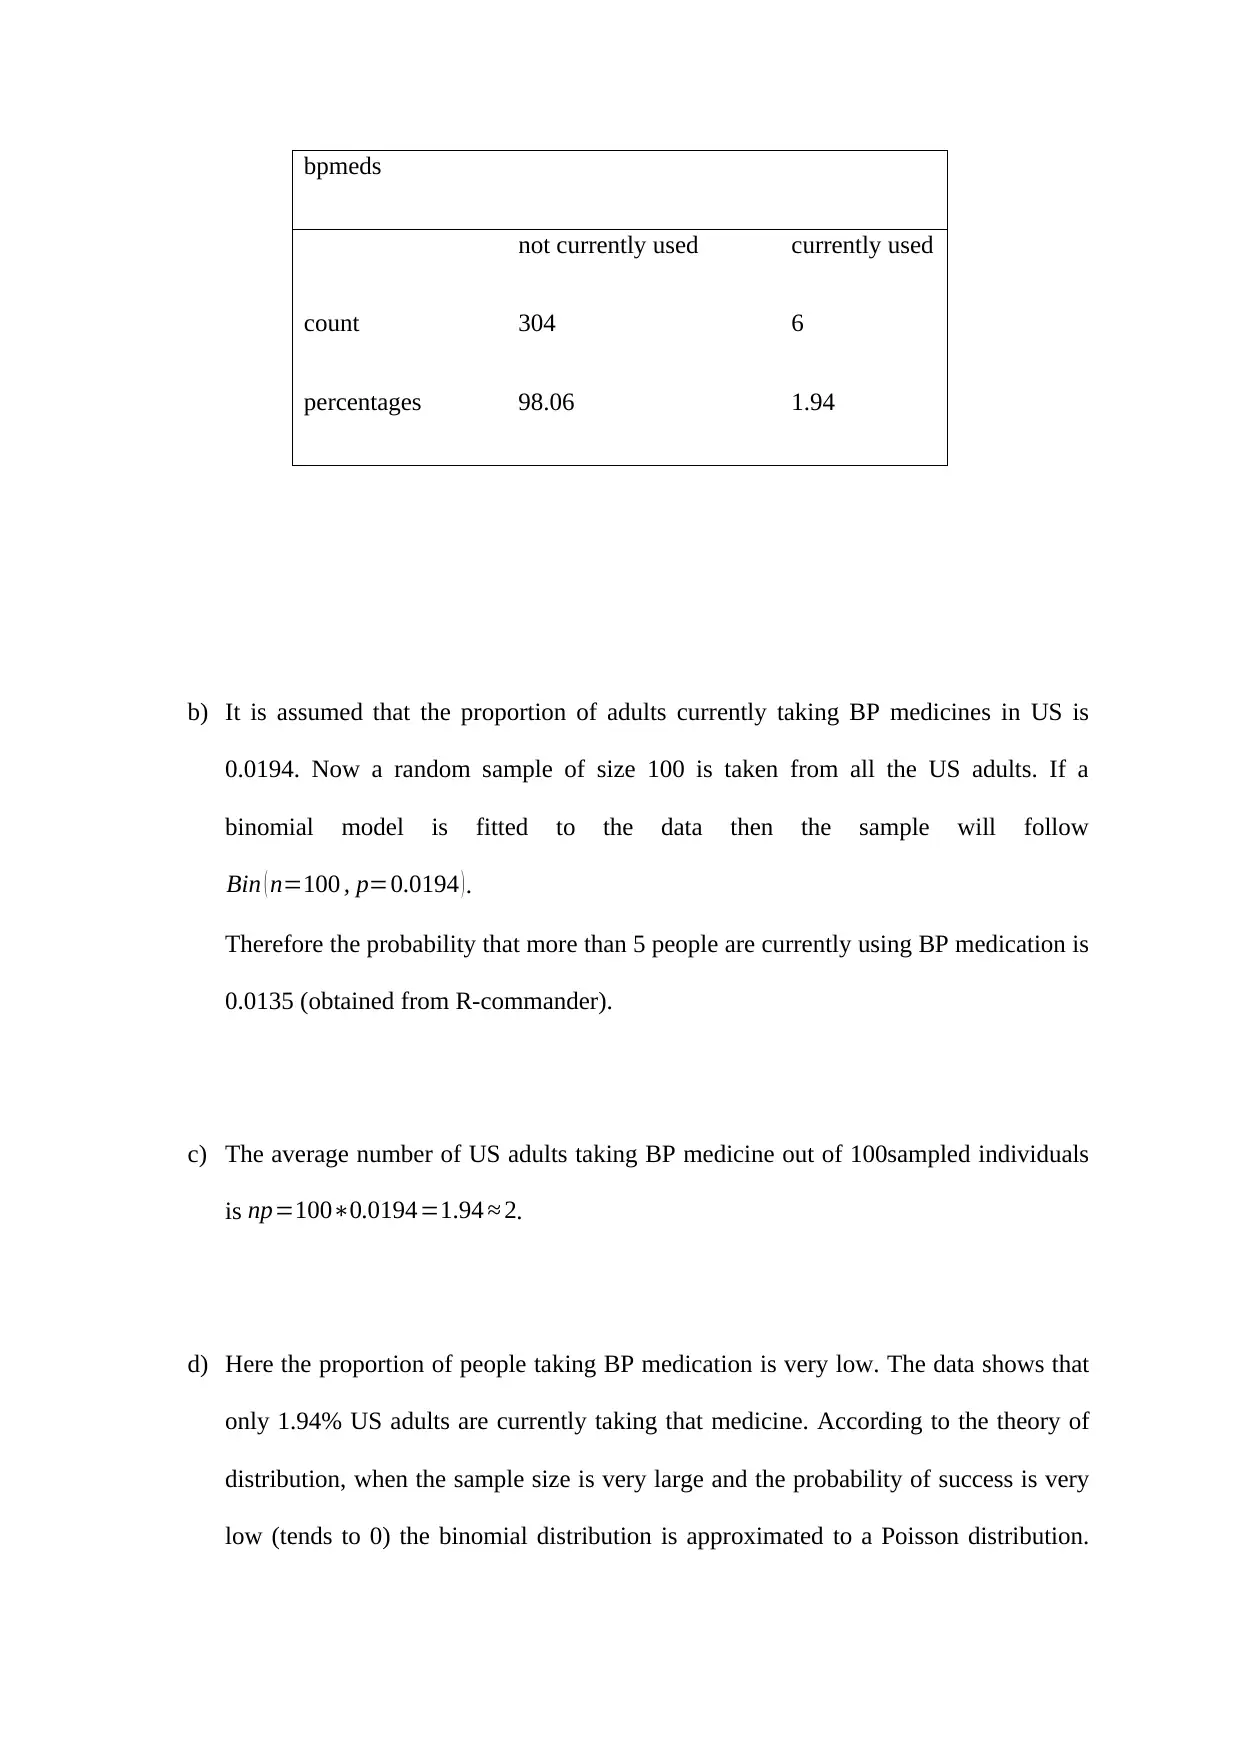
bpmeds
not currently used currently used
count 304 6
percentages 98.06 1.94
b) It is assumed that the proportion of adults currently taking BP medicines in US is
0.0194. Now a random sample of size 100 is taken from all the US adults. If a
binomial model is fitted to the data then the sample will follow
Bin ( n=100 , p=0.0194 ).
Therefore the probability that more than 5 people are currently using BP medication is
0.0135 (obtained from R-commander).
c) The average number of US adults taking BP medicine out of 100sampled individuals
is np=100∗0.0194=1.94 ≈ 2.
d) Here the proportion of people taking BP medication is very low. The data shows that
only 1.94% US adults are currently taking that medicine. According to the theory of
distribution, when the sample size is very large and the probability of success is very
low (tends to 0) the binomial distribution is approximated to a Poisson distribution.
Paraphrase This Document
Need a fresh take? Get an instant paraphrase of this document with our AI Paraphraser
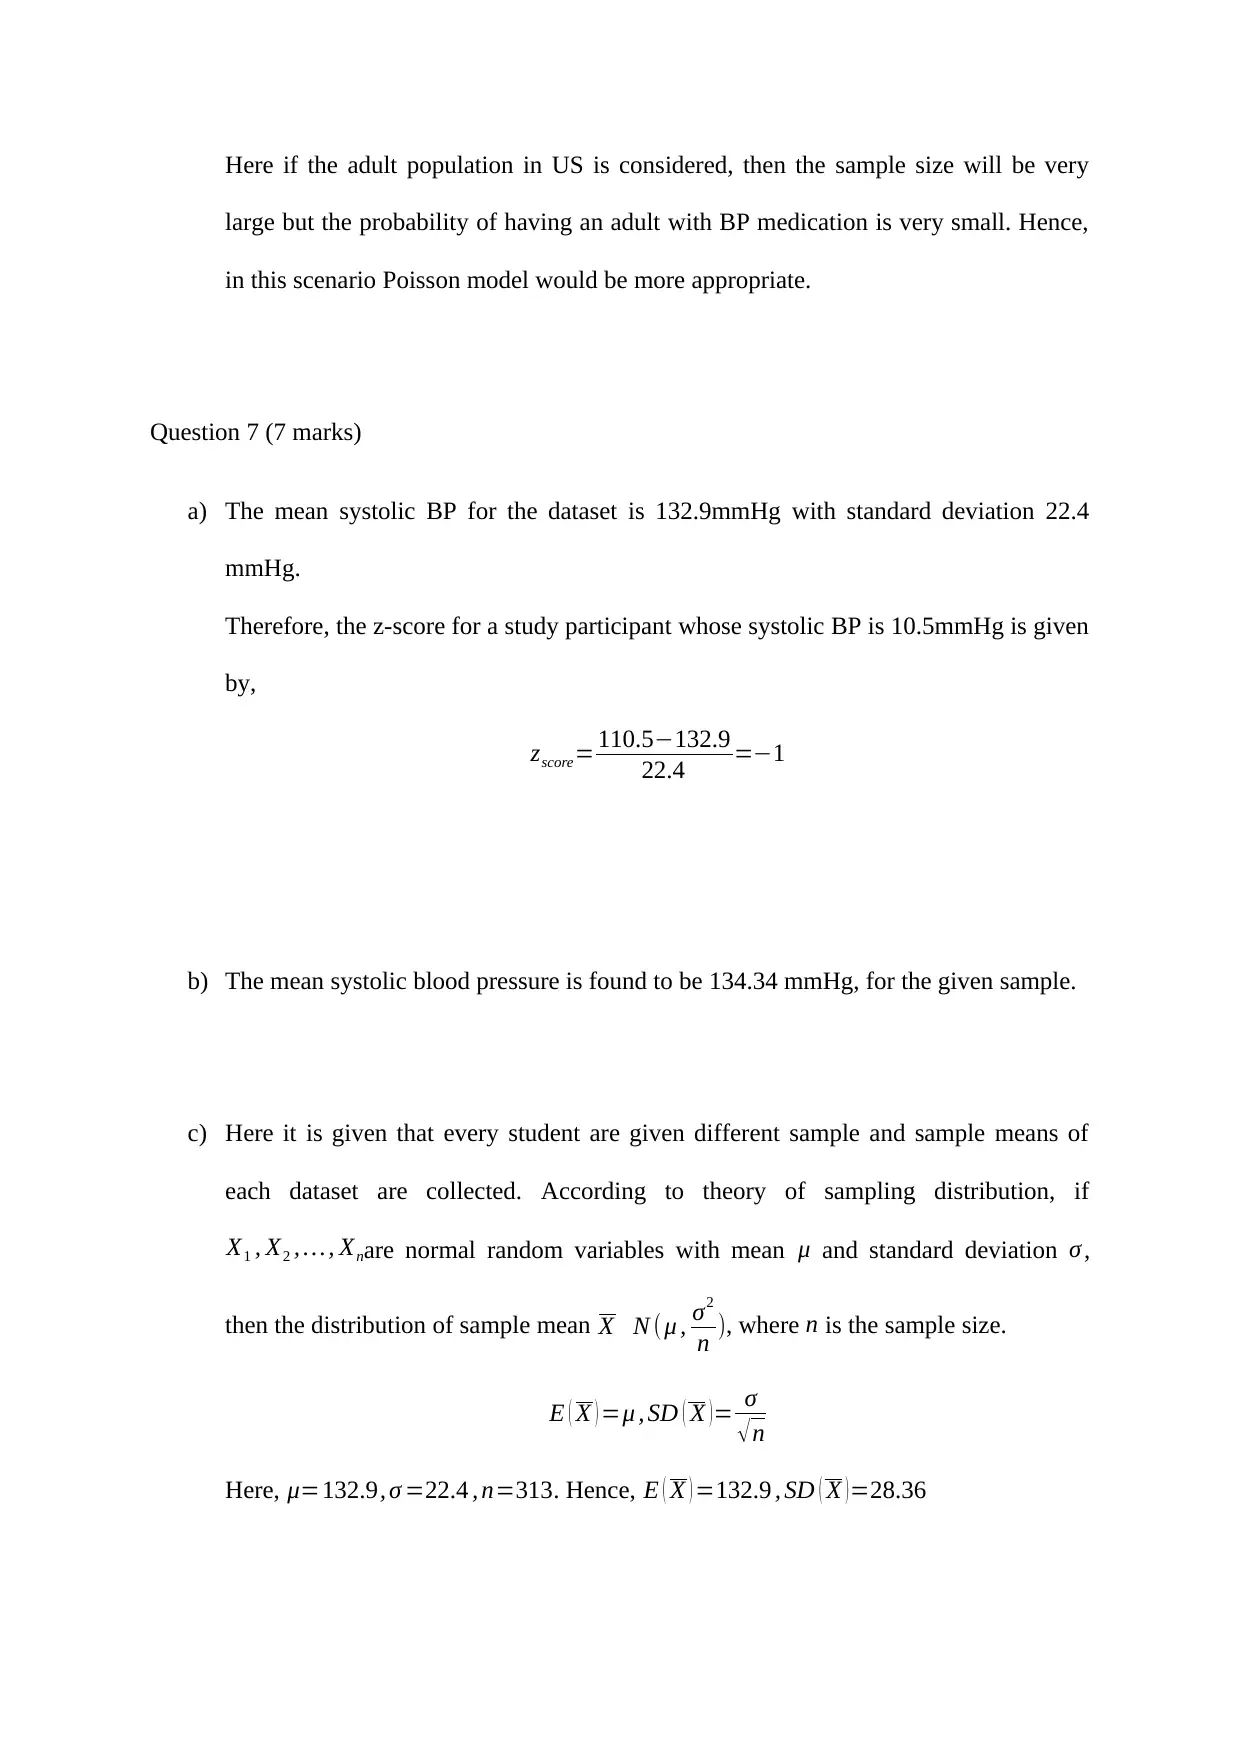
Here if the adult population in US is considered, then the sample size will be very
large but the probability of having an adult with BP medication is very small. Hence,
in this scenario Poisson model would be more appropriate.
Question 7 (7 marks)
a) The mean systolic BP for the dataset is 132.9mmHg with standard deviation 22.4
mmHg.
Therefore, the z-score for a study participant whose systolic BP is 10.5mmHg is given
by,
zscore= 110.5−132.9
22.4 =−1
b) The mean systolic blood pressure is found to be 134.34 mmHg, for the given sample.
c) Here it is given that every student are given different sample and sample means of
each dataset are collected. According to theory of sampling distribution, if
X1 , X2 , … , Xnare normal random variables with mean μ and standard deviation σ ,
then the distribution of sample mean X N ( μ , σ2
n ), where n is the sample size.
E ( X ) =μ , SD ( X )= σ
√n
Here, μ=132.9, σ =22.4 , n=313. Hence, E ( X ) =132.9 , SD ( X )=28.36
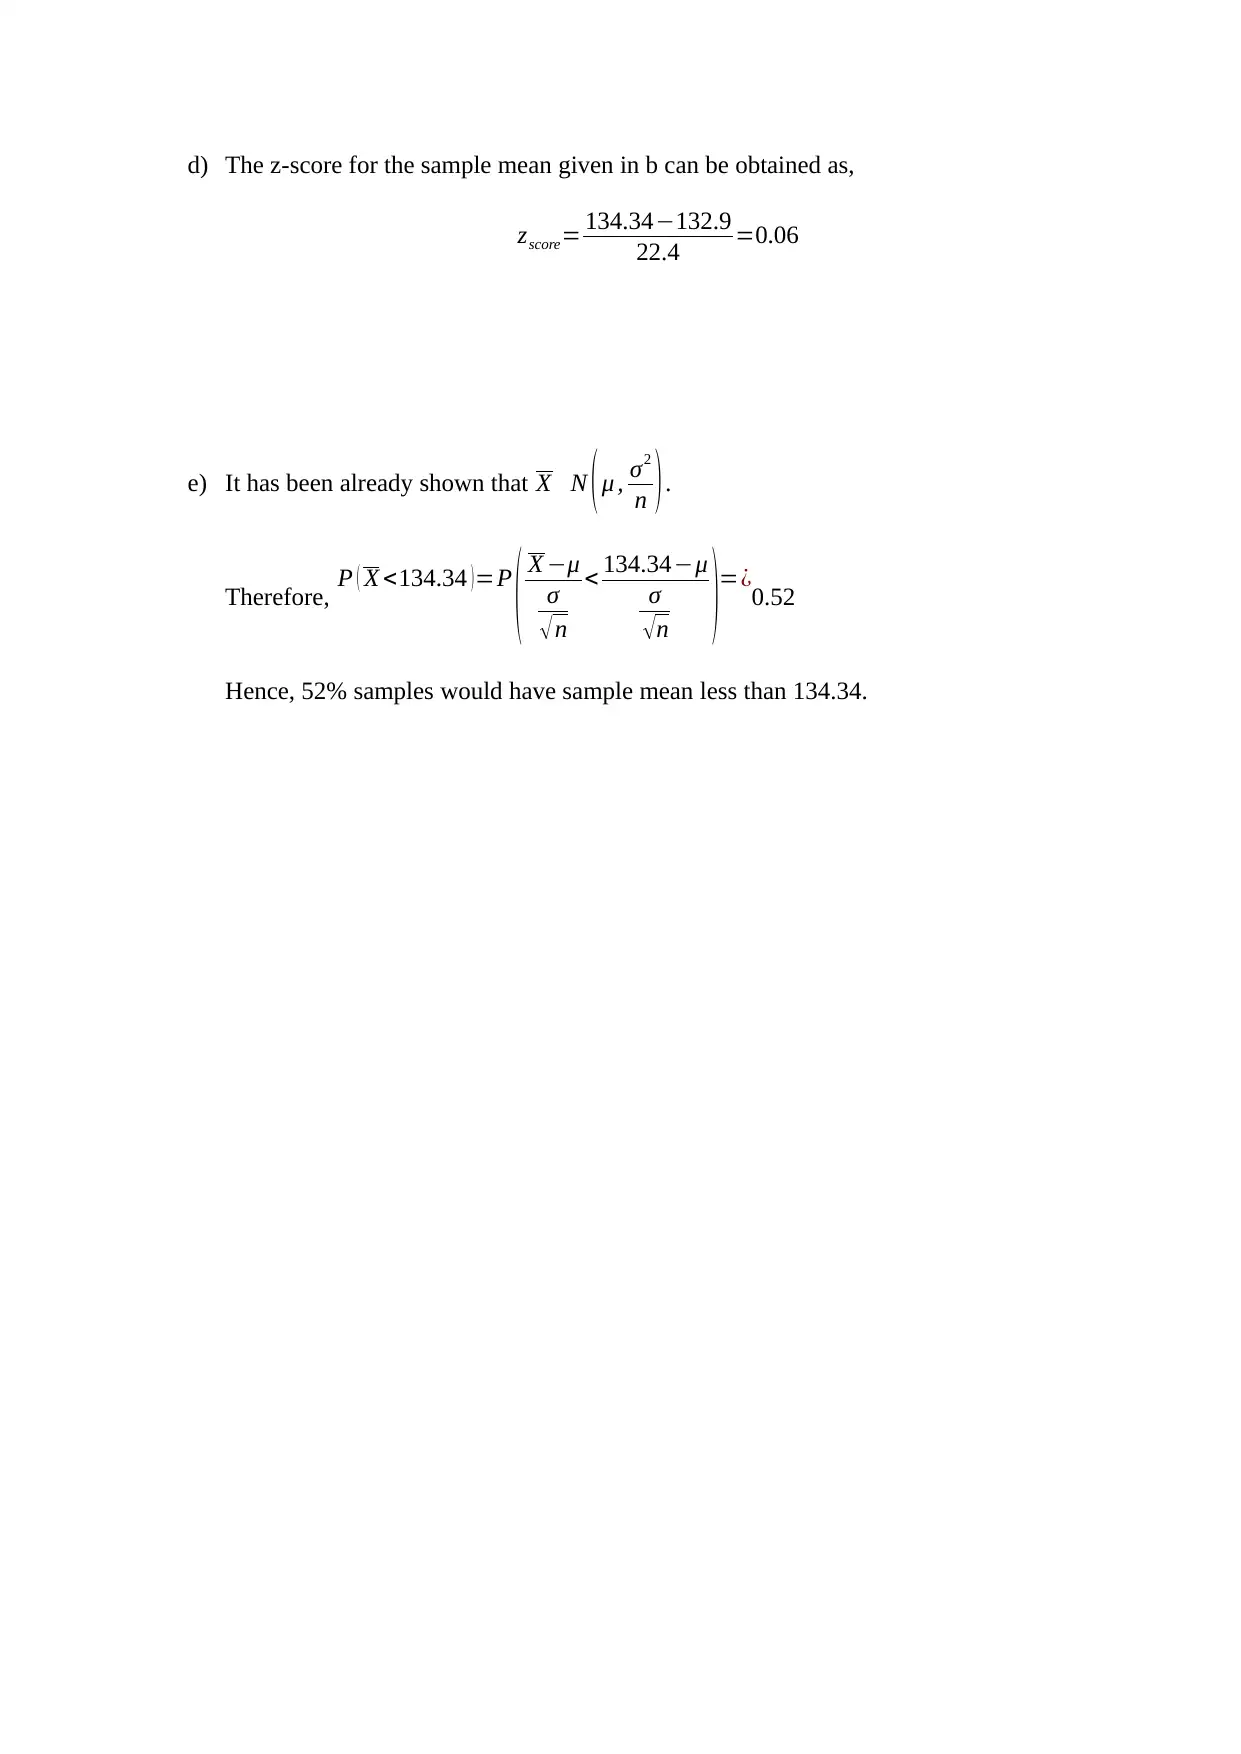
d) The z-score for the sample mean given in b can be obtained as,
zscore= 134.34−132.9
22.4 =0.06
e) It has been already shown that X N (μ , σ2
n ).
Therefore, P ( X <134.34 )=P
( X −μ
σ
√n
< 134.34−μ
σ
√n )=¿0.52
Hence, 52% samples would have sample mean less than 134.34.
zscore= 134.34−132.9
22.4 =0.06
e) It has been already shown that X N (μ , σ2
n ).
Therefore, P ( X <134.34 )=P
( X −μ
σ
√n
< 134.34−μ
σ
√n )=¿0.52
Hence, 52% samples would have sample mean less than 134.34.

Bibliography
Lindgren, B. (2017). Statistical theory. Routledge.
Lindgren, B. (2017). Statistical theory. Routledge.
1 out of 10


Your All-in-One AI-Powered Toolkit for Academic Success.
+13062052269
info@desklib.com
Available 24*7 on WhatsApp / Email
![[object Object]](/_next/static/media/star-bottom.7253800d.svg)
Unlock your academic potential
© 2024 | Zucol Services PVT LTD | All rights reserved.