Introduction to Biostatistics: Assignment 2 Solutions
Added on 2023-06-07
8 Pages1567 Words142 Views
Running head: INTRODUCTION TO BIOSTATISTICS 1
401077 Introduction to Biostatistics, Spring 2018
Assignment 2
Due Sunday September 23, 2018
When submitting your assignment to Turnitin you are implicitly ticking these statements:
I retain a backup file of this assignment in case the original file is lost or damaged.
I hereby certify that no part of this assignment or product has been copied from any
other student’s work or from any other source except where due acknowledgement is
made in the assignment.
I hereby certify that no part of this assignment or product has been submitted by me in
another (previous or current) assessment.
I hereby certify that no part of the assignment has been written or produced by any
person.
I hereby certify that no part of this assignment has been made available to any other
student.
I am aware that this work will be reproduced and submitted to plagiarism detection
software for the purpose of detecting possible plagiarism. This software may retain a
copy of this assignment on its database for future plagiarism detection.
I understand that failure to uphold this declaration may result in academic proceedings
in line with the UWS Student Academic Misconduct Policy.”
Your name: Mary Spandana Pudota
Your student number: 19134332
INTRODUCTION TO BIOSTATISTICS 2
Question 1
a. Point estimate of proportion of females.
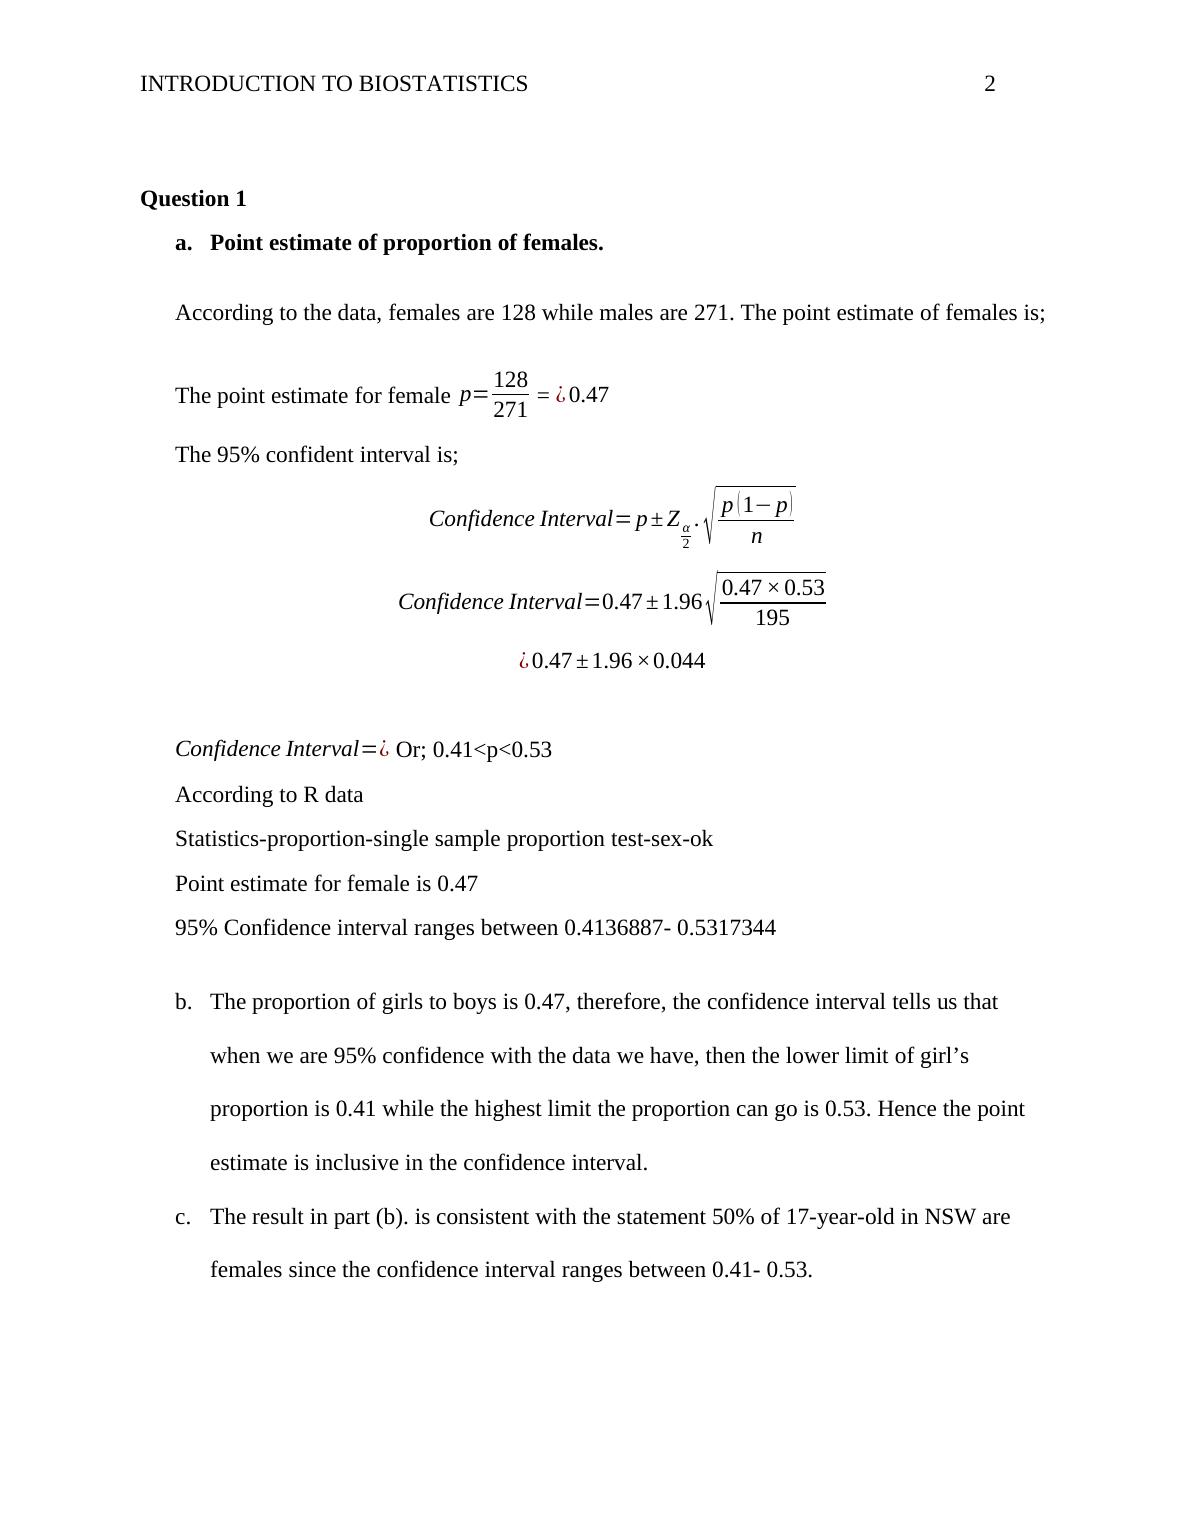
According to the data, females are 128 while males are 271. The point estimate of females is;
The point estimate for female p= 128
271 = ¿ 0.47
The 95% confident interval is;
Confidence Interval= p ± Z α
2
. √ p ( 1−p )
n
Confidence Interval=0.47 ± 1.96 √ 0.47 ×0.53
195
¿ 0.47 ± 1.96 ×0.044
Confidence Interval=¿ Or; 0.41<p<0.53
According to R data
Statistics-proportion-single sample proportion test-sex-ok
Point estimate for female is 0.47
95% Confidence interval ranges between 0.4136887- 0.5317344
b. The proportion of girls to boys is 0.47, therefore, the confidence interval tells us that
when we are 95% confidence with the data we have, then the lower limit of girl’s
proportion is 0.41 while the highest limit the proportion can go is 0.53. Hence the point
estimate is inclusive in the confidence interval.
c. The result in part (b). is consistent with the statement 50% of 17-year-old in NSW are
females since the confidence interval ranges between 0.41- 0.53.
Question 1
a. Point estimate of proportion of females.
According to the data, females are 128 while males are 271. The point estimate of females is;
The point estimate for female p= 128
271 = ¿ 0.47
The 95% confident interval is;
Confidence Interval= p ± Z α
2
. √ p ( 1−p )
n
Confidence Interval=0.47 ± 1.96 √ 0.47 ×0.53
195
¿ 0.47 ± 1.96 ×0.044
Confidence Interval=¿ Or; 0.41<p<0.53
According to R data
Statistics-proportion-single sample proportion test-sex-ok
Point estimate for female is 0.47
95% Confidence interval ranges between 0.4136887- 0.5317344
b. The proportion of girls to boys is 0.47, therefore, the confidence interval tells us that
when we are 95% confidence with the data we have, then the lower limit of girl’s
proportion is 0.41 while the highest limit the proportion can go is 0.53. Hence the point
estimate is inclusive in the confidence interval.
c. The result in part (b). is consistent with the statement 50% of 17-year-old in NSW are
females since the confidence interval ranges between 0.41- 0.53.
INTRODUCTION TO BIOSTATISTICS 3
Question 2
a.
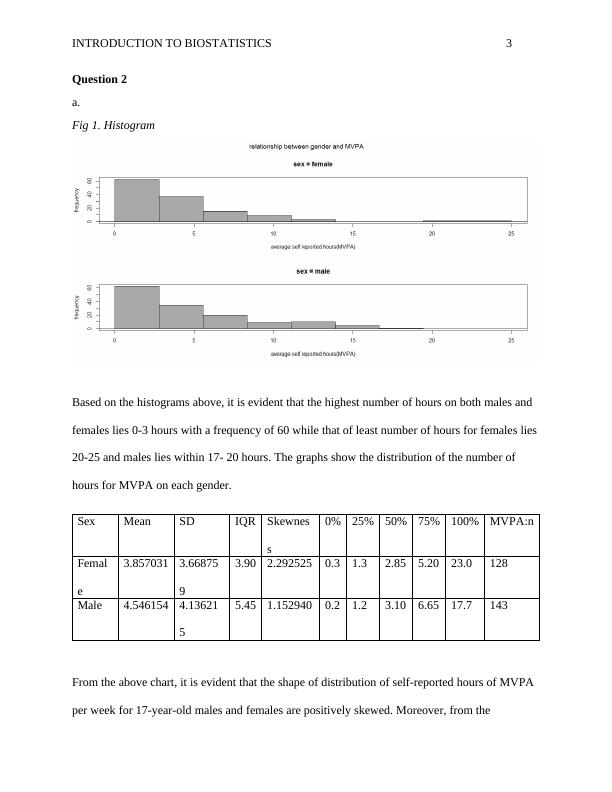
Fig 1. Histogram
Based on the histograms above, it is evident that the highest number of hours on both males and
females lies 0-3 hours with a frequency of 60 while that of least number of hours for females lies
20-25 and males lies within 17- 20 hours. The graphs show the distribution of the number of
hours for MVPA on each gender.
Sex Mean SD IQR Skewness 0% 25% 50% 75% 100% MVPA:n
Femal
e
3.857031 3.66875
9
3.90 2.292525 0.3 1.3 2.85 5.20 23.0 128
Male 4.546154 4.13621
5
5.45 1.152940 0.2 1.2 3.10 6.65 17.7 143
Question 2
a.
Fig 1. Histogram
Based on the histograms above, it is evident that the highest number of hours on both males and
females lies 0-3 hours with a frequency of 60 while that of least number of hours for females lies
20-25 and males lies within 17- 20 hours. The graphs show the distribution of the number of
hours for MVPA on each gender.
Sex Mean SD IQR Skewness 0% 25% 50% 75% 100% MVPA:n
Femal
e
3.857031 3.66875
9
3.90 2.292525 0.3 1.3 2.85 5.20 23.0 128
Male 4.546154 4.13621
5
5.45 1.152940 0.2 1.2 3.10 6.65 17.7 143
End of preview
Want to access all the pages? Upload your documents or become a member.
Related Documents
Introduction to Biostatistics Assignment 2lg...
|8
|1657
|72
Biostatistics Assignment 2lg...
|5
|1110
|356
Biostatistics Assignment 1lg...
|5
|1172
|298
Biostatistics Assignment 2 - University of Eastern Sydneylg...
|10
|1347
|475
Introduction to Biostatisticslg...
|11
|1728
|489
Biostatistics Assignment 2 Solutions - Deskliblg...
|6
|860
|423