Mathematics for Construction
VerifiedAdded on 2023/01/07
|29
|3460
|69
AI Summary
This document provides solutions for various mathematical problems related to construction. It includes histograms, mode calculations, cumulative frequency curves, mean, range, and standard deviation calculations. It also covers hypothesis testing and wave displacement calculations.
Contribute Materials
Your contribution can guide someone’s learning journey. Share your
documents today.

8 Mathematics for Construction
Secure Best Marks with AI Grader
Need help grading? Try our AI Grader for instant feedback on your assignments.

TASK 2
Scenario 1
Revenue
(Class Interval)
Number of customers
(£1000)
January July
0 – 5 27 22
5 – 10 38 39
10 – 15 40 69
15 – 20 22 41
20 – 30 13 20
30 – 40 4 5
Solution
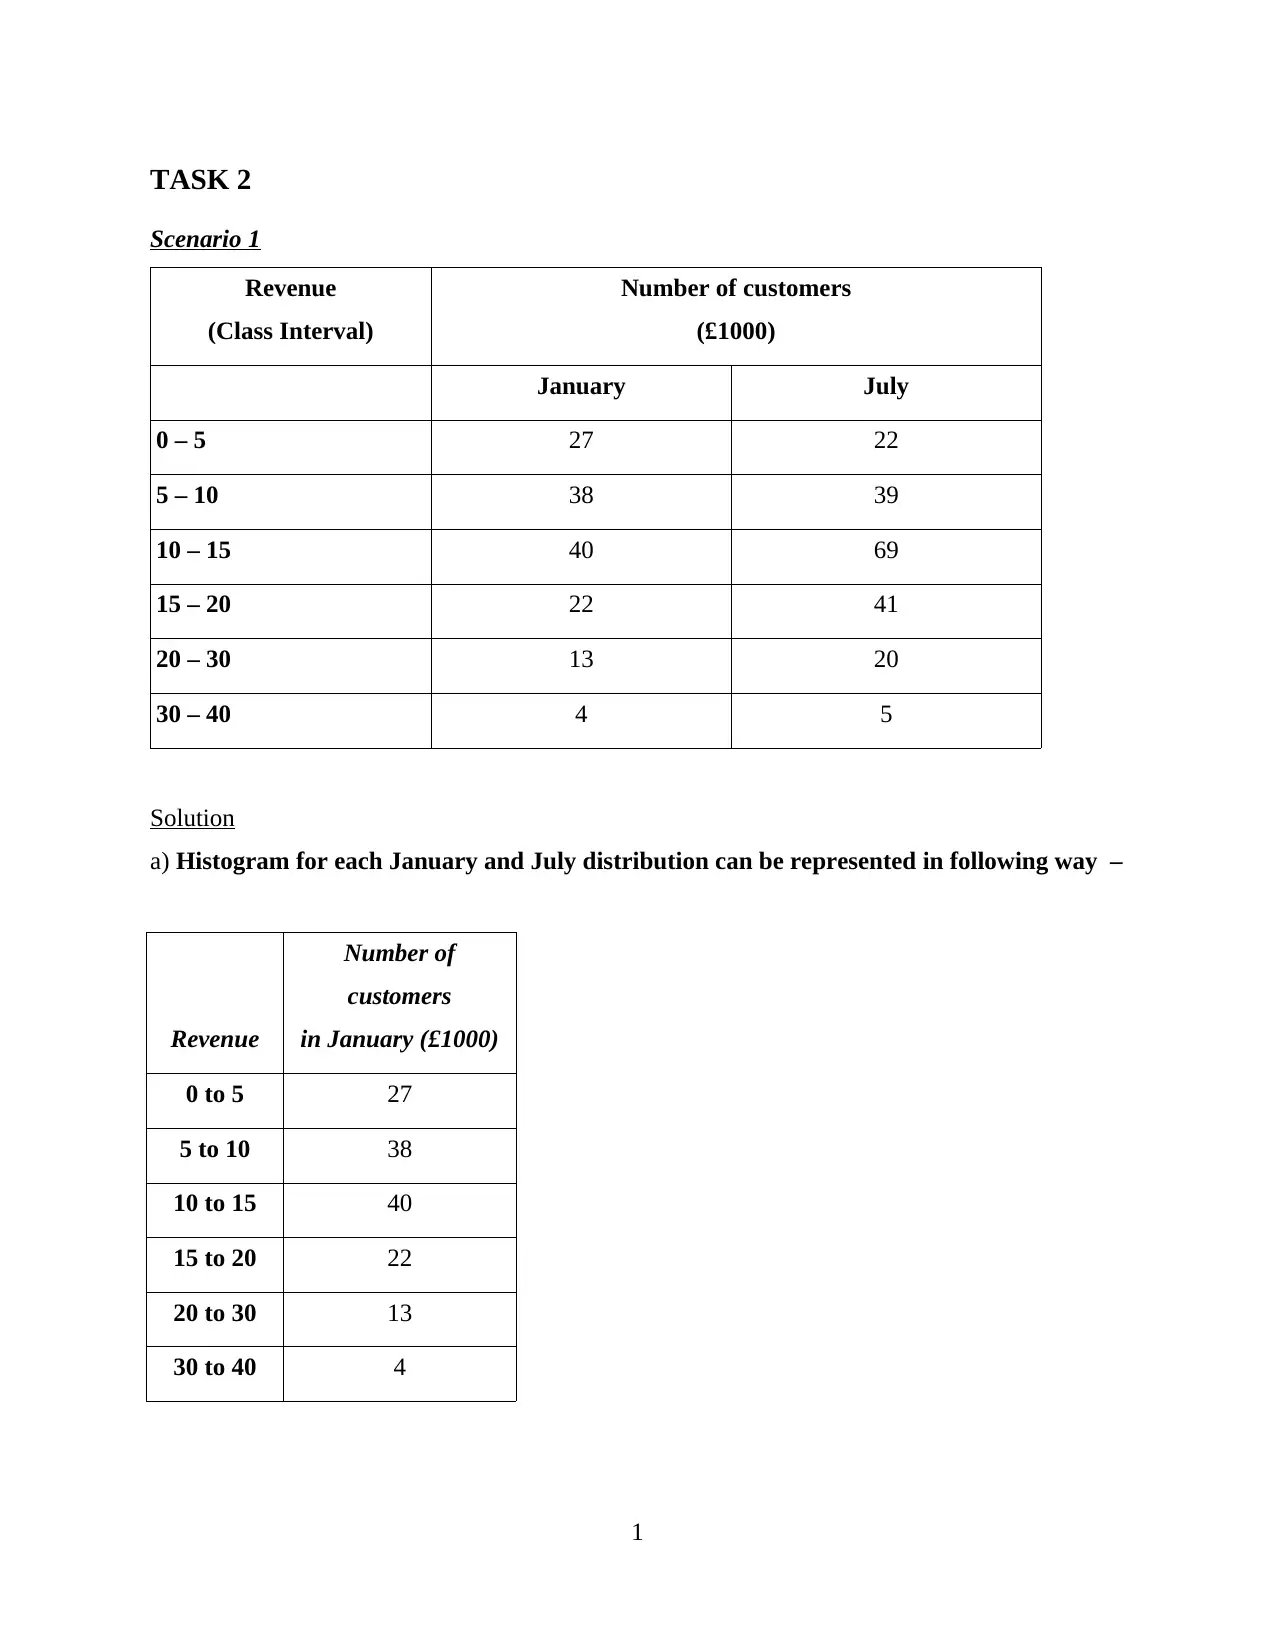
a) Histogram for each January and July distribution can be represented in following way –
Revenue
Number of
customers
in January (£1000)
0 to 5 27
5 to 10 38
10 to 15 40
15 to 20 22
20 to 30 13
30 to 40 4
1
Scenario 1
Revenue
(Class Interval)
Number of customers
(£1000)
January July
0 – 5 27 22
5 – 10 38 39
10 – 15 40 69
15 – 20 22 41
20 – 30 13 20
30 – 40 4 5
Solution
a) Histogram for each January and July distribution can be represented in following way –
Revenue
Number of
customers
in January (£1000)
0 to 5 27
5 to 10 38
10 to 15 40
15 to 20 22
20 to 30 13
30 to 40 4
1
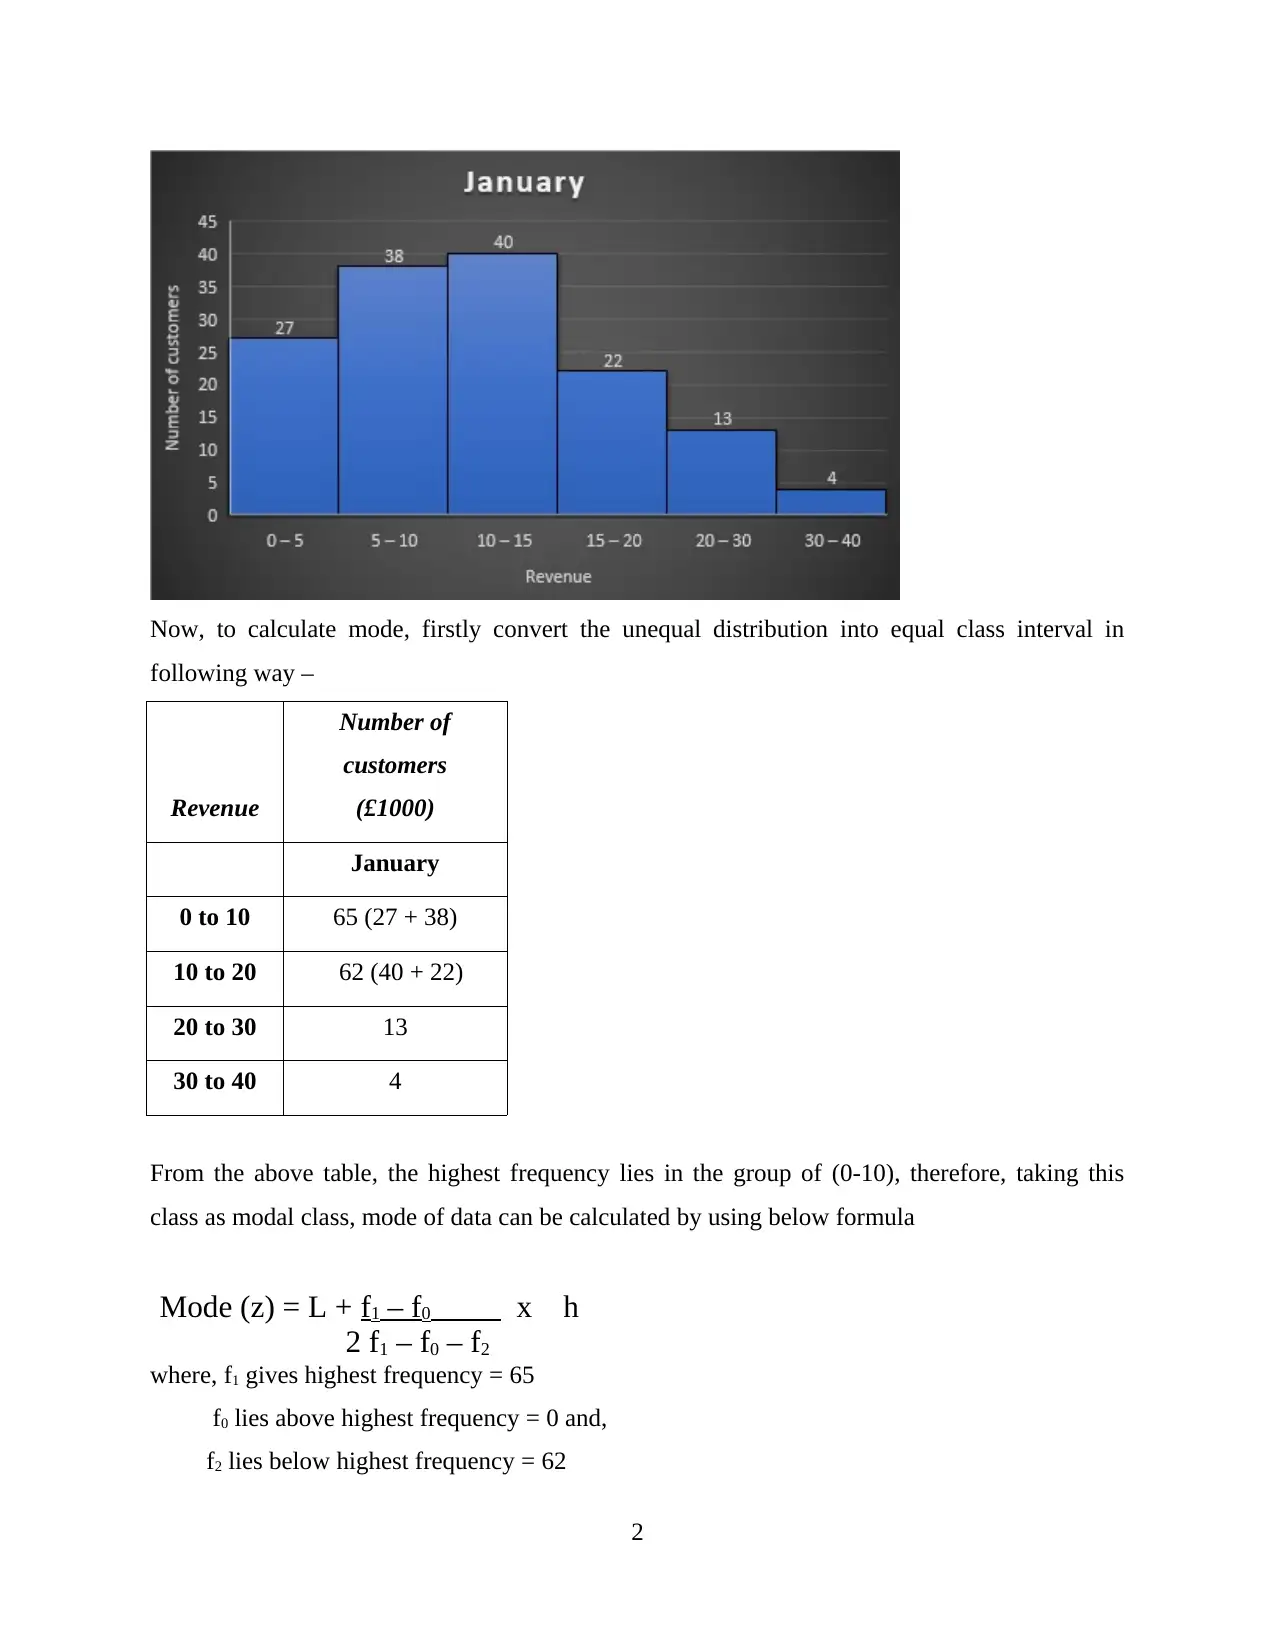
Now, to calculate mode, firstly convert the unequal distribution into equal class interval in
following way –
Revenue
Number of
customers
(£1000)
January
0 to 10 65 (27 + 38)
10 to 20 62 (40 + 22)
20 to 30 13
30 to 40 4
From the above table, the highest frequency lies in the group of (0-10), therefore, taking this
class as modal class, mode of data can be calculated by using below formula
Mode (z) = L + f1 – f0 x h
2 f1 – f0 – f2
where, f1 gives highest frequency = 65
f0 lies above highest frequency = 0 and,
f2 lies below highest frequency = 62
2
Secure Best Marks with AI Grader
Need help grading? Try our AI Grader for instant feedback on your assignments.
h represents difference of class interval = 10 while,
L is the lower interval of modal class = 0,
Therefore, using these values, mode can be calculated as -
Mode (z) = 0 + 65 – 0 x 10
2 x 65 – 0 – 62
= 0 + 65 x 10
130 – 62
≈ 9.54
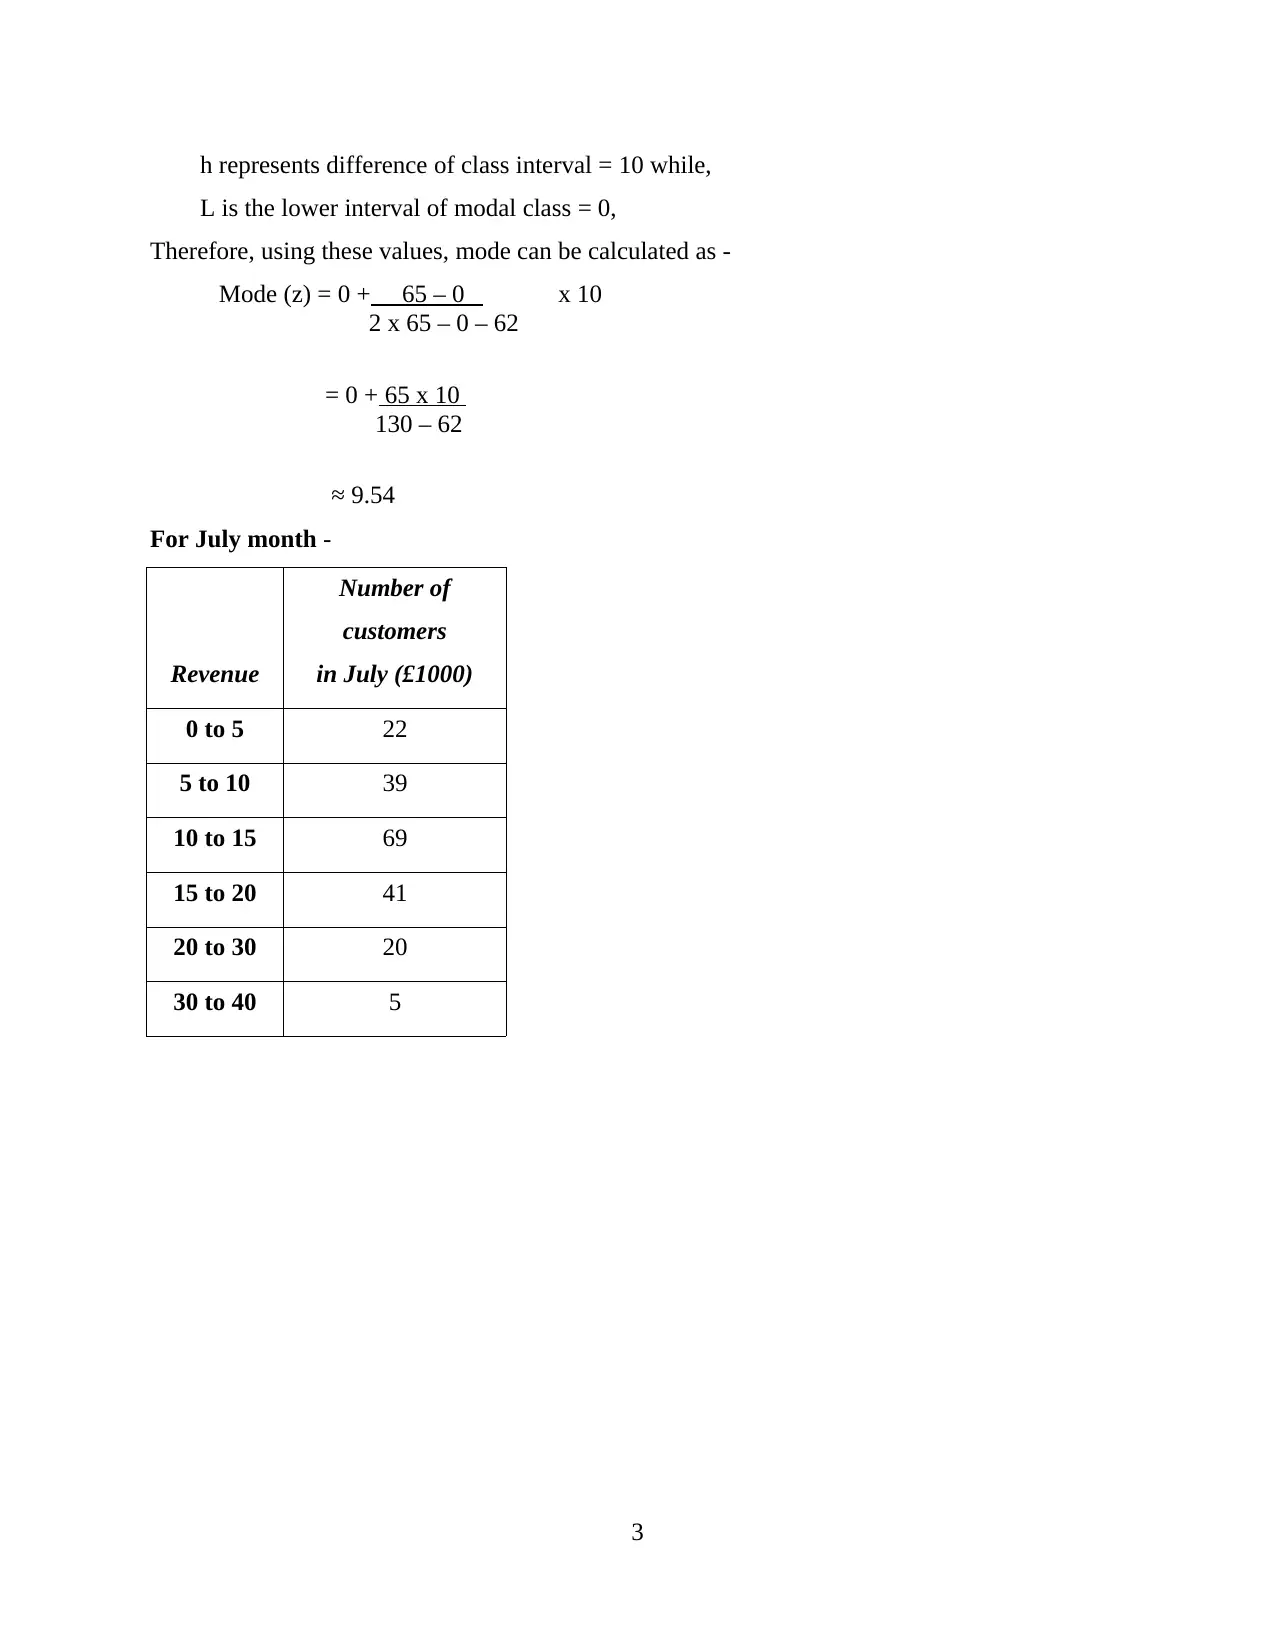
For July month -
Revenue
Number of
customers
in July (£1000)
0 to 5 22
5 to 10 39
10 to 15 69
15 to 20 41
20 to 30 20
30 to 40 5
3
L is the lower interval of modal class = 0,
Therefore, using these values, mode can be calculated as -
Mode (z) = 0 + 65 – 0 x 10
2 x 65 – 0 – 62
= 0 + 65 x 10
130 – 62
≈ 9.54
For July month -
Revenue
Number of
customers
in July (£1000)
0 to 5 22
5 to 10 39
10 to 15 69
15 to 20 41
20 to 30 20
30 to 40 5
3
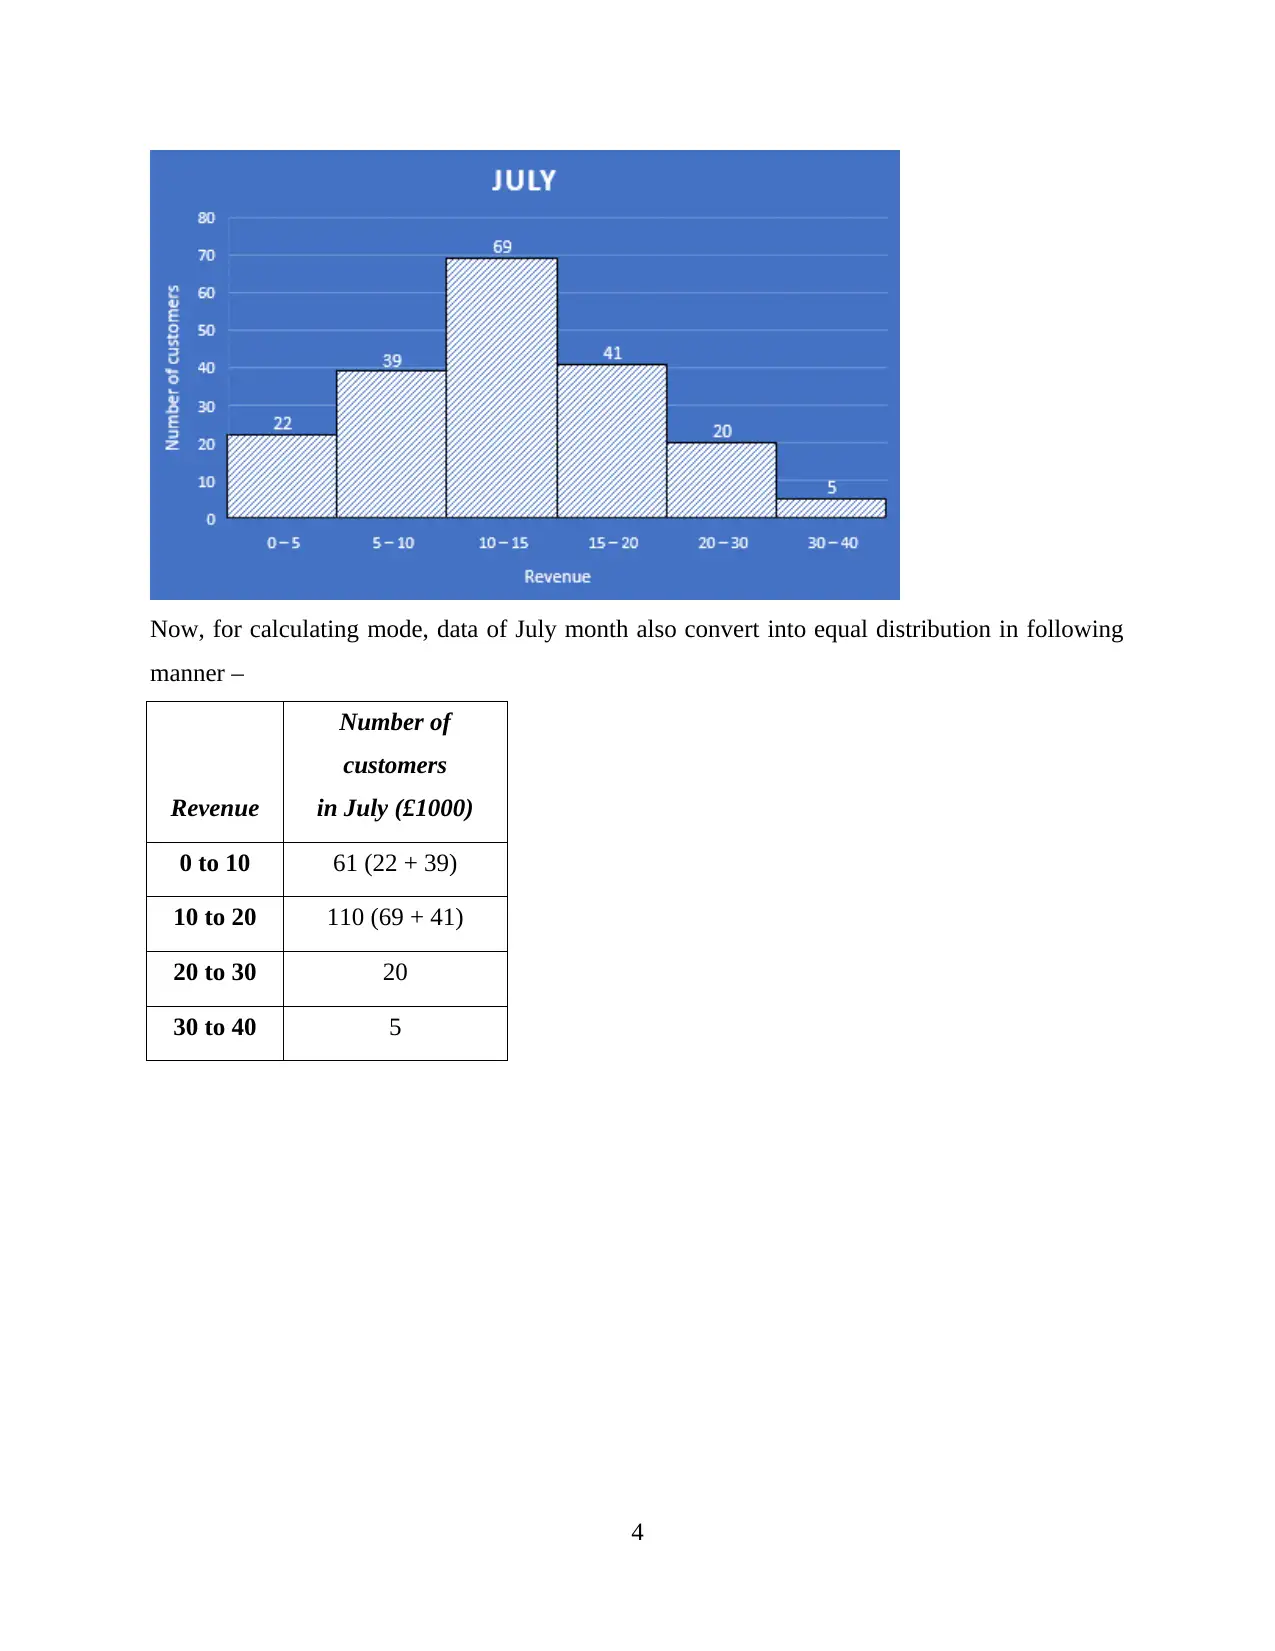
Now, for calculating mode, data of July month also convert into equal distribution in following
manner –
Revenue
Number of
customers
in July (£1000)
0 to 10 61 (22 + 39)
10 to 20 110 (69 + 41)
20 to 30 20
30 to 40 5
4
manner –
Revenue
Number of
customers
in July (£1000)
0 to 10 61 (22 + 39)
10 to 20 110 (69 + 41)
20 to 30 20
30 to 40 5
4
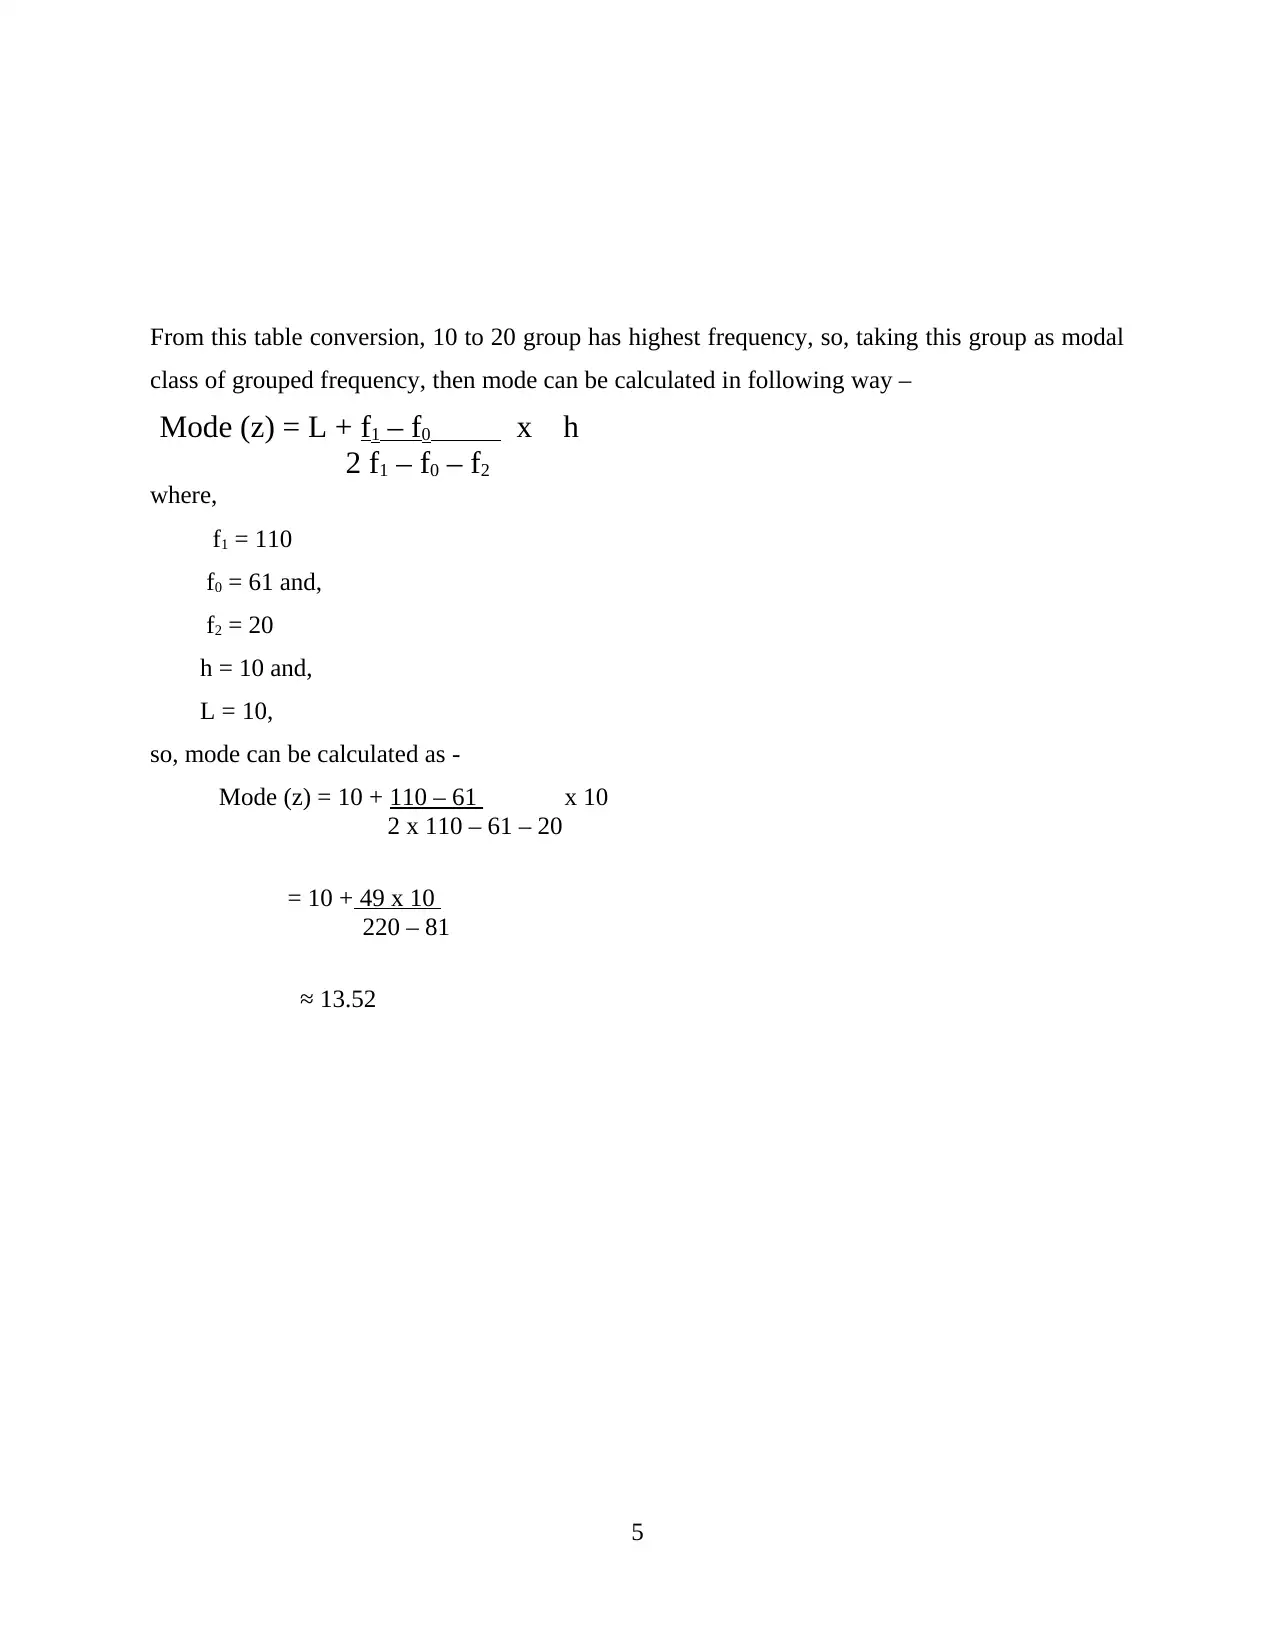
From this table conversion, 10 to 20 group has highest frequency, so, taking this group as modal
class of grouped frequency, then mode can be calculated in following way –
Mode (z) = L + f1 – f0 x h
2 f1 – f0 – f2
where,
f1 = 110
f0 = 61 and,
f2 = 20
h = 10 and,
L = 10,
so, mode can be calculated as -
Mode (z) = 10 + 110 – 61 x 10
2 x 110 – 61 – 20
= 10 + 49 x 10
220 – 81
≈ 13.52
5
class of grouped frequency, then mode can be calculated in following way –
Mode (z) = L + f1 – f0 x h
2 f1 – f0 – f2
where,
f1 = 110
f0 = 61 and,
f2 = 20
h = 10 and,
L = 10,
so, mode can be calculated as -
Mode (z) = 10 + 110 – 61 x 10
2 x 110 – 61 – 20
= 10 + 49 x 10
220 – 81
≈ 13.52
5
Paraphrase This Document
Need a fresh take? Get an instant paraphrase of this document with our AI Paraphraser
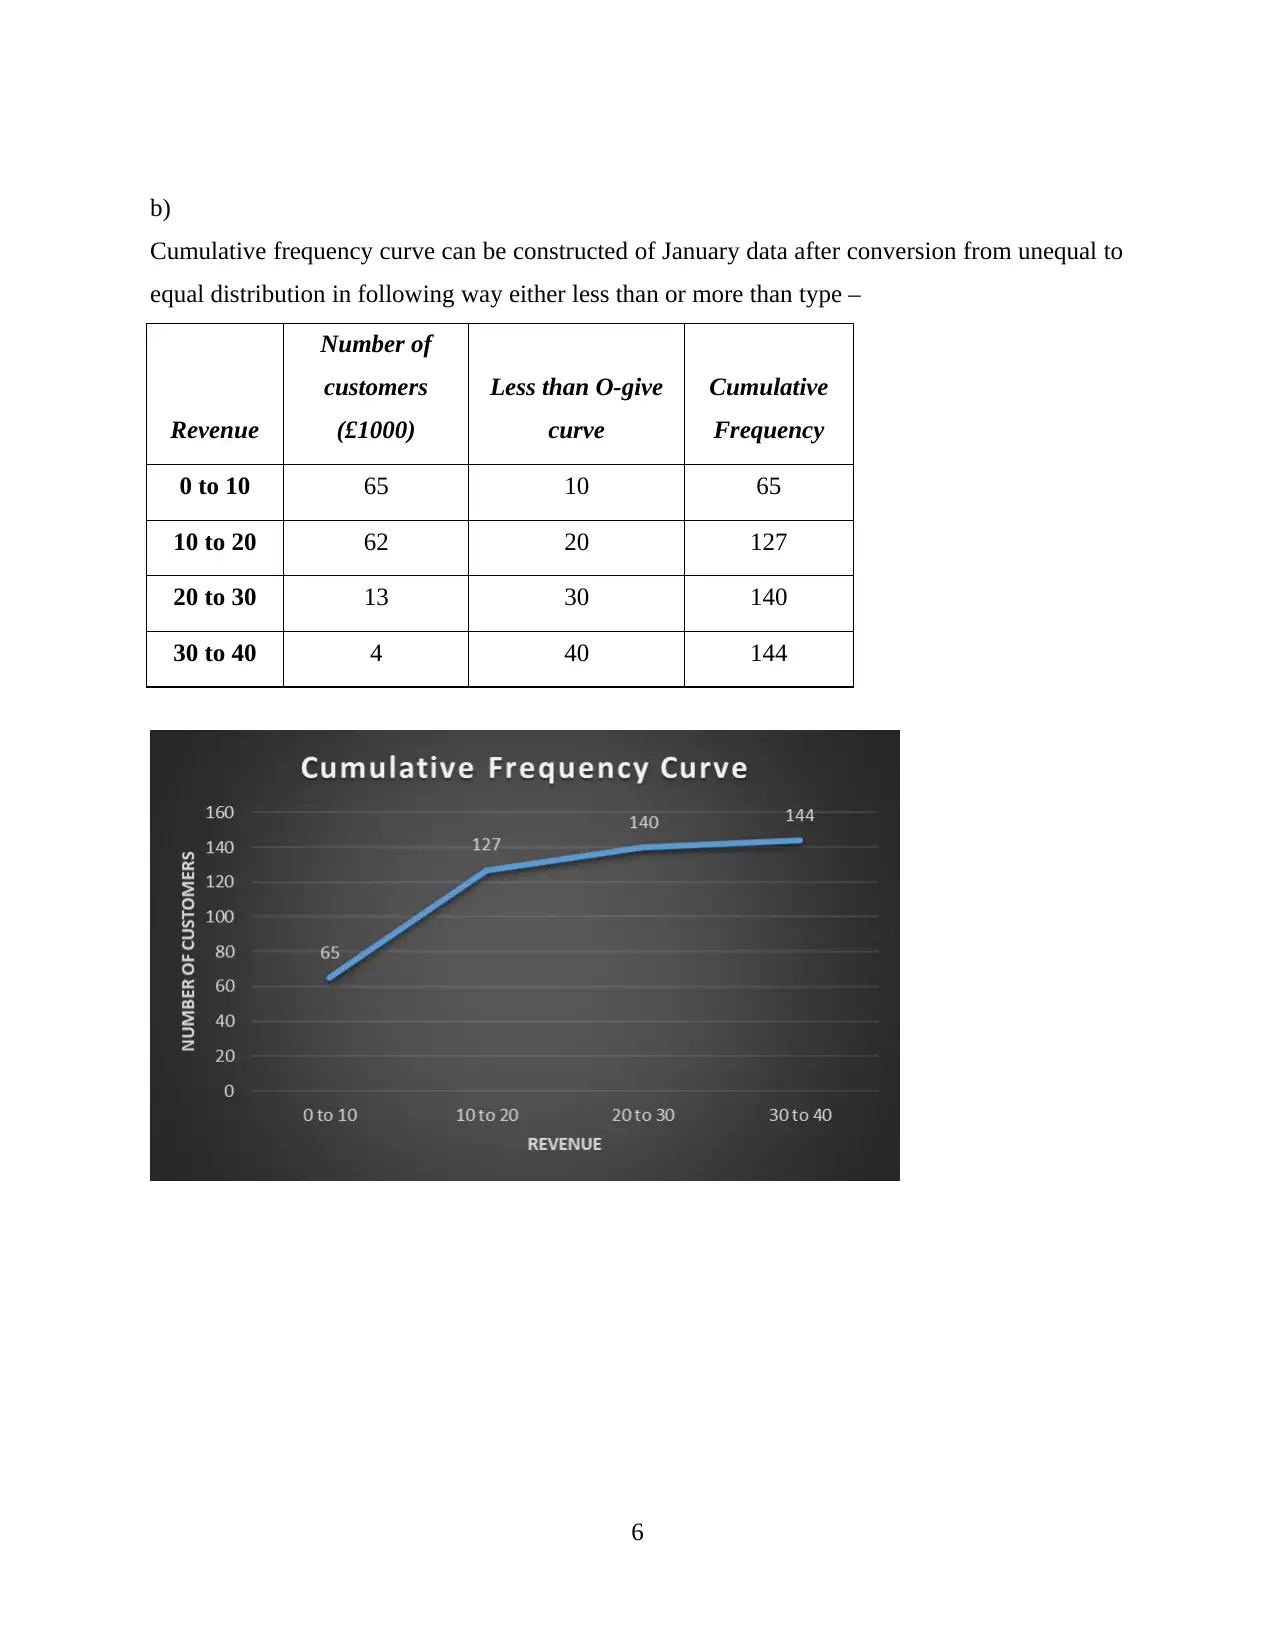
b)
Cumulative frequency curve can be constructed of January data after conversion from unequal to
equal distribution in following way either less than or more than type –
Revenue
Number of
customers
(£1000)
Less than O-give
curve
Cumulative
Frequency
0 to 10 65 10 65
10 to 20 62 20 127
20 to 30 13 30 140
30 to 40 4 40 144
6
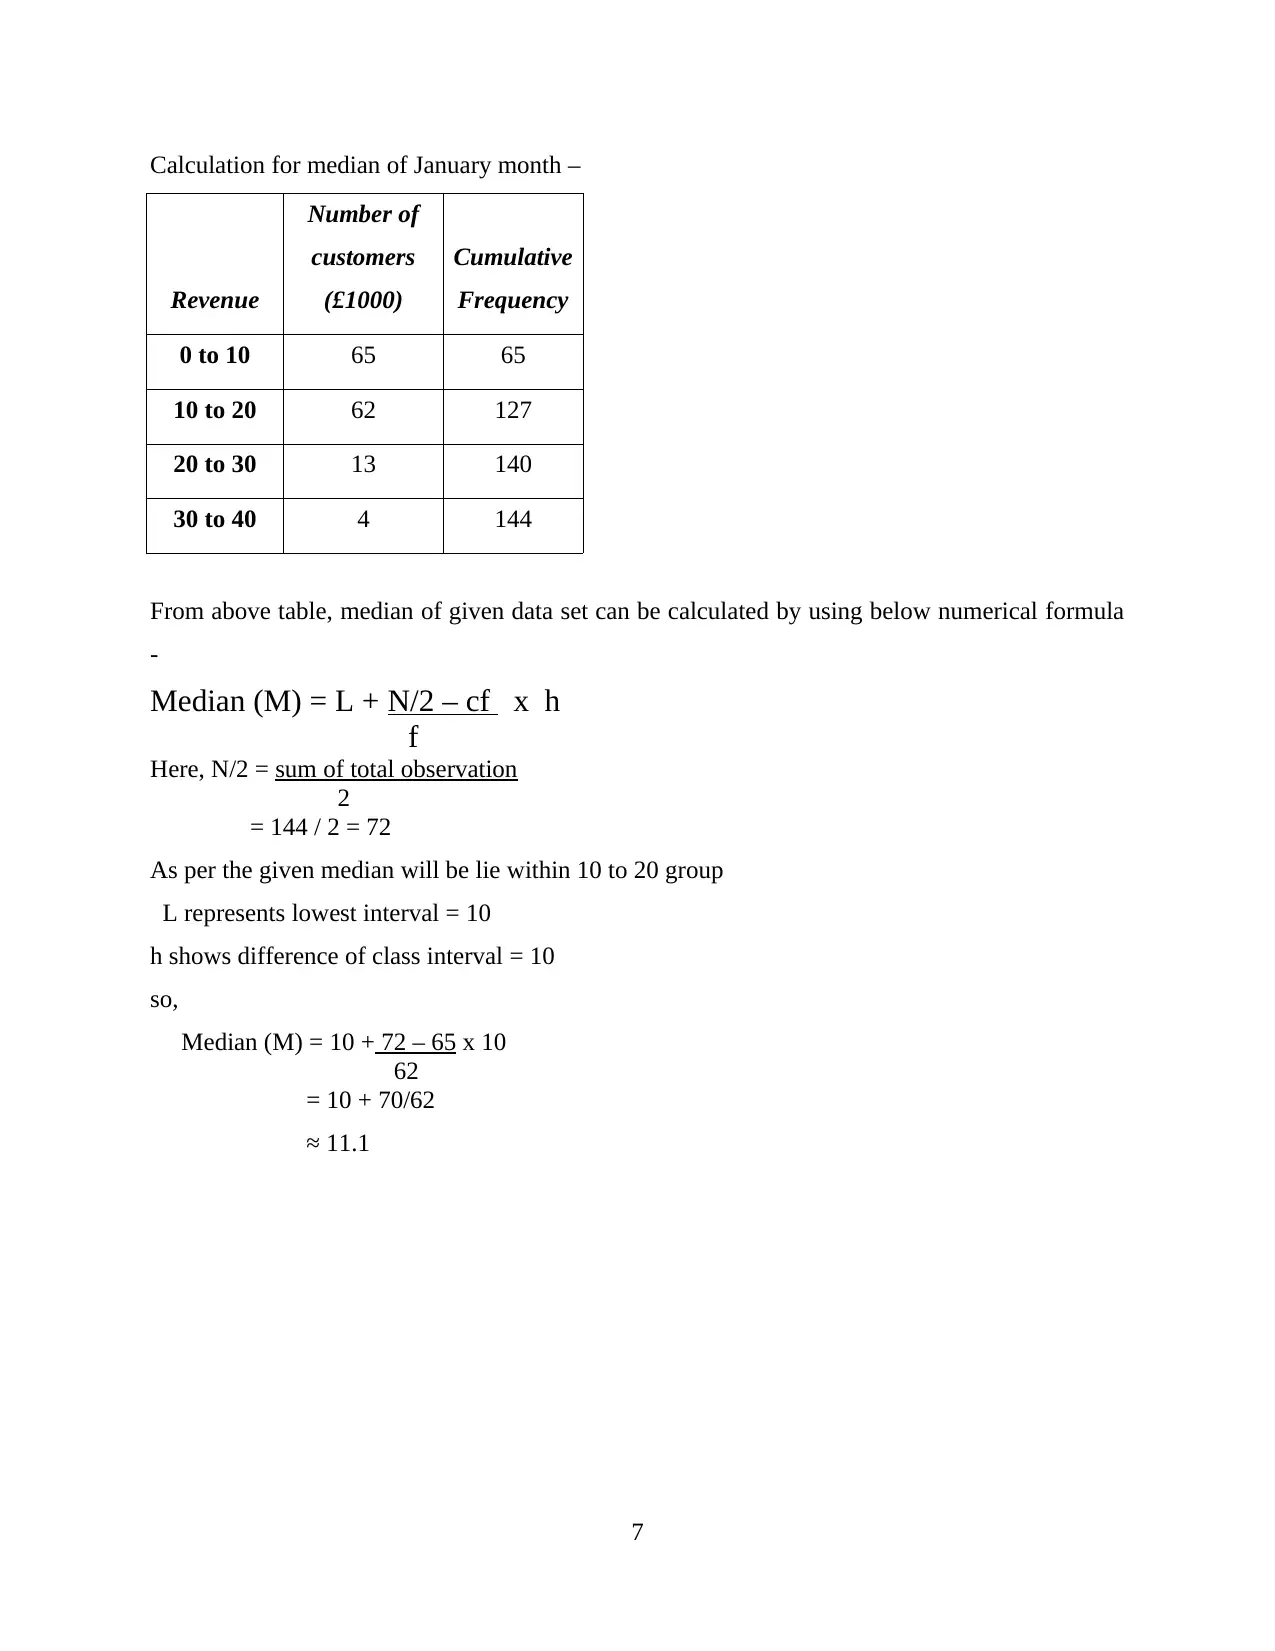
Calculation for median of January month –
Revenue
Number of
customers
(£1000)
Cumulative
Frequency
0 to 10 65 65
10 to 20 62 127
20 to 30 13 140
30 to 40 4 144
From above table, median of given data set can be calculated by using below numerical formula
-
Median (M) = L + N/2 – cf x h
f
Here, N/2 = sum of total observation
2
= 144 / 2 = 72
As per the given median will be lie within 10 to 20 group
L represents lowest interval = 10
h shows difference of class interval = 10
so,
Median (M) = 10 + 72 – 65 x 10
62
= 10 + 70/62
≈ 11.1
7
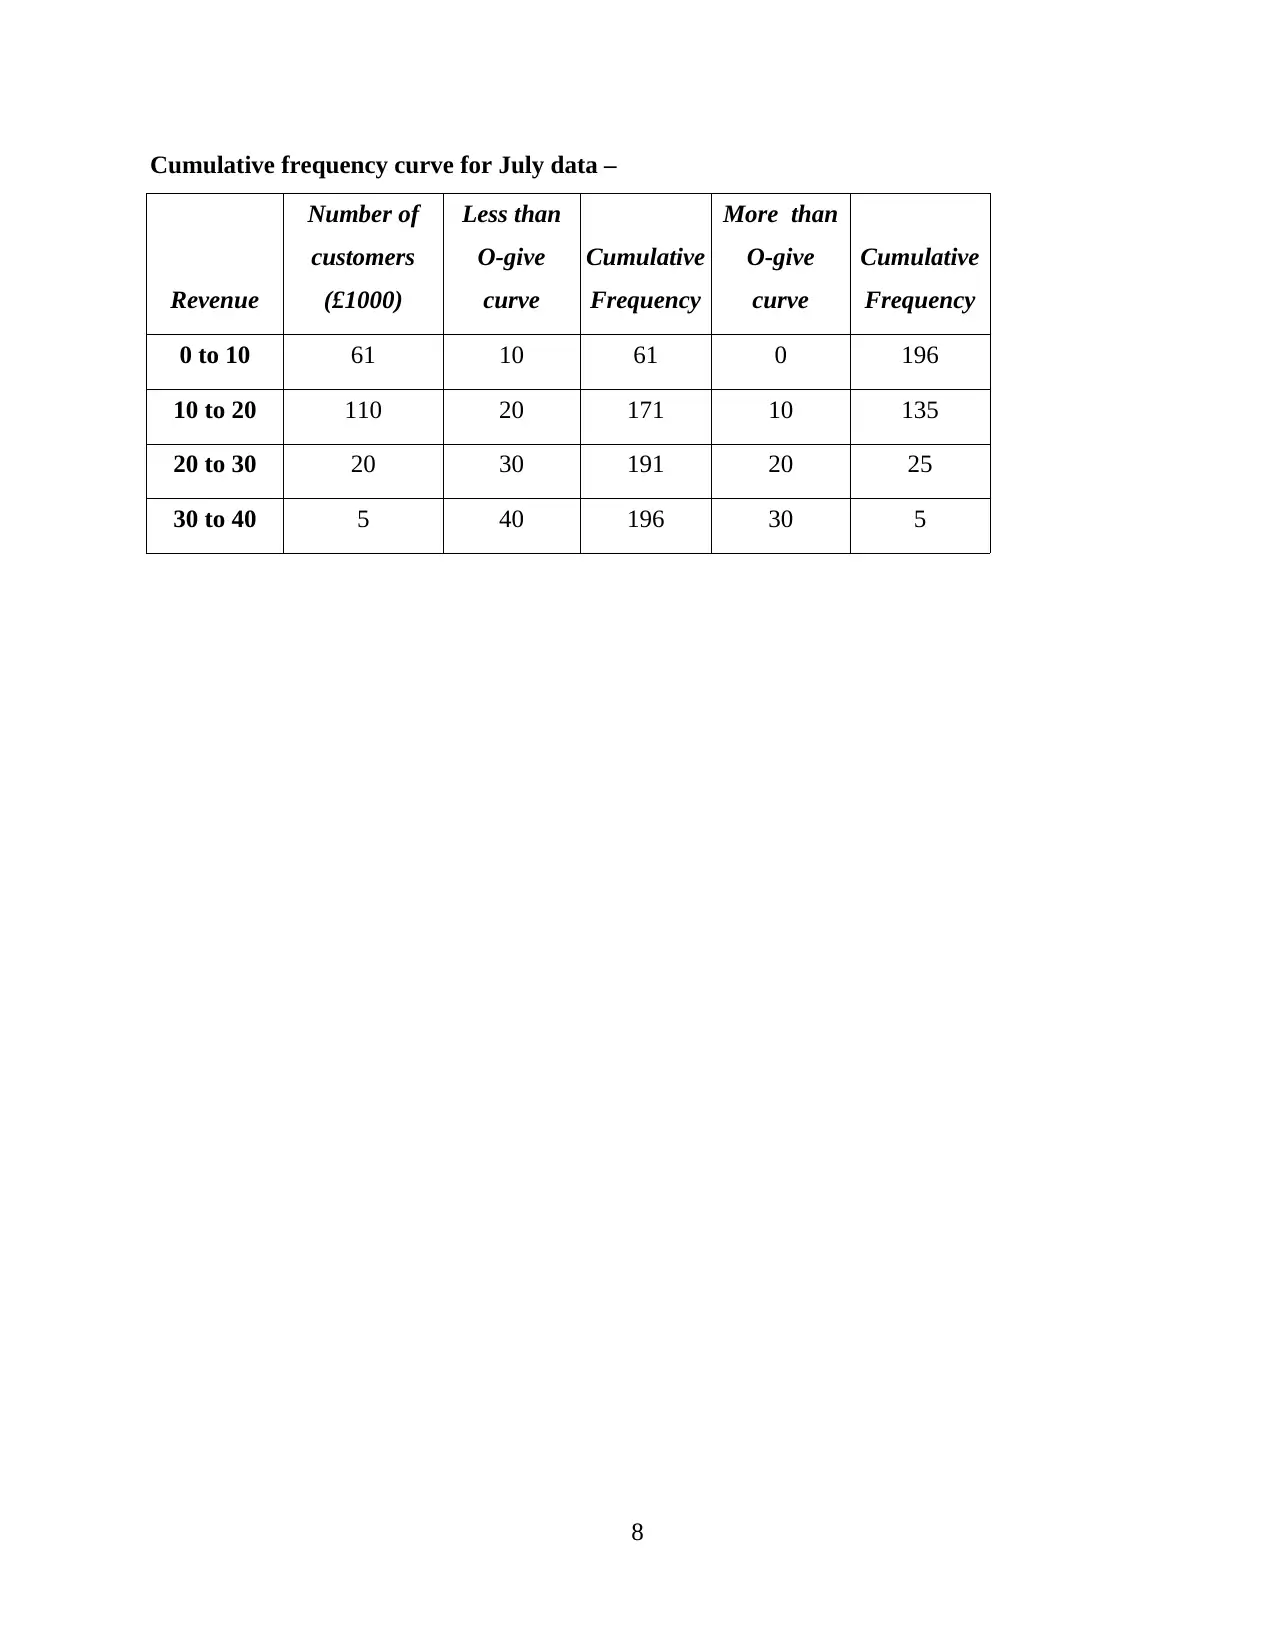
Cumulative frequency curve for July data –
Revenue
Number of
customers
(£1000)
Less than
O-give
curve
Cumulative
Frequency
More than
O-give
curve
Cumulative
Frequency
0 to 10 61 10 61 0 196
10 to 20 110 20 171 10 135
20 to 30 20 30 191 20 25
30 to 40 5 40 196 30 5
8
Revenue
Number of
customers
(£1000)
Less than
O-give
curve
Cumulative
Frequency
More than
O-give
curve
Cumulative
Frequency
0 to 10 61 10 61 0 196
10 to 20 110 20 171 10 135
20 to 30 20 30 191 20 25
30 to 40 5 40 196 30 5
8
Secure Best Marks with AI Grader
Need help grading? Try our AI Grader for instant feedback on your assignments.
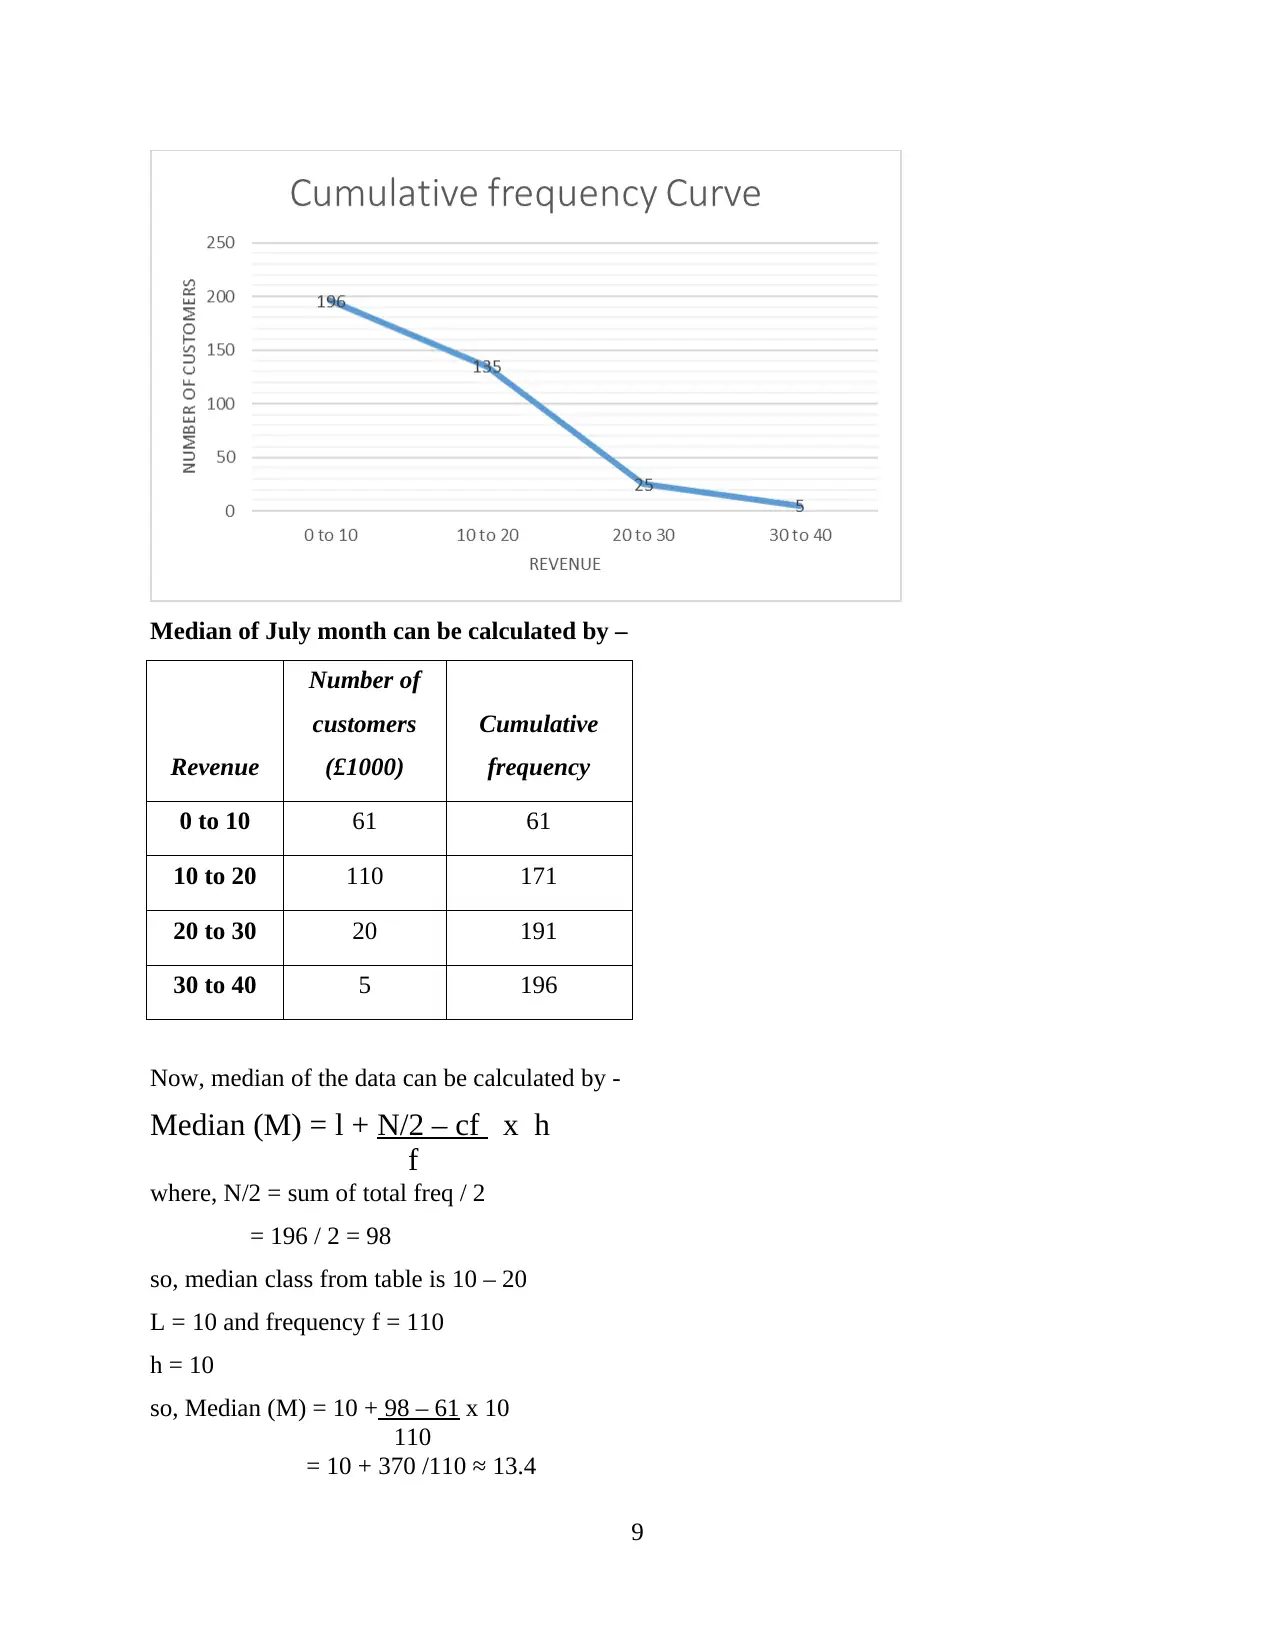
Median of July month can be calculated by –
Revenue
Number of
customers
(£1000)
Cumulative
frequency
0 to 10 61 61
10 to 20 110 171
20 to 30 20 191
30 to 40 5 196
Now, median of the data can be calculated by -
Median (M) = l + N/2 – cf x h
f
where, N/2 = sum of total freq / 2
= 196 / 2 = 98
so, median class from table is 10 – 20
L = 10 and frequency f = 110
h = 10
so, Median (M) = 10 + 98 – 61 x 10
110
= 10 + 370 /110 ≈ 13.4
9
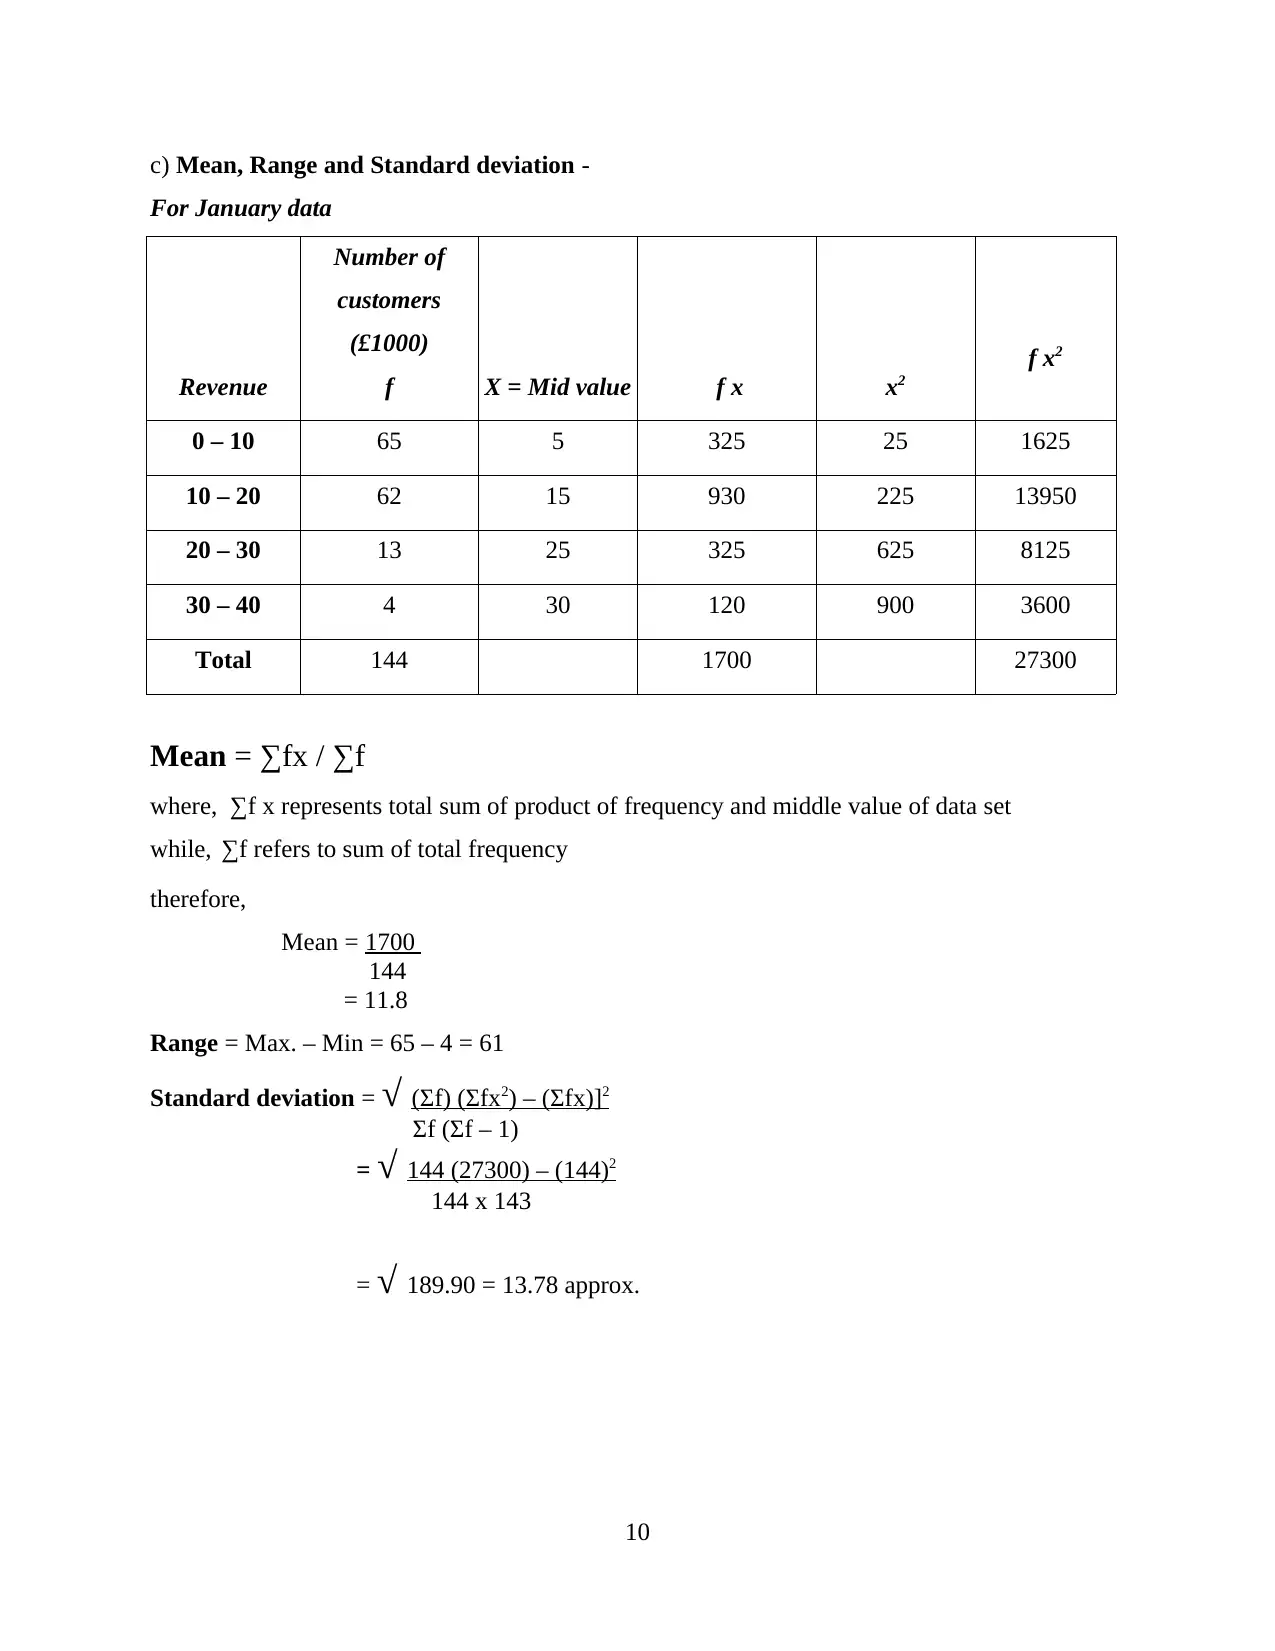
c) Mean, Range and Standard deviation -
For January data
Revenue
Number of
customers
(£1000)
f X = Mid value f x x2
f x2
0 – 10 65 5 325 25 1625
10 – 20 62 15 930 225 13950
20 – 30 13 25 325 625 8125
30 – 40 4 30 120 900 3600
Total 144 1700 27300
Mean = ∑fx / ∑f
where, ∑f x represents total sum of product of frequency and middle value of data set
while, ∑f refers to sum of total frequency
therefore,
Mean = 1700
144
= 11.8
Range = Max. – Min = 65 – 4 = 61
Standard deviation = √ (Σf) (Σfx2) – (Σfx)]2
Σf (Σf – 1)
= √ 144 (27300) – (144)2
144 x 143
= √ 189.90 = 13.78 approx.
10
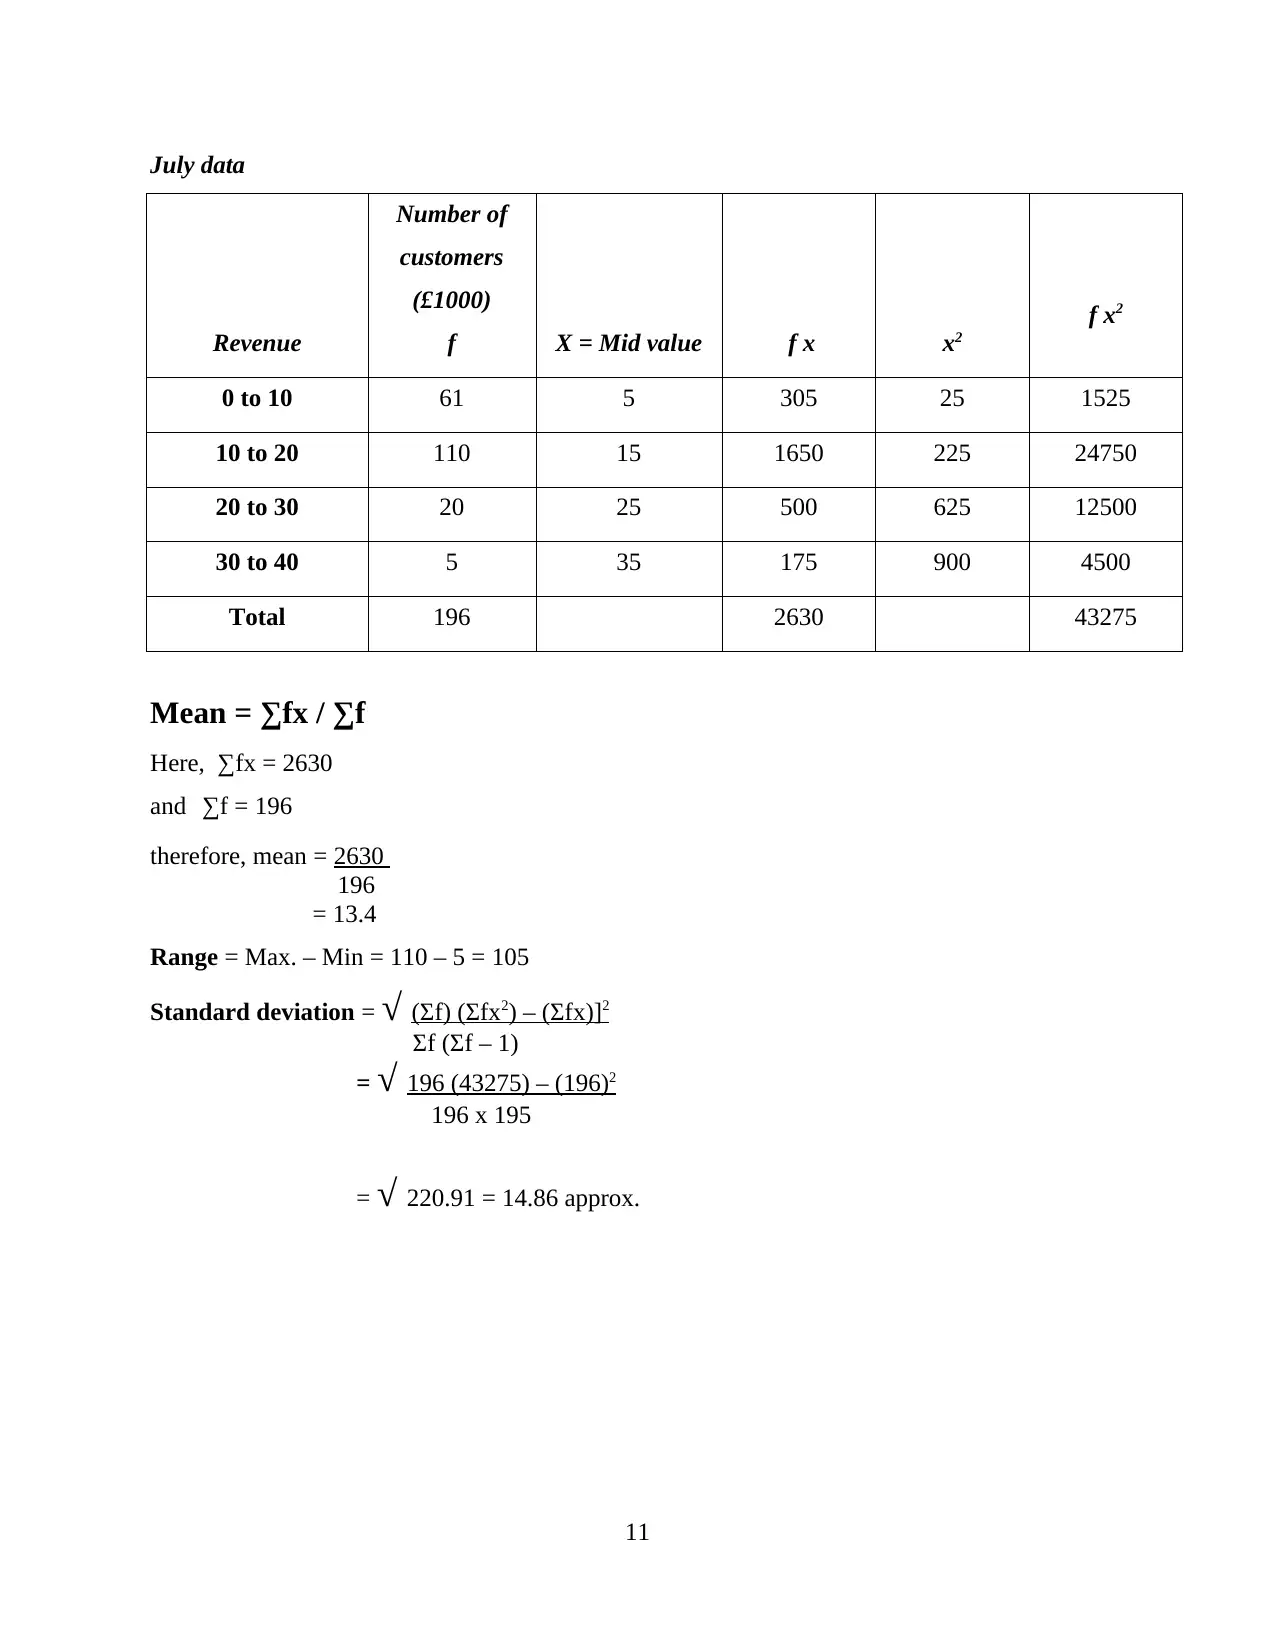
July data
Revenue
Number of
customers
(£1000)
f X = Mid value f x x2
f x2
0 to 10 61 5 305 25 1525
10 to 20 110 15 1650 225 24750
20 to 30 20 25 500 625 12500
30 to 40 5 35 175 900 4500
Total 196 2630 43275
Mean = ∑fx / ∑f
Here, ∑fx = 2630
and ∑f = 196
therefore, mean = 2630
196
= 13.4
Range = Max. – Min = 110 – 5 = 105
Standard deviation = √ (Σf) (Σfx2) – (Σfx)]2
Σf (Σf – 1)
= √ 196 (43275) – (196)2
196 x 195
= √ 220.91 = 14.86 approx.
11
Paraphrase This Document
Need a fresh take? Get an instant paraphrase of this document with our AI Paraphraser
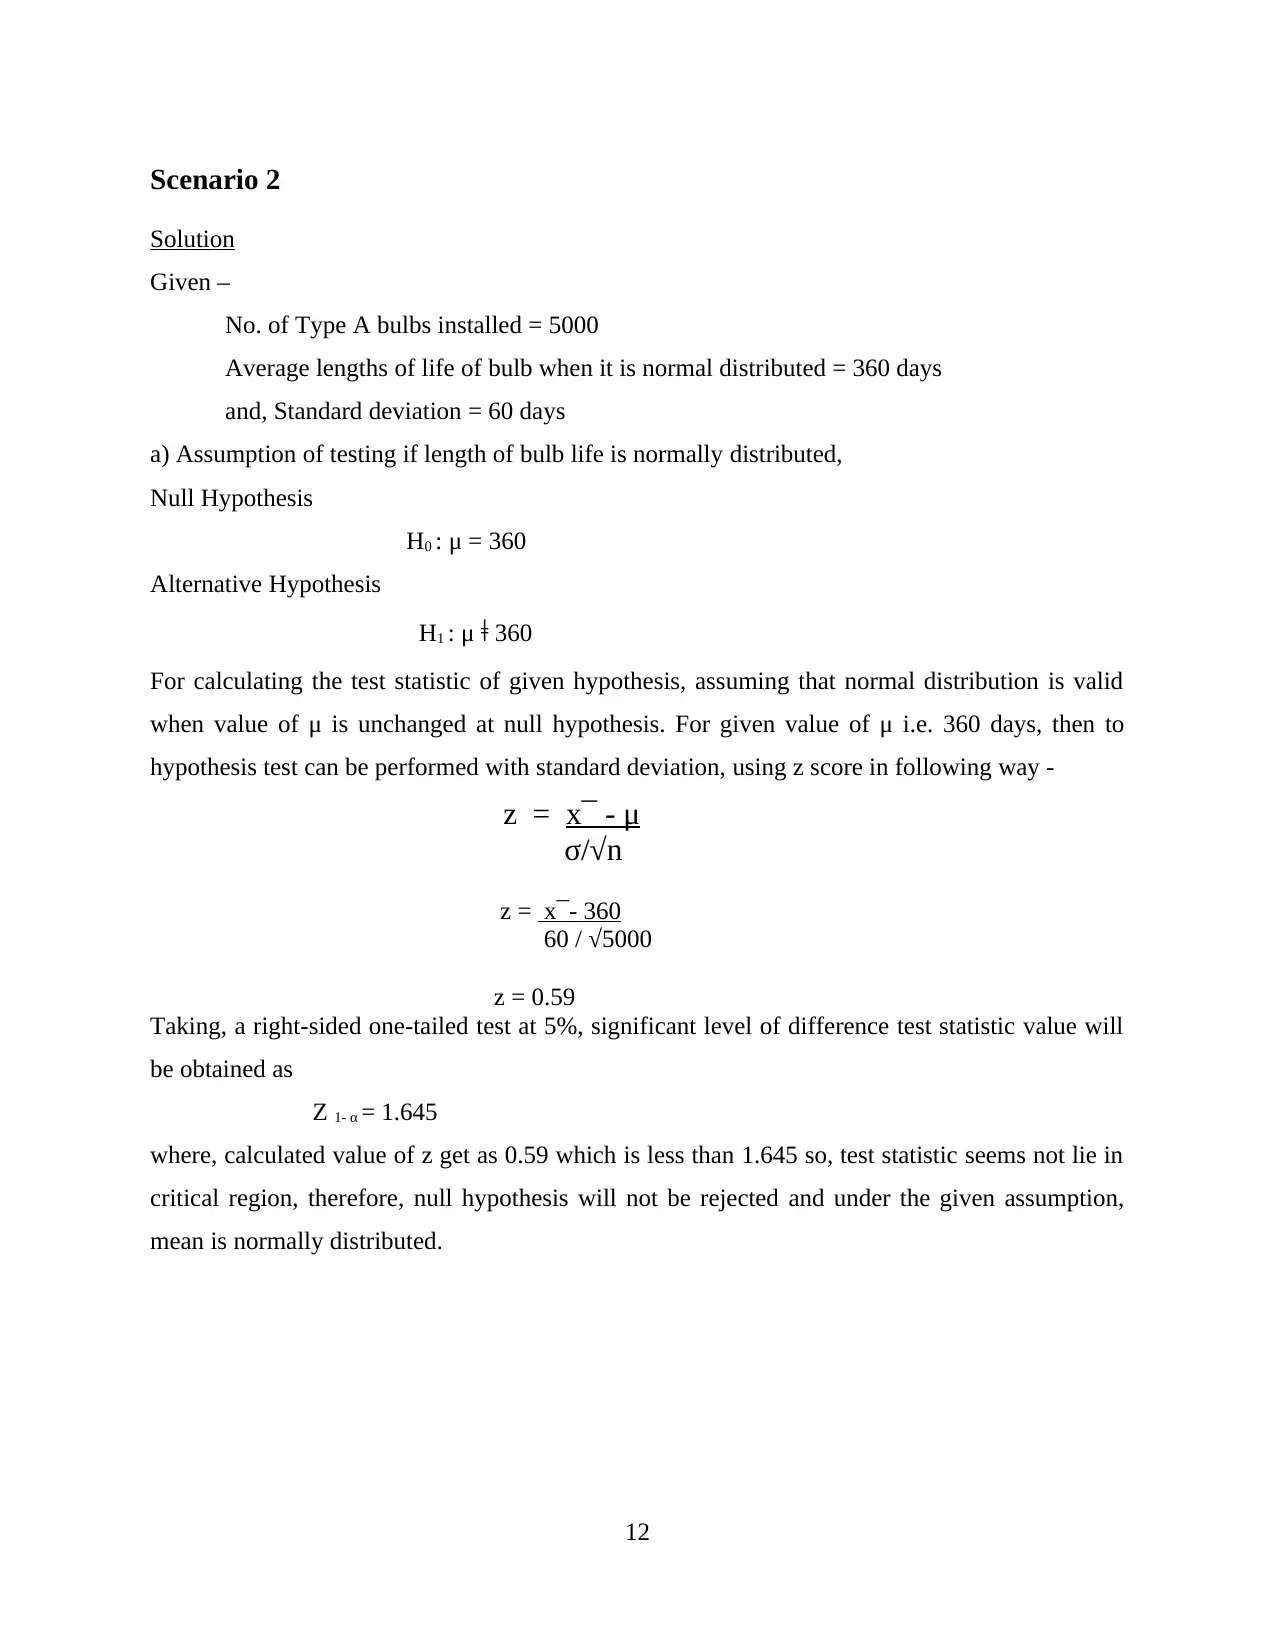
Scenario 2
Solution
Given –
No. of Type A bulbs installed = 5000
Average lengths of life of bulb when it is normal distributed = 360 days
and, Standard deviation = 60 days
a) Assumption of testing if length of bulb life is normally distributed,
Null Hypothesis
H0 : μ = 360
Alternative Hypothesis
H1 : μ ǂ 360
For calculating the test statistic of given hypothesis, assuming that normal distribution is valid
when value of μ is unchanged at null hypothesis. For given value of μ i.e. 360 days, then to
hypothesis test can be performed with standard deviation, using z score in following way -
z = x¯ - μ
σ/√n
z = x¯- 360
60 / √5000
z = 0.59
Taking, a right-sided one-tailed test at 5%, significant level of difference test statistic value will
be obtained as
Z 1- α = 1.645
where, calculated value of z get as 0.59 which is less than 1.645 so, test statistic seems not lie in
critical region, therefore, null hypothesis will not be rejected and under the given assumption,
mean is normally distributed.
12
B. Mean of age of 10 people = 27 years
To test, average mean of 10 people taken as a sample from a certain population, is above or less
than 30 years
Take, Hypothesis assumption as -
Let H0 : μ = 30
and, H1 : μ ǂ 30
z = x¯ - μ
σ/√n
now, Variance is known to be 20, then,
standard deviation = √V = √20 = 4.47
so,
z = 30 – 27
4.47√9
so, z = 2.01
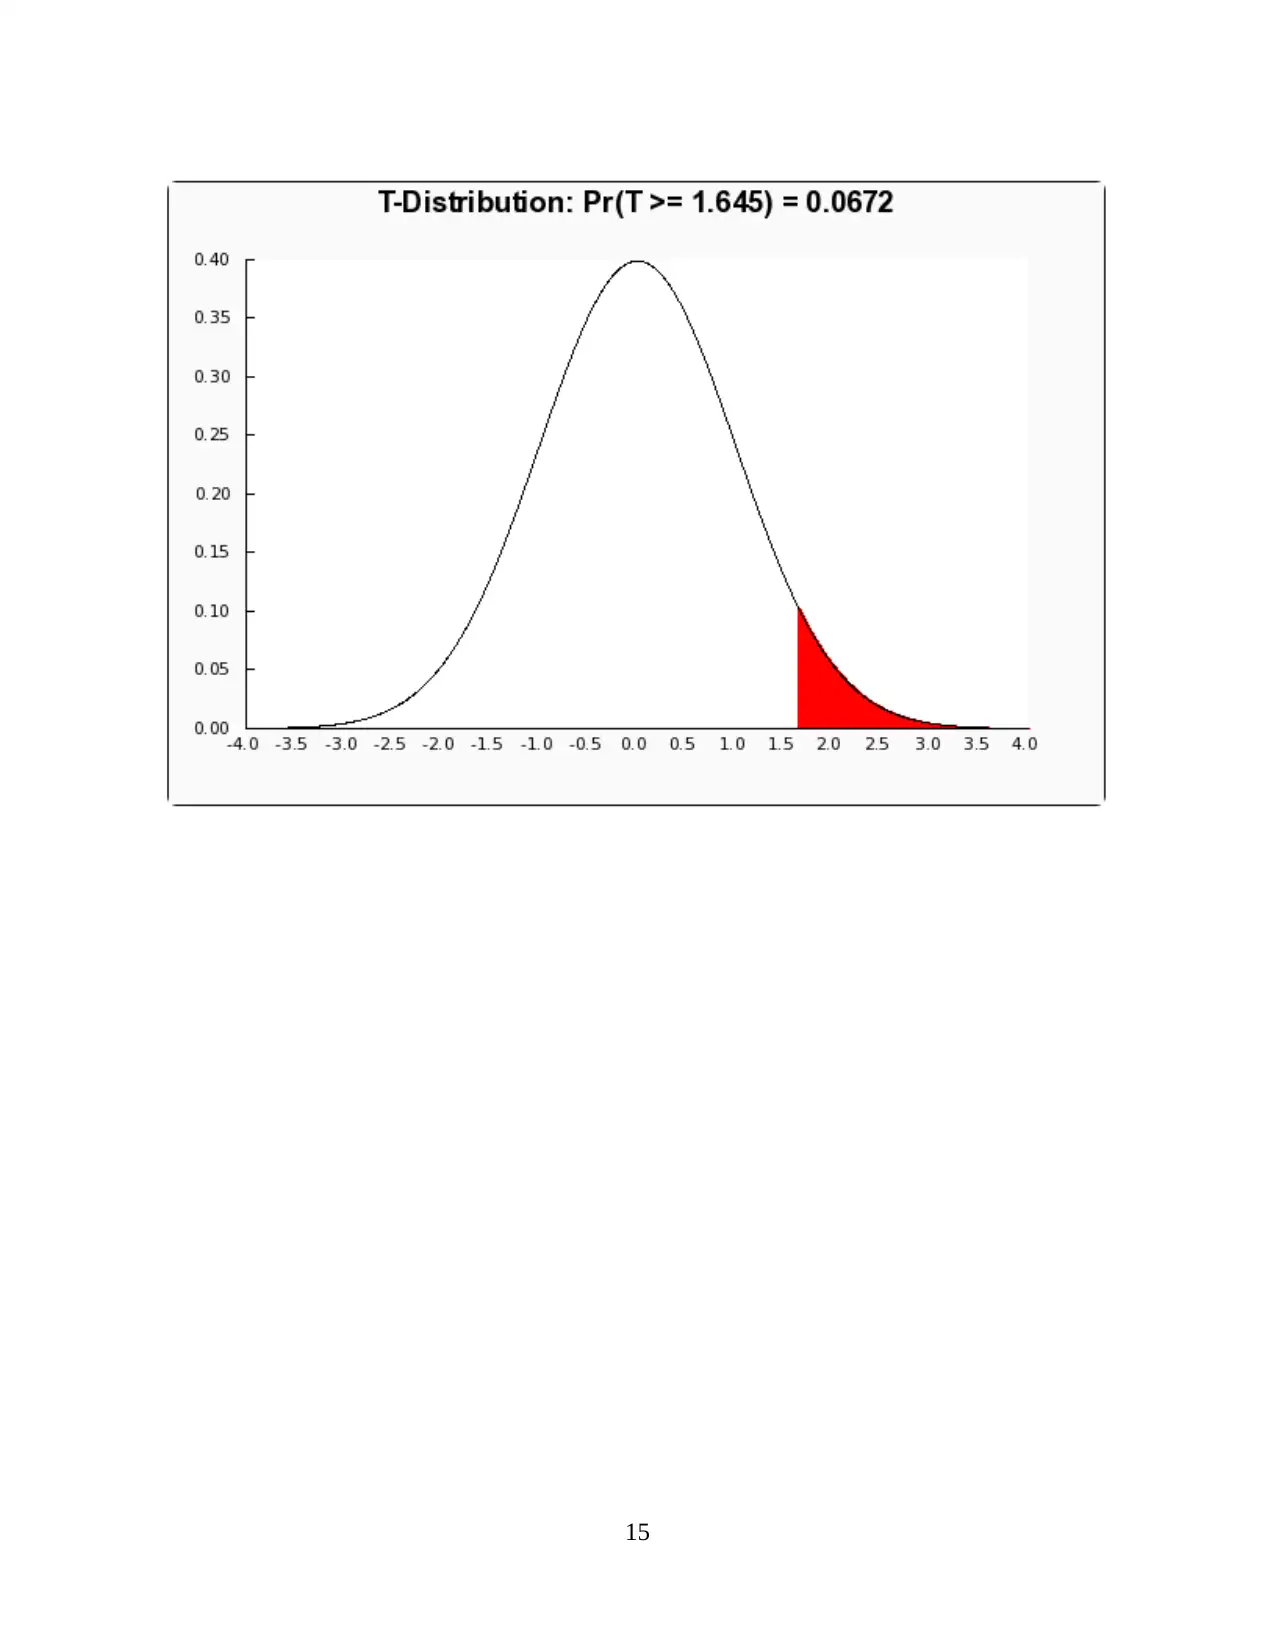
At 5% level of significance with a right-sided one-tailed test, is α = 0.05
then, value of test statistic Z 1- α = 1.645,
As calculated value 2.01 is greater than obtained value 1.645 so, test statistic hereby, lies in
critical region, therefore, null hypothesis is rejected in this case. Henceforth, mean age of
population is not greater than 30 years.
Now, at two-tailed test analysis, Probability can be described as-
P {1.645 ≤ Z ≤ 2.01}
13
To test, average mean of 10 people taken as a sample from a certain population, is above or less
than 30 years
Take, Hypothesis assumption as -
Let H0 : μ = 30
and, H1 : μ ǂ 30
z = x¯ - μ
σ/√n
now, Variance is known to be 20, then,
standard deviation = √V = √20 = 4.47
so,
z = 30 – 27
4.47√9
so, z = 2.01
At 5% level of significance with a right-sided one-tailed test, is α = 0.05
then, value of test statistic Z 1- α = 1.645,
As calculated value 2.01 is greater than obtained value 1.645 so, test statistic hereby, lies in
critical region, therefore, null hypothesis is rejected in this case. Henceforth, mean age of
population is not greater than 30 years.
Now, at two-tailed test analysis, Probability can be described as-
P {1.645 ≤ Z ≤ 2.01}
13
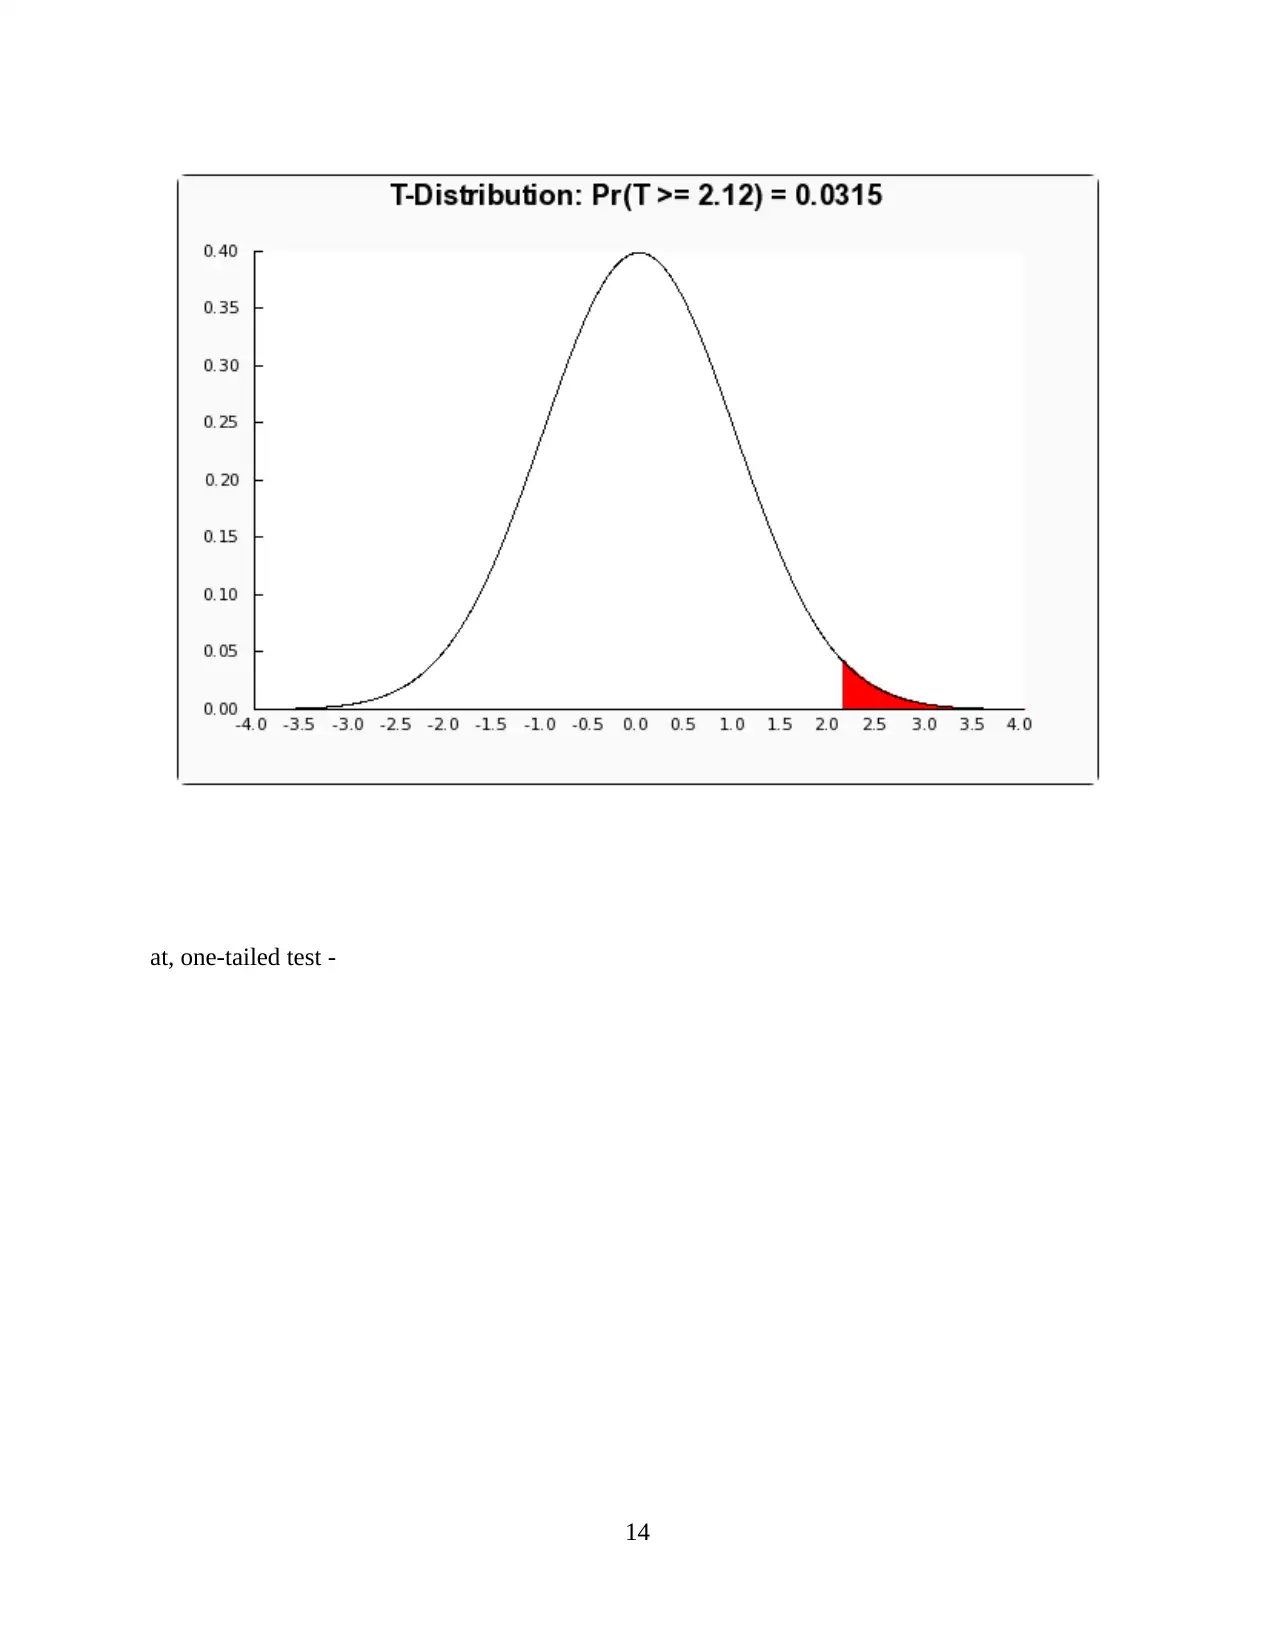
at, one-tailed test -
14
14
Secure Best Marks with AI Grader
Need help grading? Try our AI Grader for instant feedback on your assignments.
15
TASK 3
Scenario 1
Solution – Wave of displacement caused by the vibrations is represented as -
x1 = 3.75 sin (100 π t + 2 π/9) ….(i)
and, x2 = 4.42 sin (100 π t - 2 π/5) ….(ii)
Rewrite the given equation in the wave form as x = A sin (kx – wt)
x1 = 3.75 sin (100 π (t + 0.002)) ….(iii)
and, x2 = 4.42 sin (100 π (t – 0.004)) ….(iv)
a) From above equations Amplitude and phase equation can be determined as
In equation (iii)
Amplitude = 3.75 and,
In equation (iv)
Amplitude = 4.42
Similarly,
In equation (iii)
Phase = 0.002 to the left
and,
In equation (iv)
Phase = 0.004 to the right
While,
Periodic times = 2 π / 100 π = 0.002.
While, frequency = 1/period
from, F = 1 / 0.002 = 500
16
b) Time taken by machines, when both are switched on, can be calculated by differentiating
them, with respect to t –
First equation-
x1 = 3.75 sin (100 π t + 2 π/9)
Differentiating w.r.t x
dx1/dt = 3.75 cos (100 π t + 2 π/9) x 100 π
As any function get its maximum value at dx/dt = 0
Therefore,
3.75 cos (100 π t + 2 π/9) x 100 π = 0
cos (100 π t + 2 π/9) = 0 (cos 0 = 90 )⁰
100 π t + 2 π/9 = 90
on solving,
t = 0.002 seconds
Similarly, differentiate another equation with respect to t as-
x2 = 4.42 sin (100 π t - 2 π/5)
dx2/dt = 4.42 cos (100 π t - 2 π/5) x 100 π
for maximum,
dx2/dt = 0
4.42 cos (100 π t - 2 π/5) x 100 π = 0
cos (100 π t - 2 π/5) = 0
100 π t - 2 π/5 = 90
on solving
t = 0.009 seconds
c) When displacement reach at -2mm, then time taken via each machine
Take dx1/dt = -2mm
dx1/dt = 3.75 cos (100 π t + 2 π/9) x 100 π
3.75 cos (100 π t + 2 π/9) x 100 π = -2
375 π cos (100 π t + 2 π/9) = -2
cos (100 π t + 2 π/9) = -0.00002963
100 π t + 2 π/9 = 90.01
17
Paraphrase This Document
Need a fresh take? Get an instant paraphrase of this document with our AI Paraphraser
100 π t = 90.05 – 2 π/9
t = 0.0027sec
Similarly, time taken by second machine is
dx2/dt = -2mm
4.42 cos (100 π t - 2 π/5) x 100 π = -2
4.42 cos (100 π t - 2 π/5) x 100 π = -2
cos (100 π t - 2 π/5) = 0.000025138
100 π t - 2 π/5 = 89.99
t = 0.0089 seconds
(iv) Compound angle formula of above wave equation can be expressed by using
sin (A+B) = sin A cos B + cos A sin B
First equation -
x1 = 3.75 sin (100 π t + 2 π/9)
then,
x1 = 3.75 (sin 100 π t. cos 2 π/9 + cos 100 π t . sin 2 π/9)
or, x1 = 3.75 ( sin 100 π t x 0.76 + cos 100 π t x 0.64)
or, [x1 = 2.85 sin 100 π t + 2.4 cos 100 π t]
Similarly, another wave equation -
x2 = 4.42 sin (100 π t - 2 π/5)
x2 = 4.42 (sin 100 π t . cos 2 π/5 - cos 100 π t . sin 2 π/5)
or, x2 = 4.42 ( sin 100 π t x 0.31 + cos 100 π t x 0.95)
or, [x2 = 1.3702 sin 100 π t + 4.199 cos 100 π t]
v) Expression of x1 and x2 in combined form as 𝑅 sin(100𝜋𝑡 +𝛼) can be expressed by -
x1 + x2 = (2.85 sin 100 π t + 2.4 cos 100 π t) + (1.3702 sin 100 π t + 4.199 cos 100 π t)
x1 + x2 = 4.2202 sin 100 π t + 6.599 cos 100 π t
x1 + x2 = 6 (sin 100 π t + π/4)
18

19
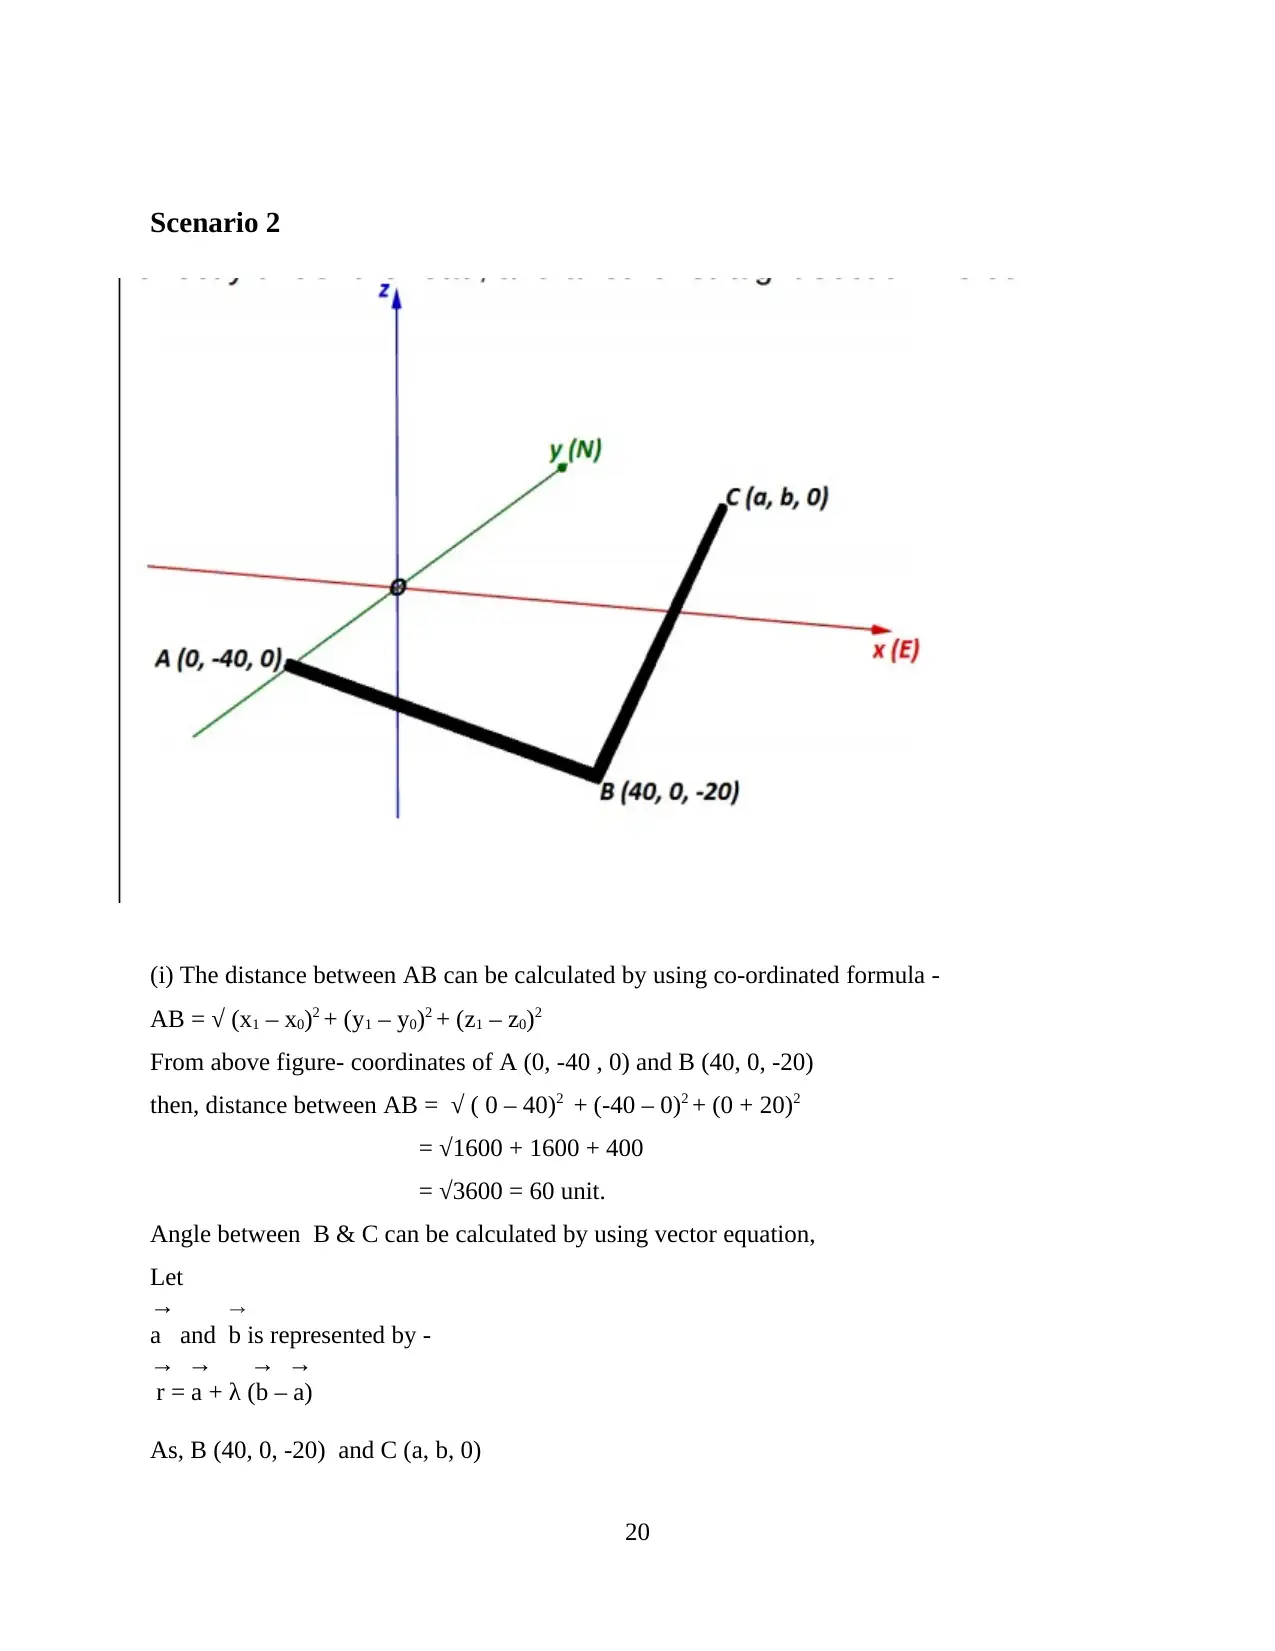
Scenario 2
(i) The distance between AB can be calculated by using co-ordinated formula -
AB = √ (x1 – x0)2 + (y1 – y0)2 + (z1 – z0)2
From above figure- coordinates of A (0, -40 , 0) and B (40, 0, -20)
then, distance between AB = √ ( 0 – 40)2 + (-40 – 0)2 + (0 + 20)2
= √1600 + 1600 + 400
= √3600 = 60 unit.
Angle between B & C can be calculated by using vector equation,
Let
→ →
a and b is represented by -
→ → → →
r = a + λ (b – a)
As, B (40, 0, -20) and C (a, b, 0)
20
Secure Best Marks with AI Grader
Need help grading? Try our AI Grader for instant feedback on your assignments.
The position vector of B (40, 0, -20) = ( 40 ˆi + 0 ˆj -20 ˆk )
The position of C (a, b, 0) = ( aˆi + bˆj + 0ˆk )
So, →
r = ( 40ˆi + 0ˆj -20ˆk ) + λ [ ( aˆi + bˆj + 0ˆk ) - ( 40ˆi + 0ˆj -20ˆk ) ]
= ( 40ˆi + 0ˆj -20ˆk ) + λ [ (a – 40) ˆi + bˆj + 20ˆk) ]
→
Given , r = 3i + 4j + k
On comparison,
λ = 1.05, so, a = 75 (approx) and b = 4 (approx)
Similarly, angle between two lines on Cartesian plane can be calculated by –
→ →
cos Ө = u . v
||u|| ||v||
→
AB = Position vector of B – position vector of A
= (40, 40, -20)
→
BC = Position vector of C – position vector of B
= (a - 40, b, 20)
Then,
→ →
cos Ө = u . v
||u|| ||v||
cos Ө = (40i + 40j -20k) . ((a-40)i + bj + 20k)
√(402 + 402 + 202). √((a-40)2 + b2 + 202)
cos Ө = 40(a-40) + 40b -400
√3600 . √((a-40)2 + b2 + 202)
= 2(a+b-101)
3.√((a-40)2 + b2 + 202)
21
TASK 4
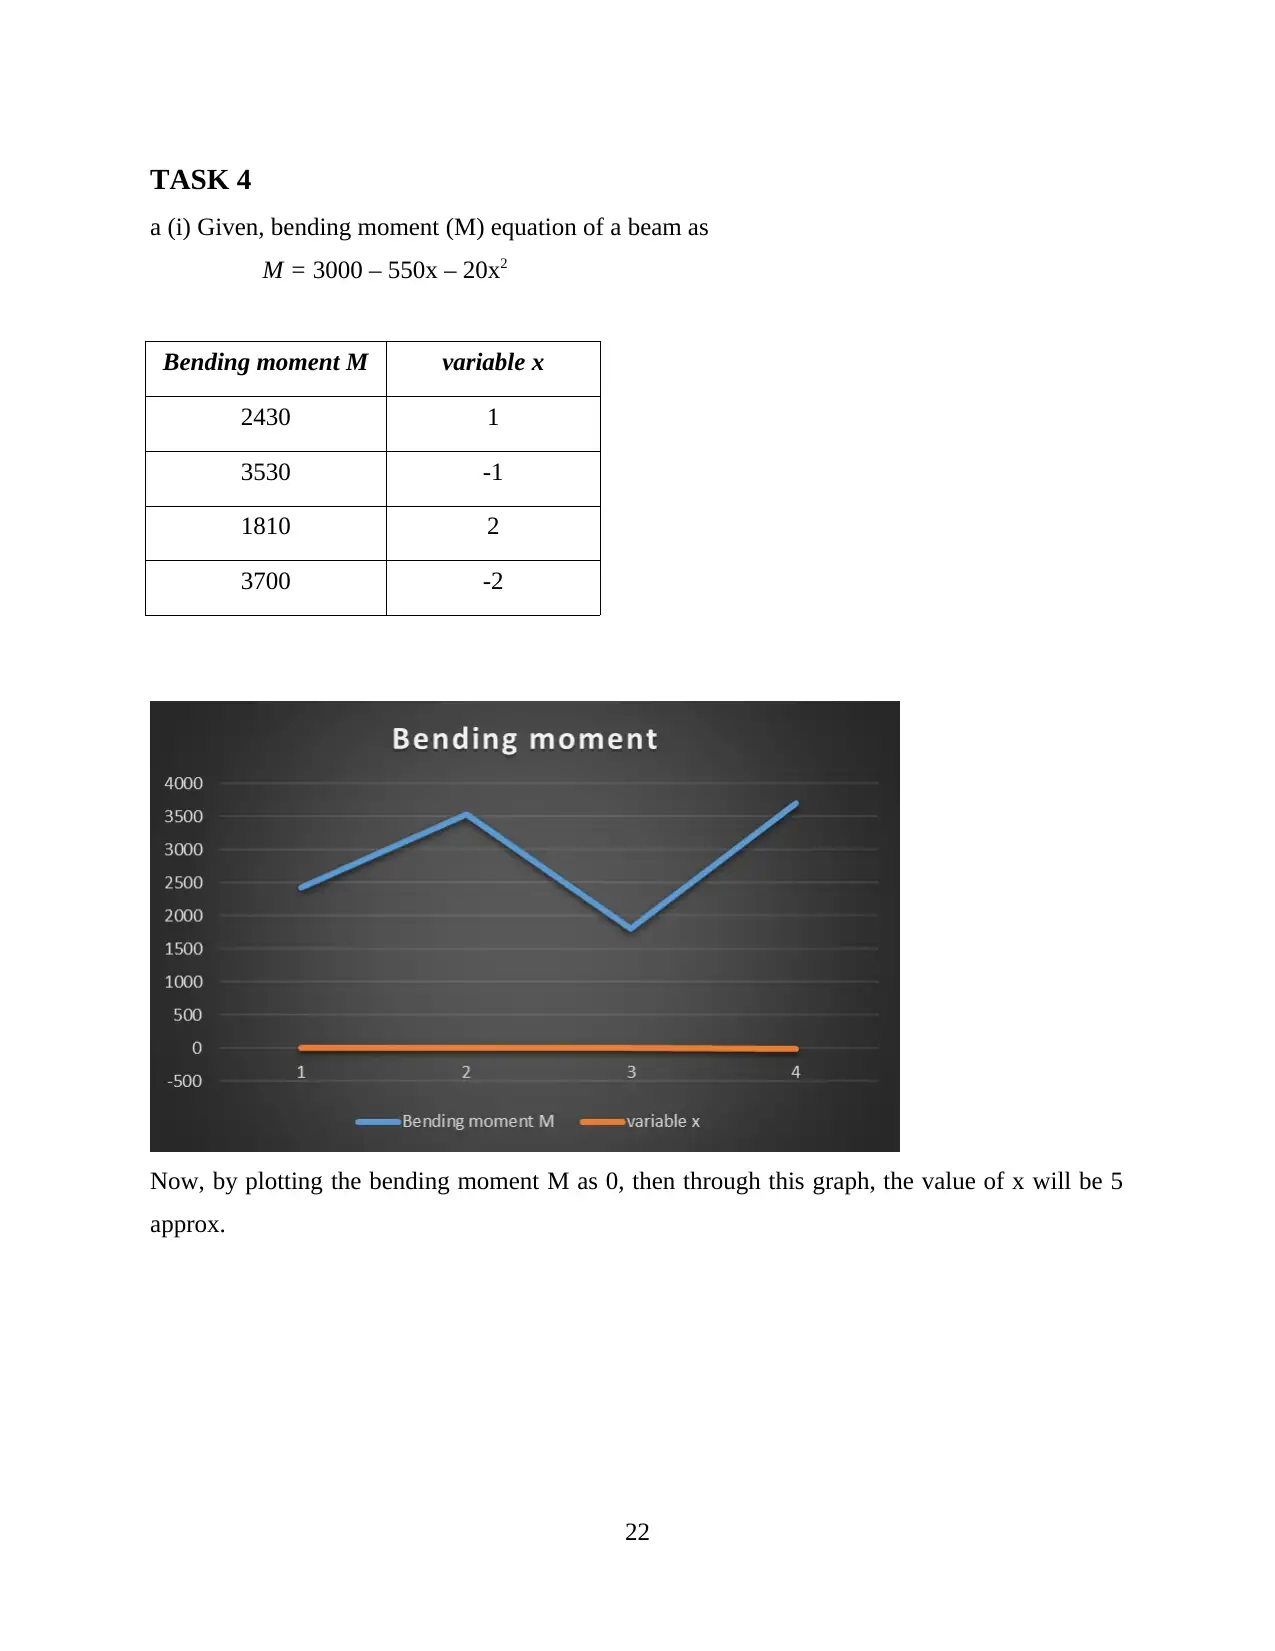
a (i) Given, bending moment (M) equation of a beam as
M = 3000 – 550x – 20x2
Bending moment M variable x
2430 1
3530 -1
1810 2
3700 -2
Now, by plotting the bending moment M as 0, then through this graph, the value of x will be 5
approx.
22
a (i) Given, bending moment (M) equation of a beam as
M = 3000 – 550x – 20x2
Bending moment M variable x
2430 1
3530 -1
1810 2
3700 -2
Now, by plotting the bending moment M as 0, then through this graph, the value of x will be 5
approx.
22
(aii) Maximum or minimum value of M (Bending Moment Function) can be determined, by
differentiating the given equation with respect to x as,
d/dx (M) = d/dx (3000 – 550x – 20x2)
= – 550 – 40x
since, d/dx < 0,
therefore, M will attain its maximum value at -
d/dx (M) = 0
– 550 – 40x = 0
x = -13.75 or -14 approx.
Take this value of x in M, to calculate its maximum value as -
M = 3000 – 550 (-14) – 20(-14)2
= 3000 + 7700 – 3920 = 6780 (Ans)
b) The temperature Ө at degree Celsius with time t in minutes, of a body is represented by -
Ө = 300 + 100 e-0.1 t
put value of t = 0, 1, 2 and 5, for determining value of Ө as
at t = 0,
Ө = 300 + 100 e-0.1 x 0
= 300 + 100 x 1
= 400 ºC
at t = 1,
Ө = 300 + 100 e-0.1 x 1
= 300 + 100 x 0.90
= 390 ºC
at t = 2,
Ө = 300 + 100 e-0.1 x 2
= 300 + 100 x 0.81
= 381 ºC
at t = 5,
Ө = 300 + 100 e-0.1 x 5
= 300 + 100 x 0.60
= 360 ºC
23
Paraphrase This Document
Need a fresh take? Get an instant paraphrase of this document with our AI Paraphraser
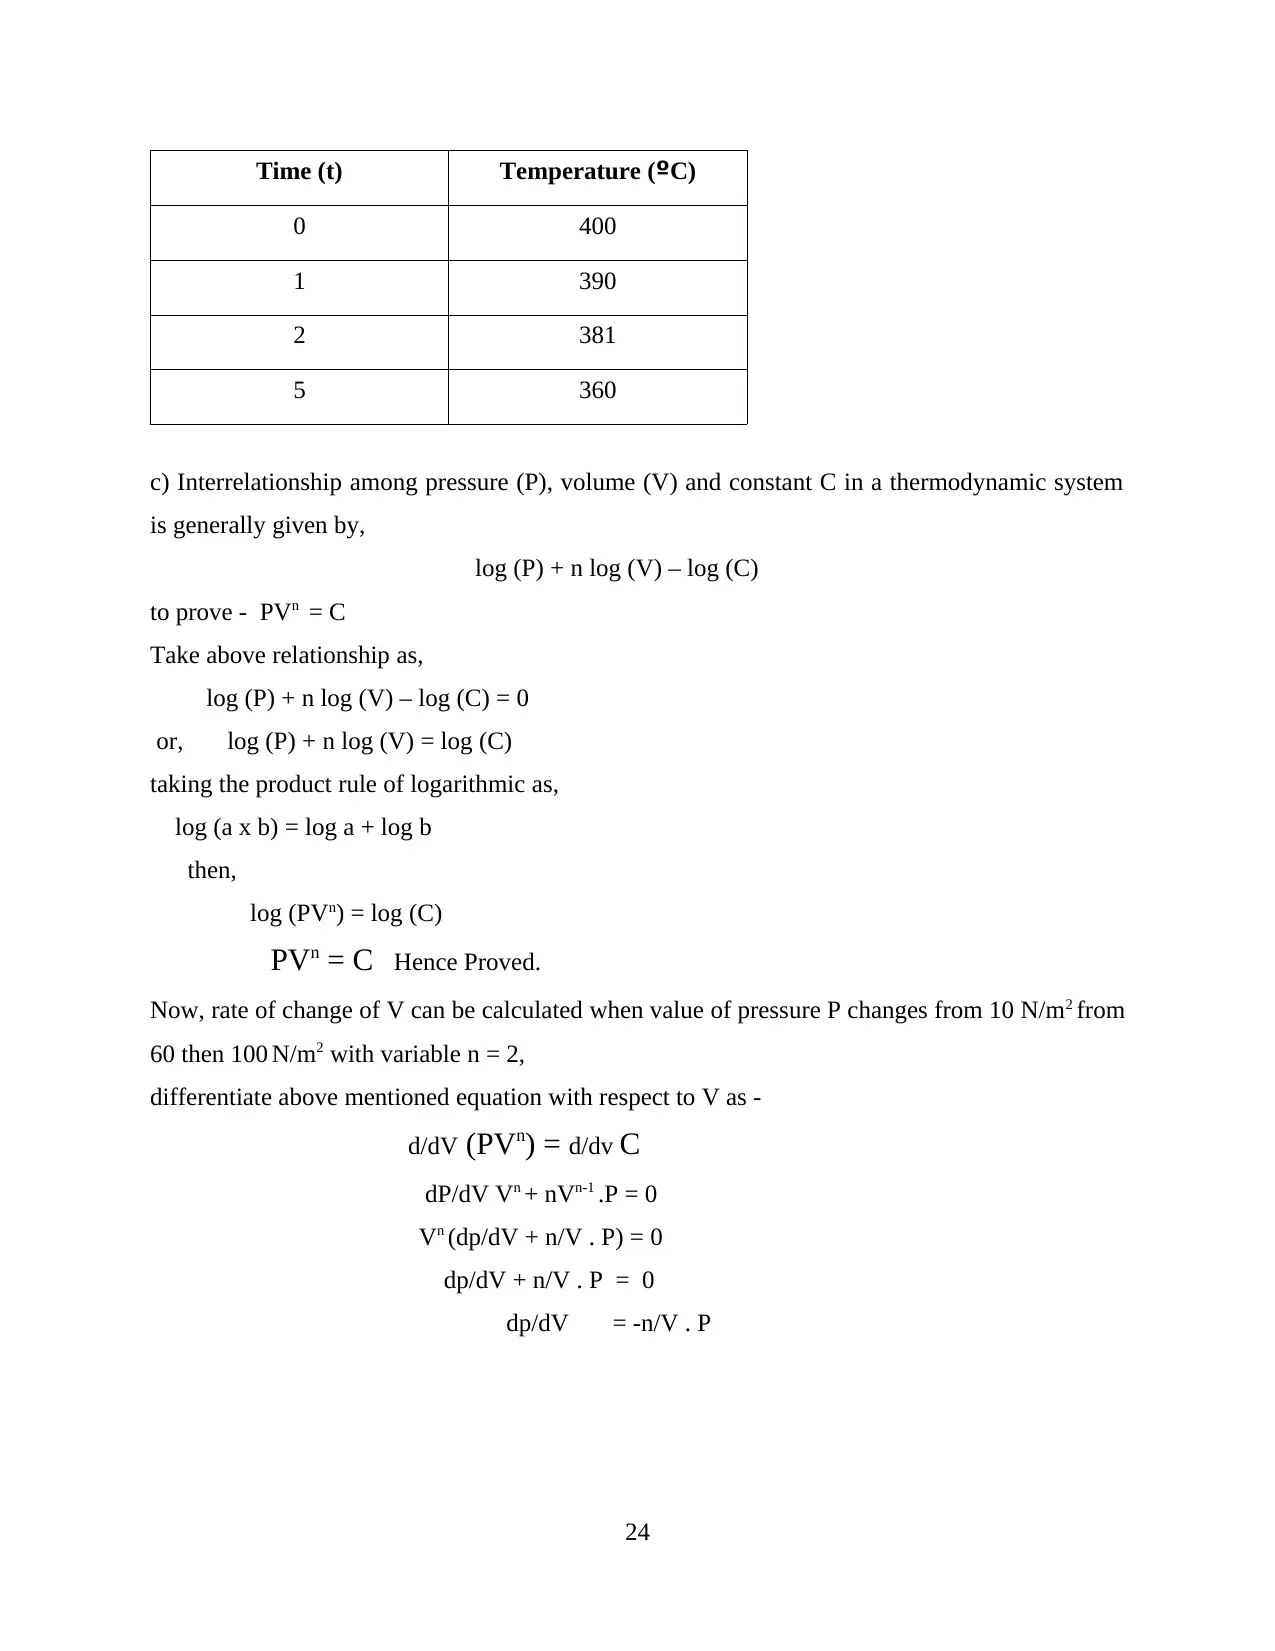
Time (t) Temperature (ºC)
0 400
1 390
2 381
5 360
c) Interrelationship among pressure (P), volume (V) and constant C in a thermodynamic system
is generally given by,
log (P) + n log (V) – log (C)
to prove - PVn = C
Take above relationship as,
log (P) + n log (V) – log (C) = 0
or, log (P) + n log (V) = log (C)
taking the product rule of logarithmic as,
log (a x b) = log a + log b
then,
log (PVn) = log (C)
PVn = C Hence Proved.
Now, rate of change of V can be calculated when value of pressure P changes from 10 N/m2 from
60 then 100 N/m2 with variable n = 2,
differentiate above mentioned equation with respect to V as -
d/dV (PVn) = d/dv C
dP/dV Vn + nVn-1 .P = 0
Vn (dp/dV + n/V . P) = 0
dp/dV + n/V . P = 0
dp/dV = -n/V . P
24
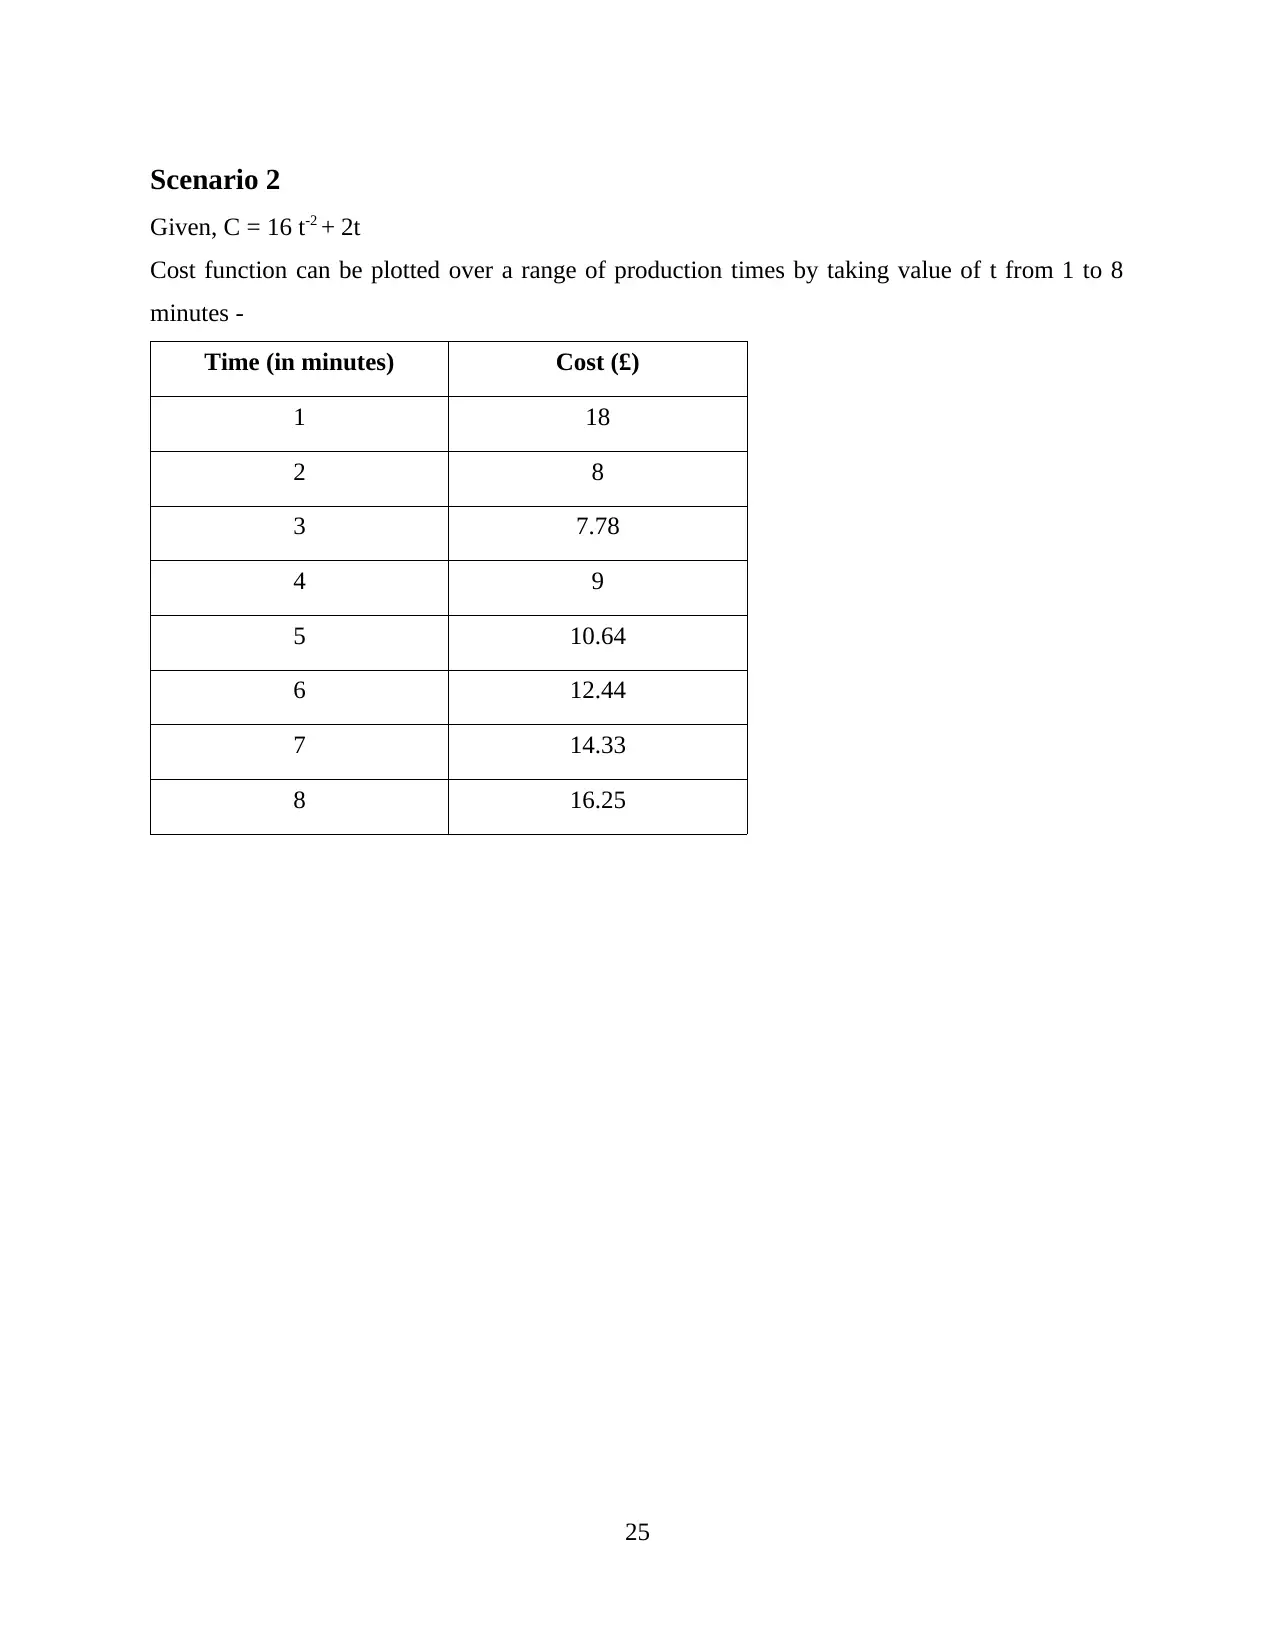
Scenario 2
Given, C = 16 t-2 + 2t
Cost function can be plotted over a range of production times by taking value of t from 1 to 8
minutes -
Time (in minutes) Cost (£)
1 18
2 8
3 7.78
4 9
5 10.64
6 12.44
7 14.33
8 16.25
25
Given, C = 16 t-2 + 2t
Cost function can be plotted over a range of production times by taking value of t from 1 to 8
minutes -
Time (in minutes) Cost (£)
1 18
2 8
3 7.78
4 9
5 10.64
6 12.44
7 14.33
8 16.25
25
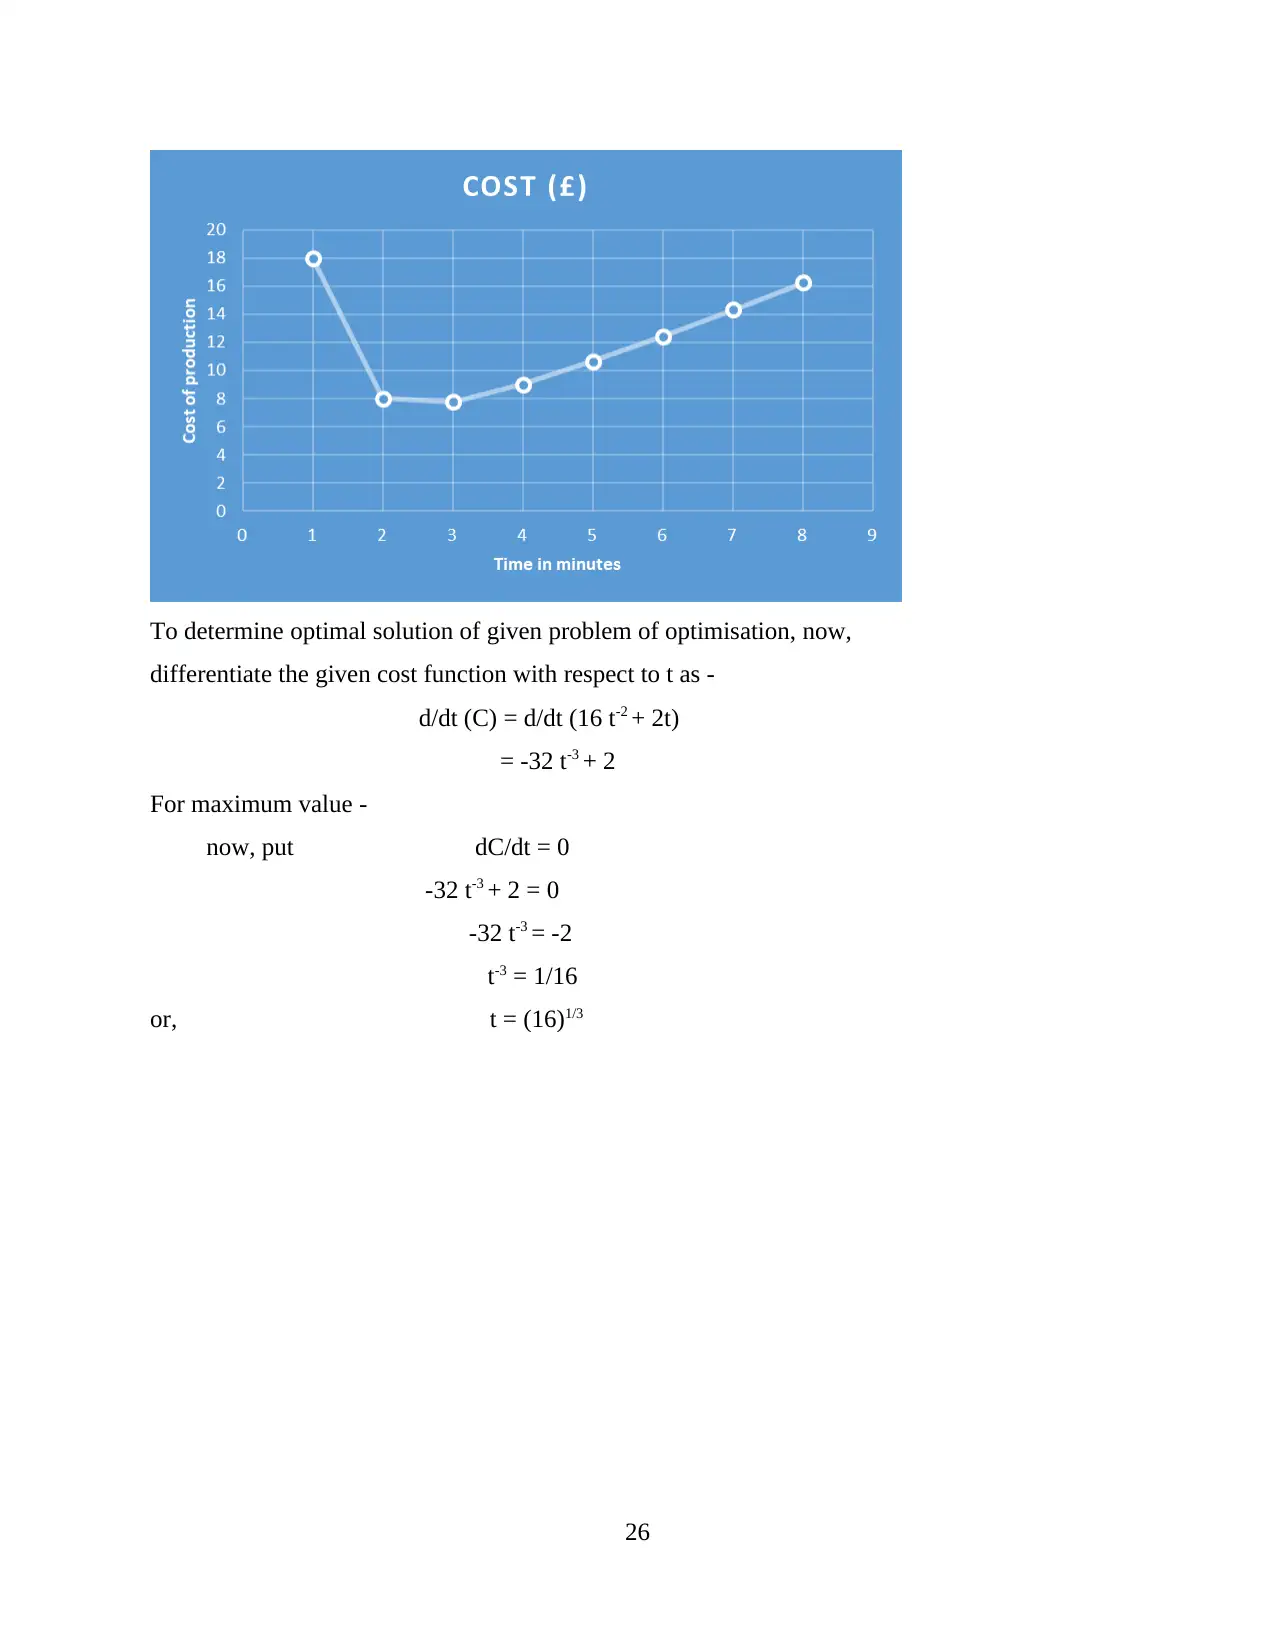
To determine optimal solution of given problem of optimisation, now,
differentiate the given cost function with respect to t as -
d/dt (C) = d/dt (16 t-2 + 2t)
= -32 t-3 + 2
For maximum value -
now, put dC/dt = 0
-32 t-3 + 2 = 0
-32 t-3 = -2
t-3 = 1/16
or, t = (16)1/3
26
differentiate the given cost function with respect to t as -
d/dt (C) = d/dt (16 t-2 + 2t)
= -32 t-3 + 2
For maximum value -
now, put dC/dt = 0
-32 t-3 + 2 = 0
-32 t-3 = -2
t-3 = 1/16
or, t = (16)1/3
26
Secure Best Marks with AI Grader
Need help grading? Try our AI Grader for instant feedback on your assignments.

27
1 out of 29
Related Documents


Your All-in-One AI-Powered Toolkit for Academic Success.
+13062052269
info@desklib.com
Available 24*7 on WhatsApp / Email
![[object Object]](/_next/static/media/star-bottom.7253800d.svg)
Unlock your academic potential
© 2024 | Zucol Services PVT LTD | All rights reserved.