Mathematics for Construction
VerifiedAdded on 2023/01/19
|25
|3391
|60
AI Summary
This document provides study material and solved assignments for the Mathematics for Construction course. It covers topics such as histograms, cumulative frequency distribution curve, mean, range, standard deviation, hypothesis testing, phase, amplitude, frequency, compound angle formula, and more.
Contribute Materials
Your contribution can guide someone’s learning journey. Share your
documents today.
8 Mathematics for
Construction
Construction
Secure Best Marks with AI Grader
Need help grading? Try our AI Grader for instant feedback on your assignments.
Table of Contents
TASK 2 ...........................................................................................................................................3
Scenario 1.....................................................................................................................................3
Scenario 2.....................................................................................................................................6
TASK 3..........................................................................................................................................12
Scenario 1...................................................................................................................................12
Scenario 2...................................................................................................................................16
TASK 4..........................................................................................................................................18
Scenario 1...................................................................................................................................18
Scenario 2 ..................................................................................................................................20
Scenario 3...................................................................................................................................22
TASK 2
Scenario 1
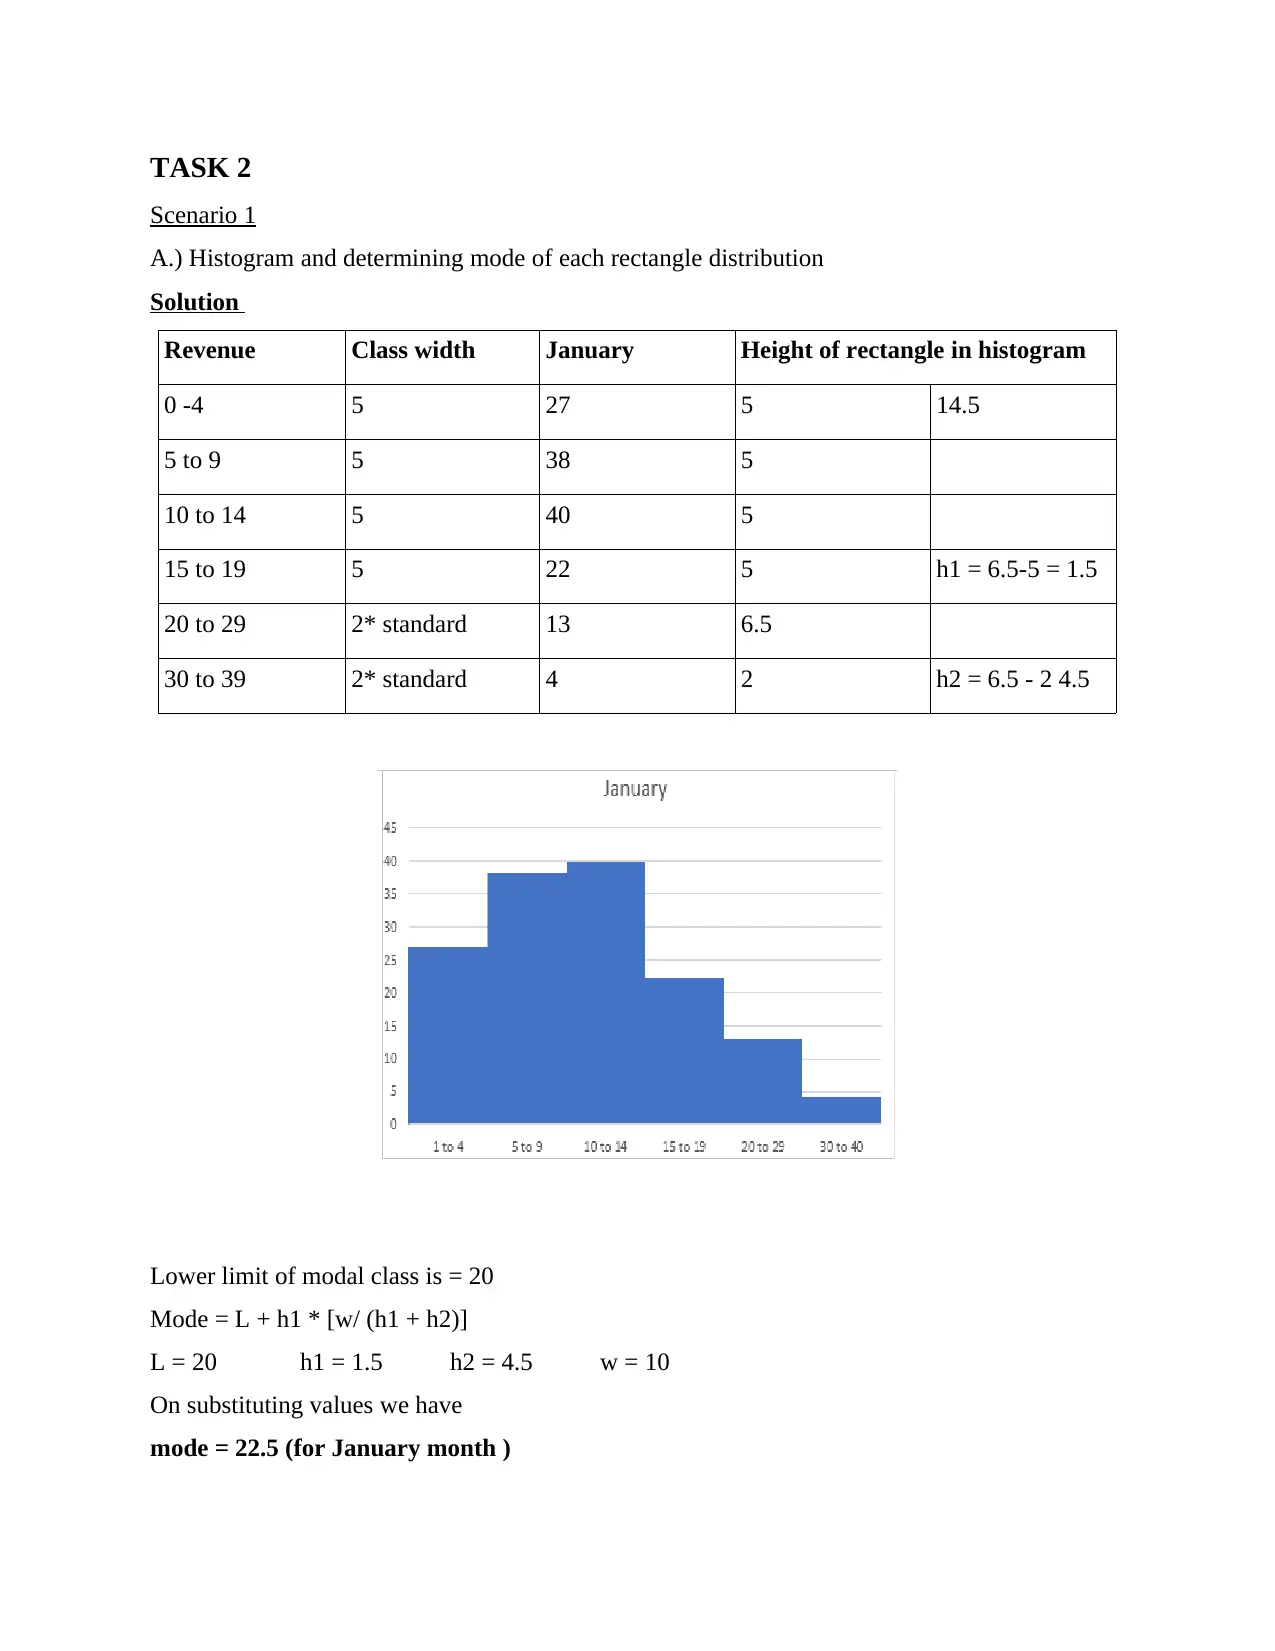
A.) Histogram and determining mode of each rectangle distribution
Solution
Revenue Class width January Height of rectangle in histogram
0 -4 5 27 5 14.5
5 to 9 5 38 5
10 to 14 5 40 5
15 to 19 5 22 5 h1 = 6.5-5 = 1.5
20 to 29 2* standard 13 6.5
30 to 39 2* standard 4 2 h2 = 6.5 - 2 4.5
Lower limit of modal class is = 20
Mode = L + h1 * [w/ (h1 + h2)]
L = 20 h1 = 1.5 h2 = 4.5 w = 10
On substituting values we have
mode = 22.5 (for January month )
Scenario 1
A.) Histogram and determining mode of each rectangle distribution
Solution
Revenue Class width January Height of rectangle in histogram
0 -4 5 27 5 14.5
5 to 9 5 38 5
10 to 14 5 40 5
15 to 19 5 22 5 h1 = 6.5-5 = 1.5
20 to 29 2* standard 13 6.5
30 to 39 2* standard 4 2 h2 = 6.5 - 2 4.5
Lower limit of modal class is = 20
Mode = L + h1 * [w/ (h1 + h2)]
L = 20 h1 = 1.5 h2 = 4.5 w = 10
On substituting values we have
mode = 22.5 (for January month )
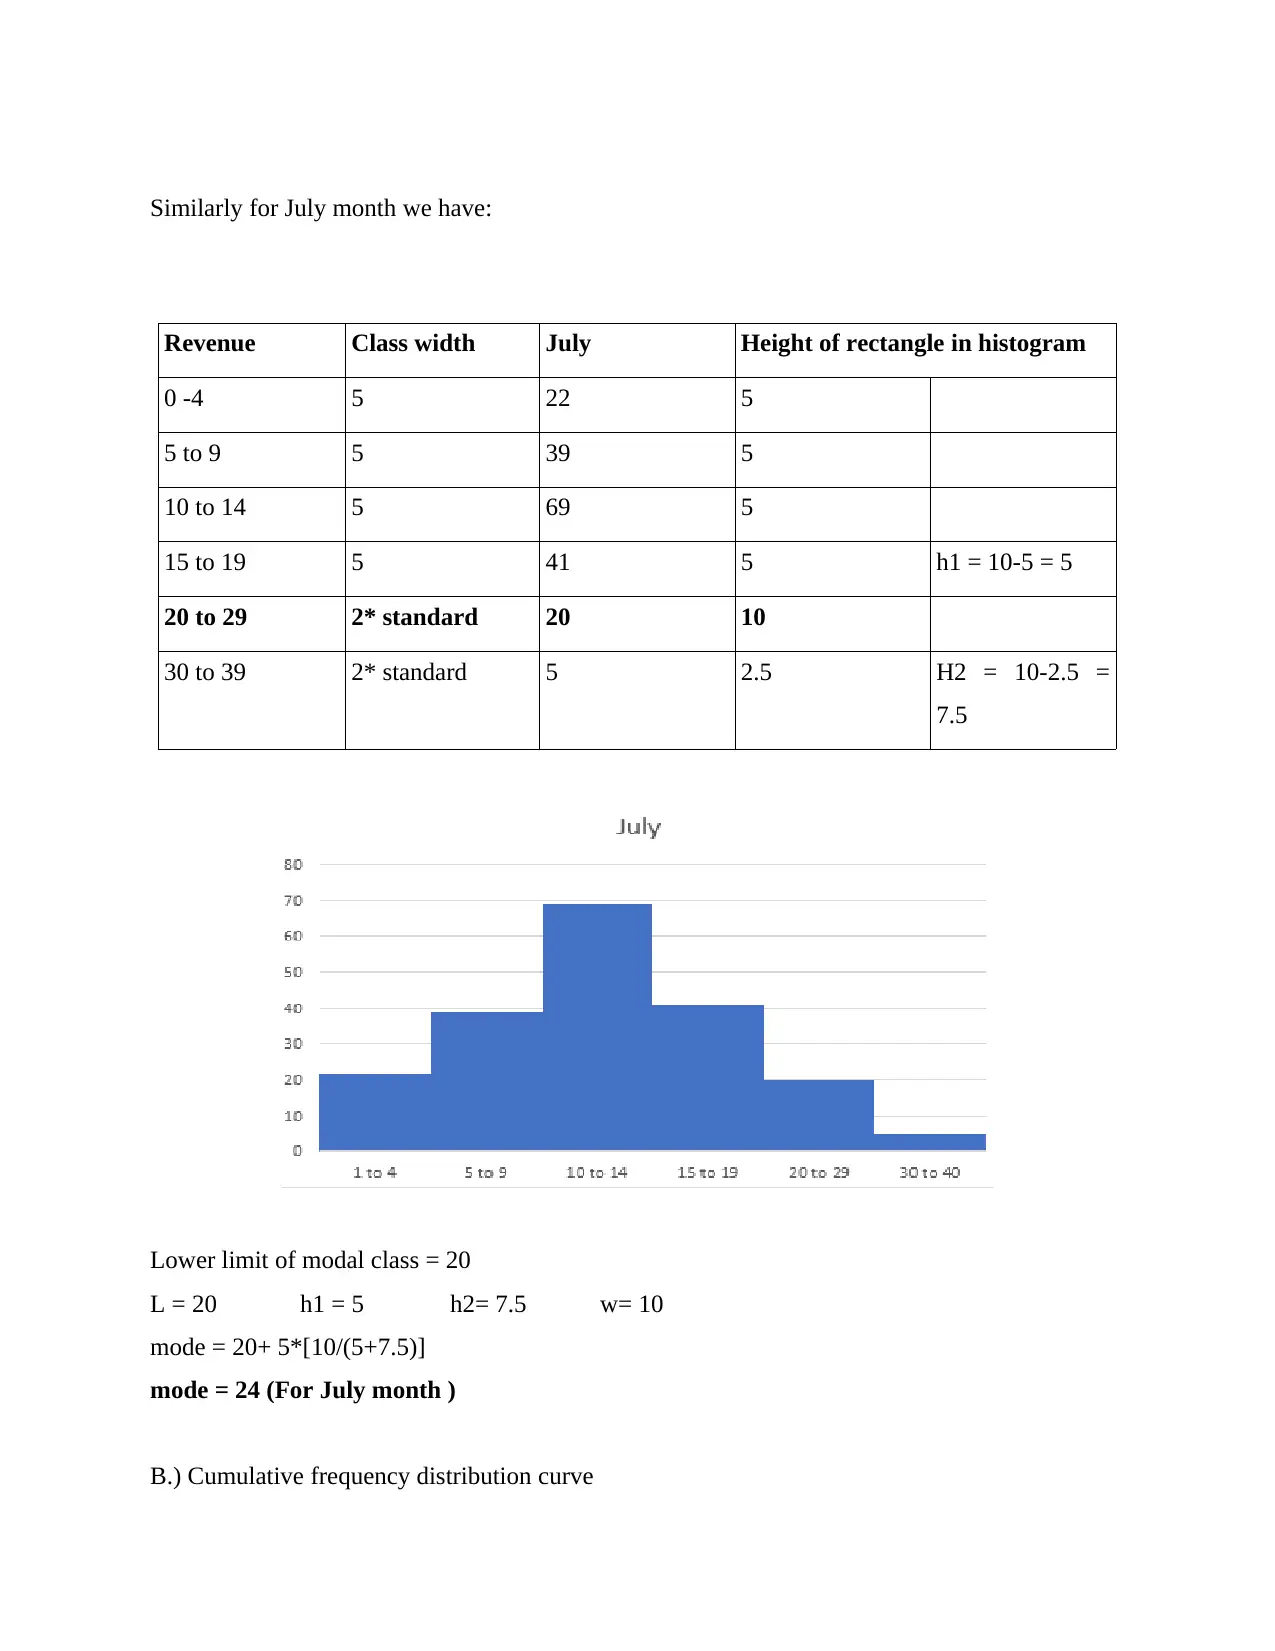
Similarly for July month we have:
Revenue Class width July Height of rectangle in histogram
0 -4 5 22 5
5 to 9 5 39 5
10 to 14 5 69 5
15 to 19 5 41 5 h1 = 10-5 = 5
20 to 29 2* standard 20 10
30 to 39 2* standard 5 2.5 H2 = 10-2.5 =
7.5
Lower limit of modal class = 20
L = 20 h1 = 5 h2= 7.5 w= 10
mode = 20+ 5*[10/(5+7.5)]
mode = 24 (For July month )
B.) Cumulative frequency distribution curve
Secure Best Marks with AI Grader
Need help grading? Try our AI Grader for instant feedback on your assignments.
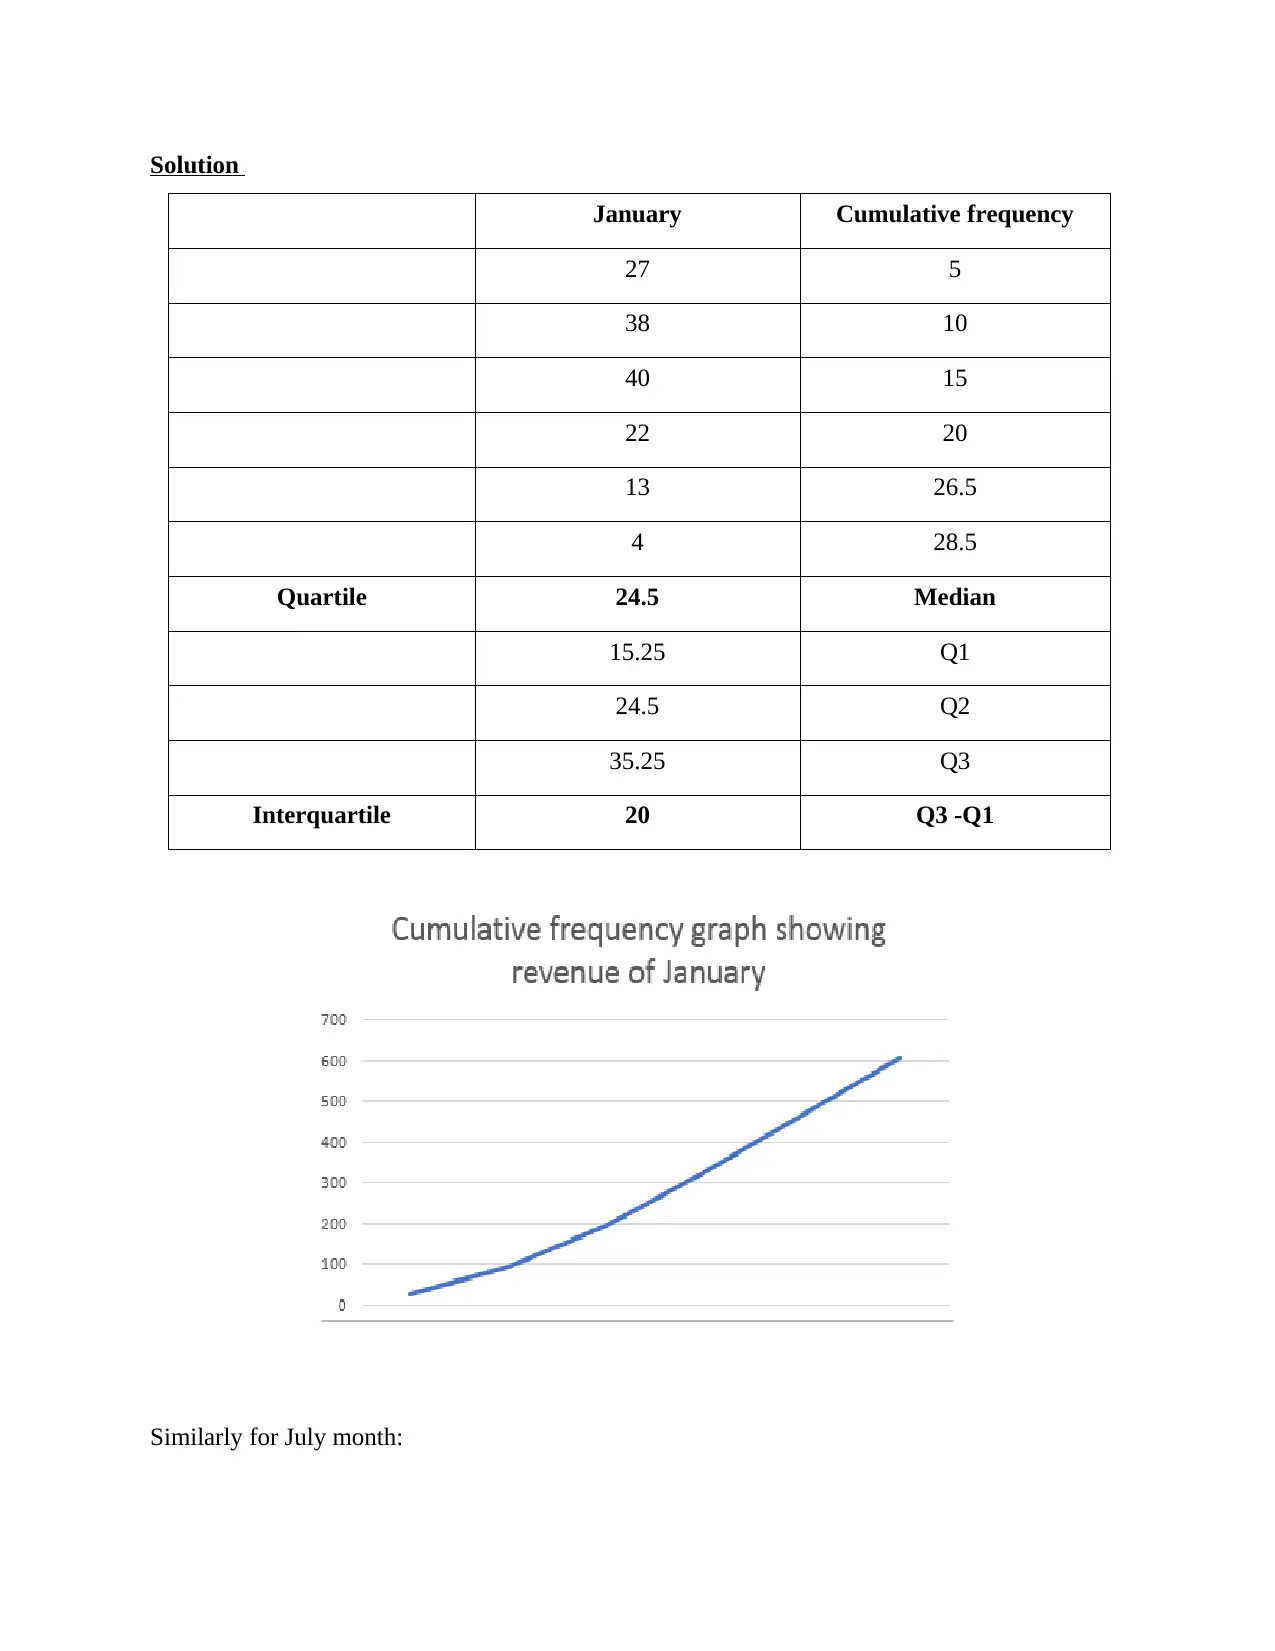
Solution
January Cumulative frequency
27 5
38 10
40 15
22 20
13 26.5
4 28.5
Quartile 24.5 Median
15.25 Q1
24.5 Q2
35.25 Q3
Interquartile 20 Q3 -Q1
Similarly for July month:
January Cumulative frequency
27 5
38 10
40 15
22 20
13 26.5
4 28.5
Quartile 24.5 Median
15.25 Q1
24.5 Q2
35.25 Q3
Interquartile 20 Q3 -Q1
Similarly for July month:
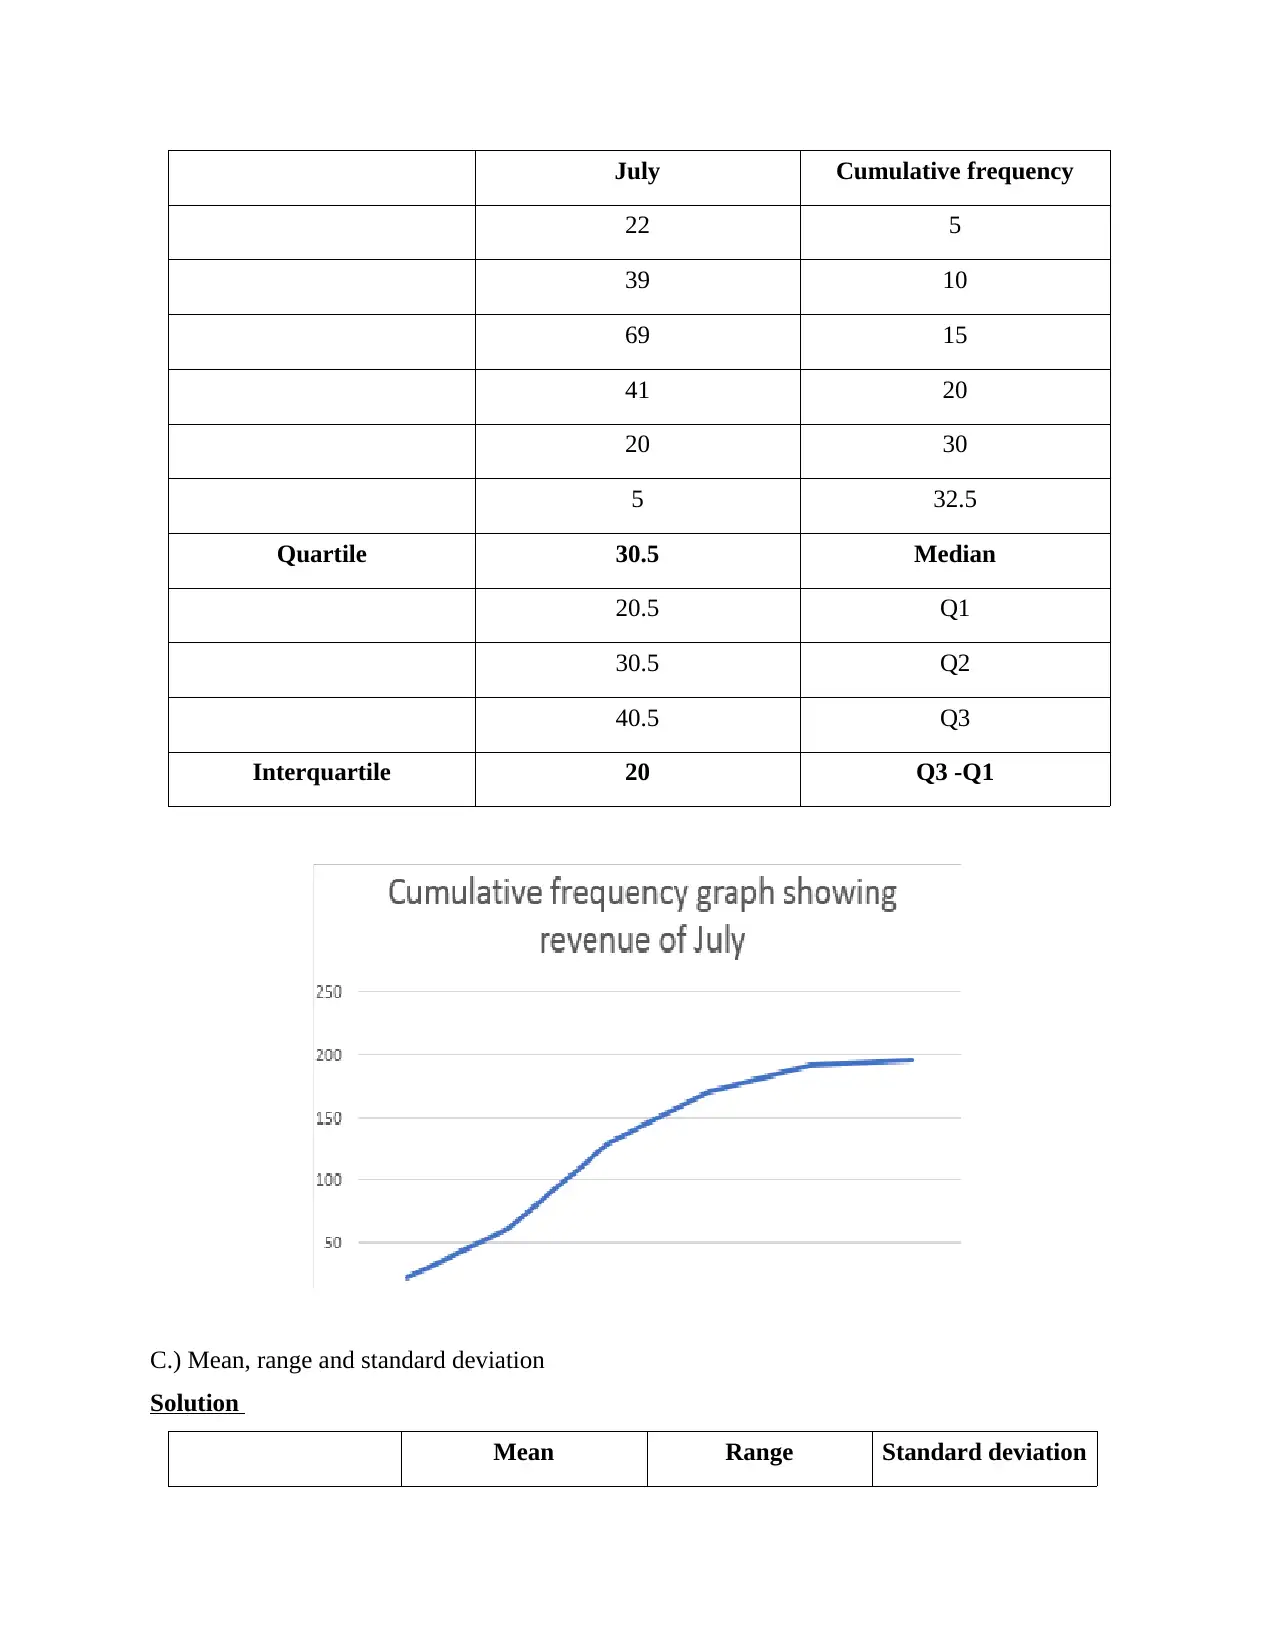
July Cumulative frequency
22 5
39 10
69 15
41 20
20 30
5 32.5
Quartile 30.5 Median
20.5 Q1
30.5 Q2
40.5 Q3
Interquartile 20 Q3 -Q1
C.) Mean, range and standard deviation
Solution
Mean Range Standard deviation
22 5
39 10
69 15
41 20
20 30
5 32.5
Quartile 30.5 Median
20.5 Q1
30.5 Q2
40.5 Q3
Interquartile 20 Q3 -Q1
C.) Mean, range and standard deviation
Solution
Mean Range Standard deviation
January 24 36 14.04
July 32.66 64 22.22
Scenario 2
(A) New Epiphyte engineering factory
Total number of bulbs: 5000
Mean = 360 days
Standard deviation = 60 days
a.) Testing that bulb life as normal distribution
Solution
The life of bulbs is assumed to be normally distributed. This assumption can be tested by
using normality test with distribution is in symmetric bell shaped and mean value = 0 while
standard deviation is = 1. For the normal distribution the skewness must lie in the range + and -2
while Kurtosis has specific range value within + and -7. The graphical method such as Q-Q plot
can also be used in which both expected and observed values are plotted on the graph. If plotted
value vary through straight line then it assumption is considered to be false and it is not
distributed normally otherwise it is normally distributed.
b.) Allowable interval between replacement
Solution
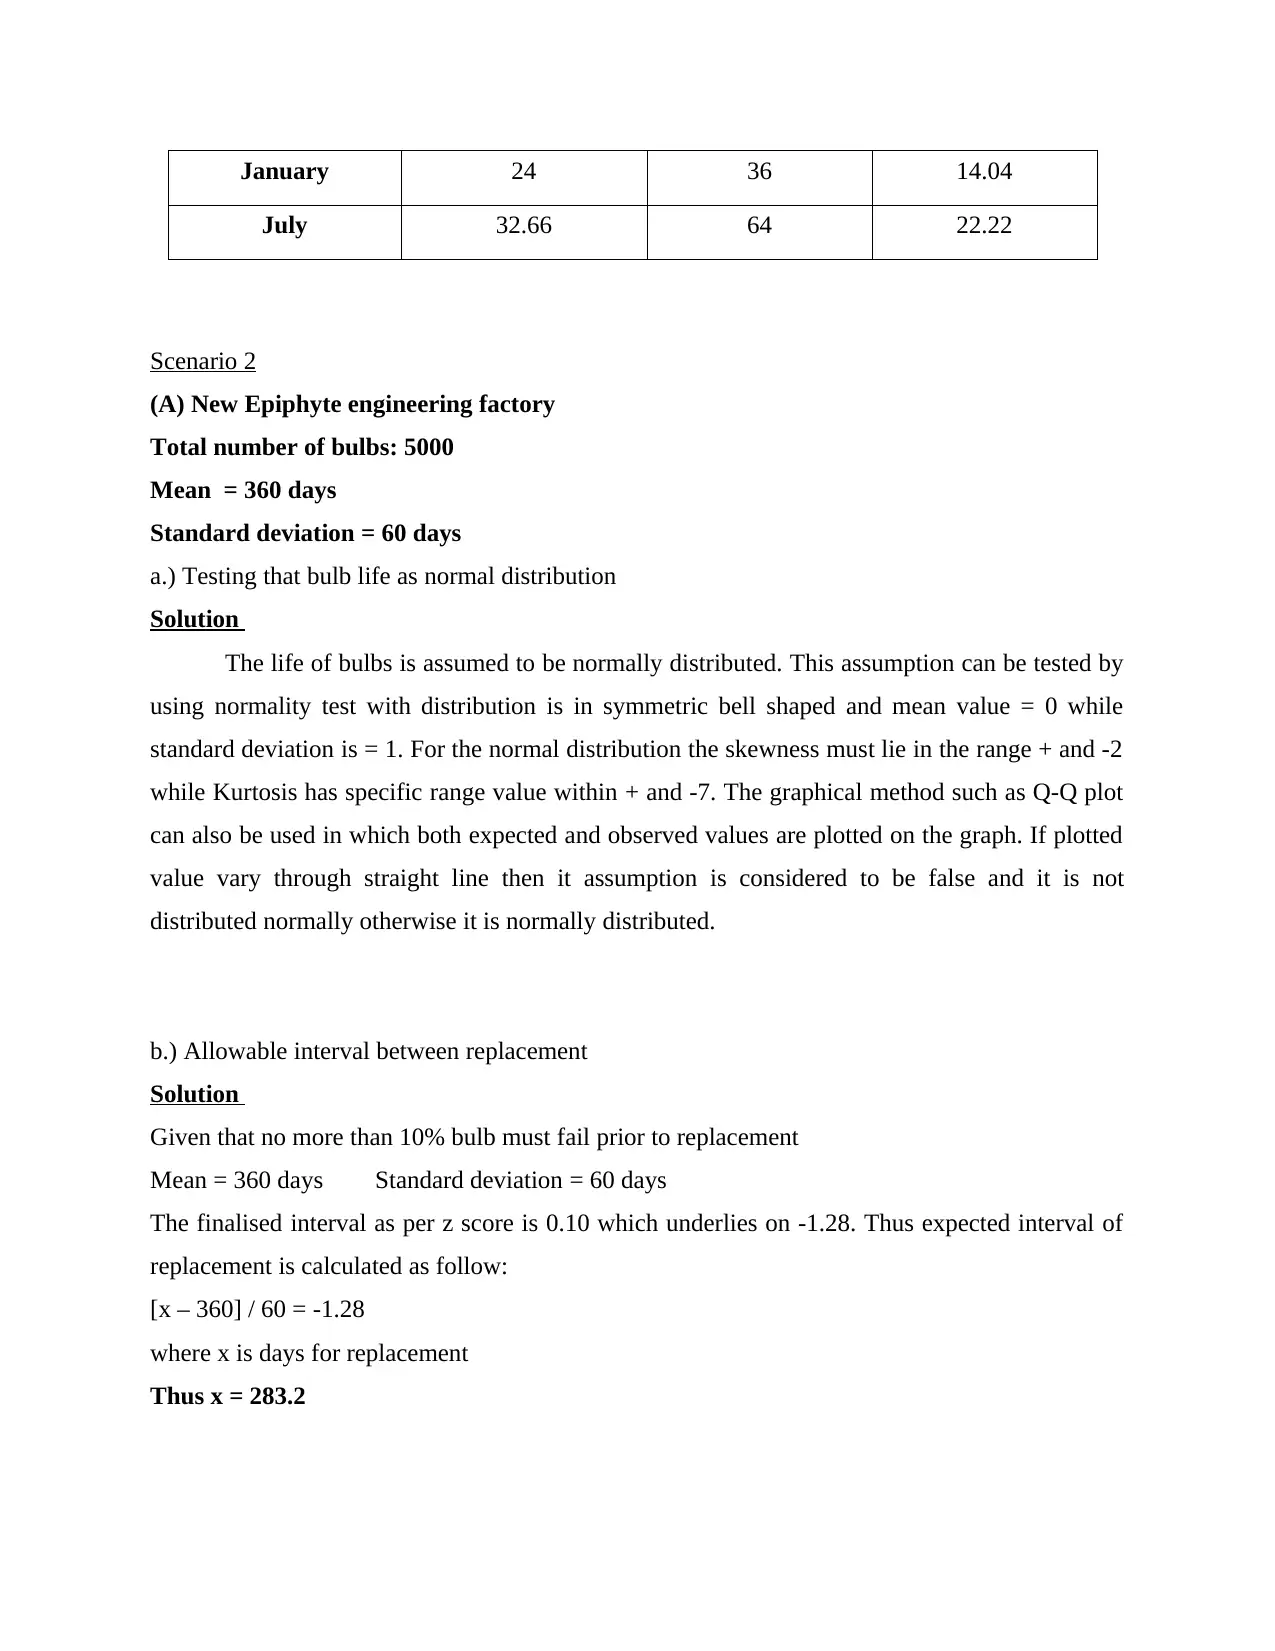
Given that no more than 10% bulb must fail prior to replacement
Mean = 360 days Standard deviation = 60 days
The finalised interval as per z score is 0.10 which underlies on -1.28. Thus expected interval of
replacement is calculated as follow:
[x – 360] / 60 = -1.28
where x is days for replacement
Thus x = 283.2
July 32.66 64 22.22
Scenario 2
(A) New Epiphyte engineering factory
Total number of bulbs: 5000
Mean = 360 days
Standard deviation = 60 days
a.) Testing that bulb life as normal distribution
Solution
The life of bulbs is assumed to be normally distributed. This assumption can be tested by
using normality test with distribution is in symmetric bell shaped and mean value = 0 while
standard deviation is = 1. For the normal distribution the skewness must lie in the range + and -2
while Kurtosis has specific range value within + and -7. The graphical method such as Q-Q plot
can also be used in which both expected and observed values are plotted on the graph. If plotted
value vary through straight line then it assumption is considered to be false and it is not
distributed normally otherwise it is normally distributed.
b.) Allowable interval between replacement
Solution
Given that no more than 10% bulb must fail prior to replacement
Mean = 360 days Standard deviation = 60 days
The finalised interval as per z score is 0.10 which underlies on -1.28. Thus expected interval of
replacement is calculated as follow:
[x – 360] / 60 = -1.28
where x is days for replacement
Thus x = 283.2
Paraphrase This Document
Need a fresh take? Get an instant paraphrase of this document with our AI Paraphraser
c.) Practical consideration affecting replacement policy
Solution
The CGL policies gives coverage for defective work such as property damage due to
installation of defective product as well as for exposure. Similarly electricity supply must be
stable so that test can be implemented along with necessary measures mandatory for the
uninterrupted supply. In addition to this sufficient number of species for the testing at the site is
also justified. In the above case also z score has been used to justify the expected outcome.
d.) Effect of replacement time for type B bulbs
Solution
Mean life time for type B bulb = 450 days
Standard deviation = 60 days
- 1.28 = (x -450) / 60
x = replacement days = 373.2 days
Solution
The CGL policies gives coverage for defective work such as property damage due to
installation of defective product as well as for exposure. Similarly electricity supply must be
stable so that test can be implemented along with necessary measures mandatory for the
uninterrupted supply. In addition to this sufficient number of species for the testing at the site is
also justified. In the above case also z score has been used to justify the expected outcome.
d.) Effect of replacement time for type B bulbs
Solution
Mean life time for type B bulb = 450 days
Standard deviation = 60 days
- 1.28 = (x -450) / 60
x = replacement days = 373.2 days
e.) Preference for type B bulb in comparison to existing type A bulb
Solution
Despite 25% increment in the cost of bulb type A, the replacement time comparison for
both bulb A and B is provided as below:
Type A (360 days) = 283 days
Type b (450 days) = 373.2 days
Impact = 31.87%
Thus 25% cost increment is not preferable as it is already increasing by 31 days so replacement
must be at average of 360 days and standard deviation of 60 days with less than 10%
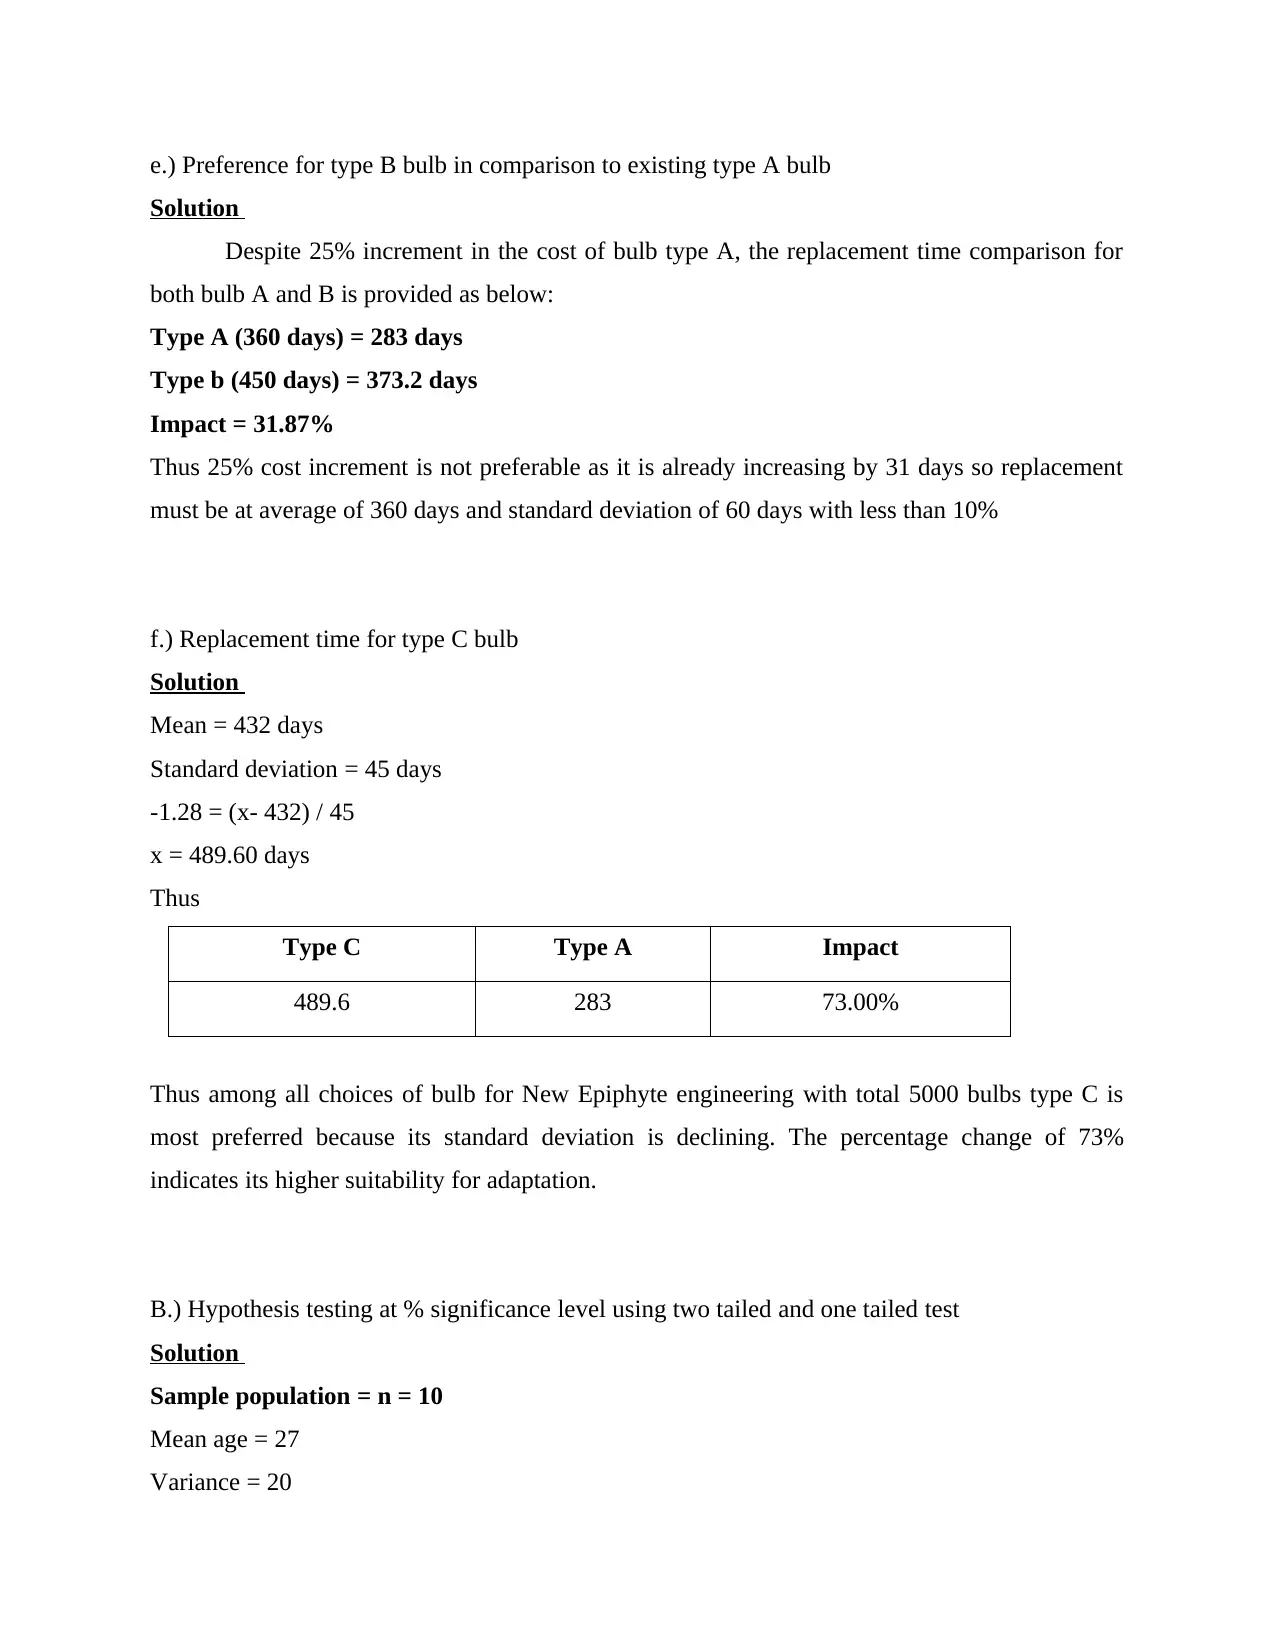
f.) Replacement time for type C bulb
Solution
Mean = 432 days
Standard deviation = 45 days
-1.28 = (x- 432) / 45
x = 489.60 days
Thus
Type C Type A Impact
489.6 283 73.00%
Thus among all choices of bulb for New Epiphyte engineering with total 5000 bulbs type C is
most preferred because its standard deviation is declining. The percentage change of 73%
indicates its higher suitability for adaptation.
B.) Hypothesis testing at % significance level using two tailed and one tailed test
Solution
Sample population = n = 10
Mean age = 27
Variance = 20
Solution
Despite 25% increment in the cost of bulb type A, the replacement time comparison for
both bulb A and B is provided as below:
Type A (360 days) = 283 days
Type b (450 days) = 373.2 days
Impact = 31.87%
Thus 25% cost increment is not preferable as it is already increasing by 31 days so replacement
must be at average of 360 days and standard deviation of 60 days with less than 10%
f.) Replacement time for type C bulb
Solution
Mean = 432 days
Standard deviation = 45 days
-1.28 = (x- 432) / 45
x = 489.60 days
Thus
Type C Type A Impact
489.6 283 73.00%
Thus among all choices of bulb for New Epiphyte engineering with total 5000 bulbs type C is
most preferred because its standard deviation is declining. The percentage change of 73%
indicates its higher suitability for adaptation.
B.) Hypothesis testing at % significance level using two tailed and one tailed test
Solution
Sample population = n = 10
Mean age = 27
Variance = 20
Significance level = 0.5
Assumptions:
Simple random sample
Normally distributed population
Hypothesis
H0: = 30
H1: is not equal to 30
Test statistic
Variance is known so implication of z test statistic:
Test statistic distribution:
If assumptions are true then H0 is true and then test statistic follow standard normal
distribution. Thus hypothesis testing and z score calculation are as follows:
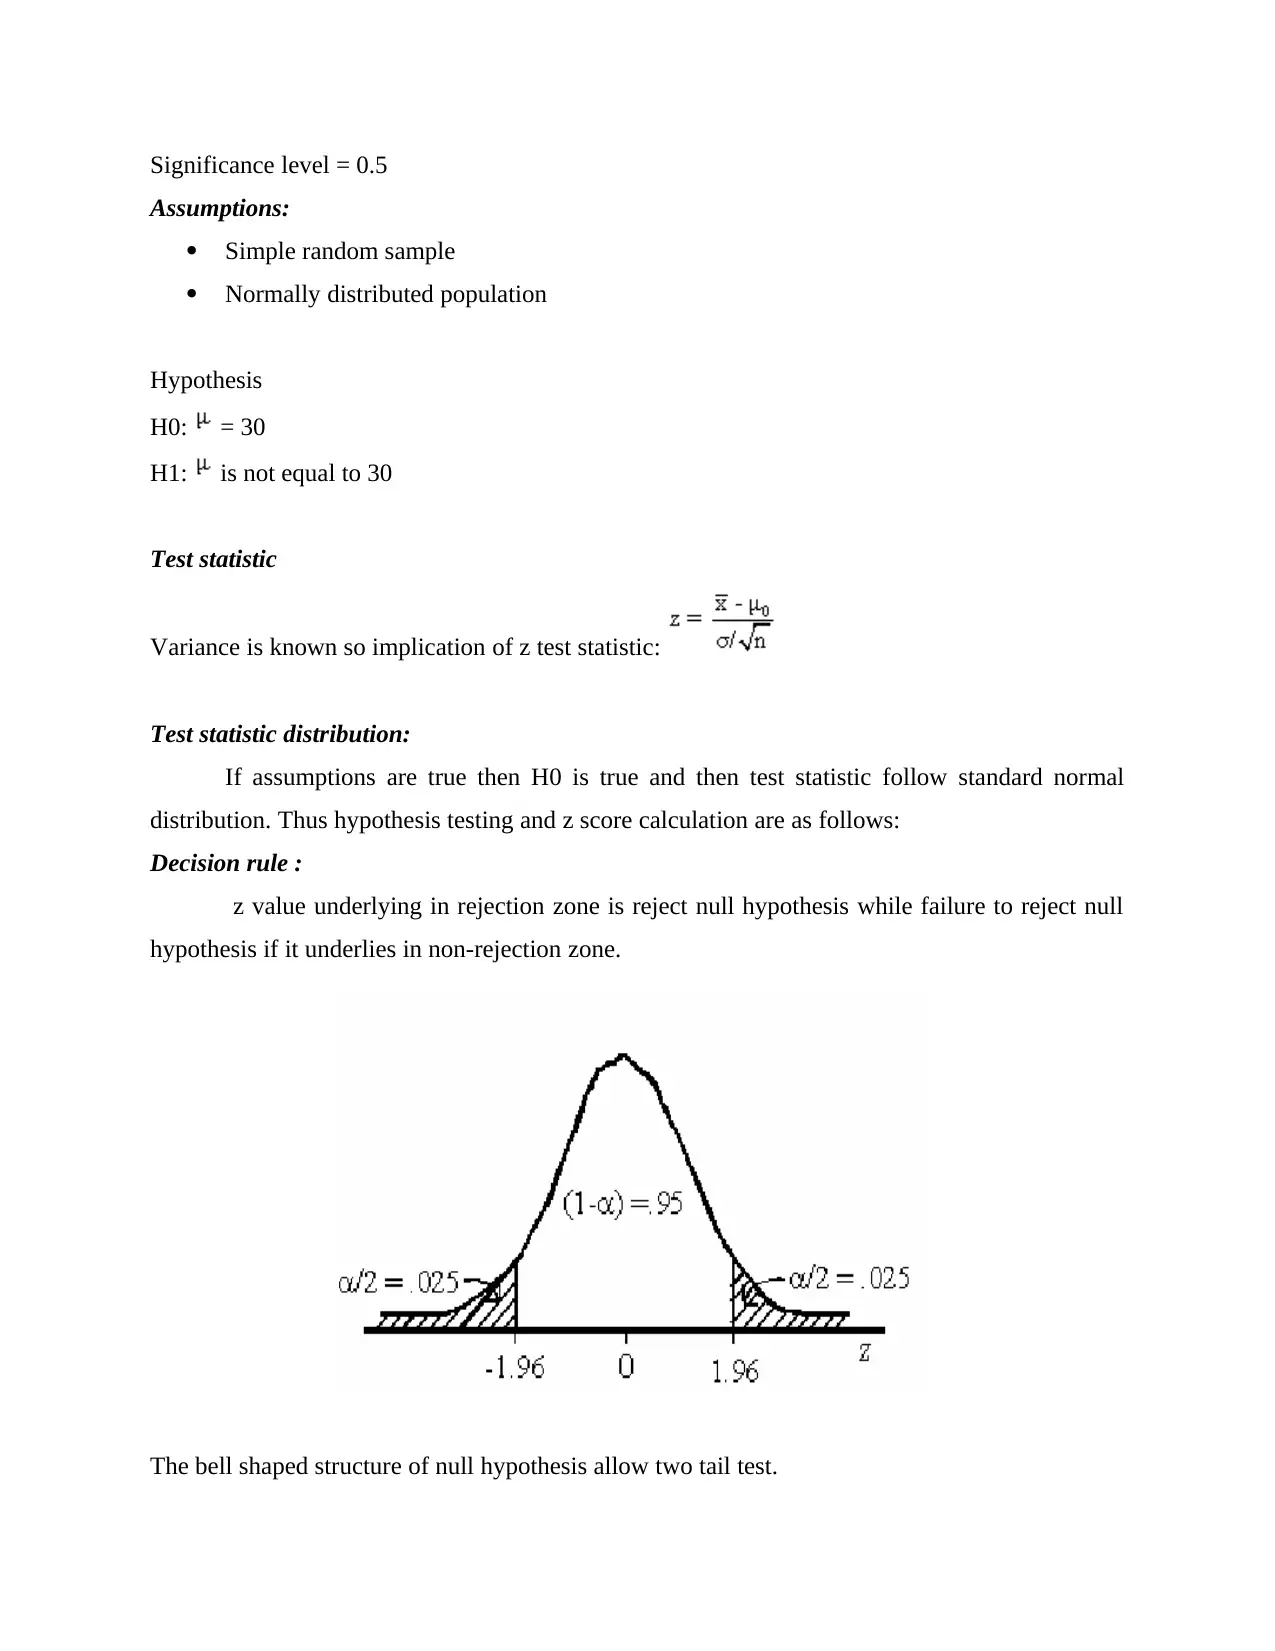
Decision rule :
z value underlying in rejection zone is reject null hypothesis while failure to reject null
hypothesis if it underlies in non-rejection zone.
The bell shaped structure of null hypothesis allow two tail test.
Assumptions:
Simple random sample
Normally distributed population
Hypothesis
H0: = 30
H1: is not equal to 30
Test statistic
Variance is known so implication of z test statistic:
Test statistic distribution:
If assumptions are true then H0 is true and then test statistic follow standard normal
distribution. Thus hypothesis testing and z score calculation are as follows:
Decision rule :
z value underlying in rejection zone is reject null hypothesis while failure to reject null
hypothesis if it underlies in non-rejection zone.
The bell shaped structure of null hypothesis allow two tail test.
Secure Best Marks with AI Grader
Need help grading? Try our AI Grader for instant feedback on your assignments.
For z>= 1.96 or z<= -1.96 rejection of null hypothesis is done.
Calculation of test statistic:
z = [27-30] / √(20/10) = -2.12
Statistial decision
Rejection of null hypothesis because z = -2.12 lies in rejection level as value is
considerable at 0.05 level.
Conclusion
It can be concluded taht is not equal to 30 and P = 0.0340.
Also z = -2.12 corresponds to area of 0.0170 because there exist two parts of rejectio zone in two
tail test, although p value is double of 0.0340.
One tail test
n = 10 mean age = 27 variance = 20
Standard deviatio = 0.5
Assumptions:
Simple random sampling
Normally distributed population
Hypothesis
H0: =30
H1: not equals to 30
Test statistic:
Test statistic distribution and decision rule
If assumption is true then H0 is true so statistic follow normal distribution and z score is
calclulated for testing hypothesis.
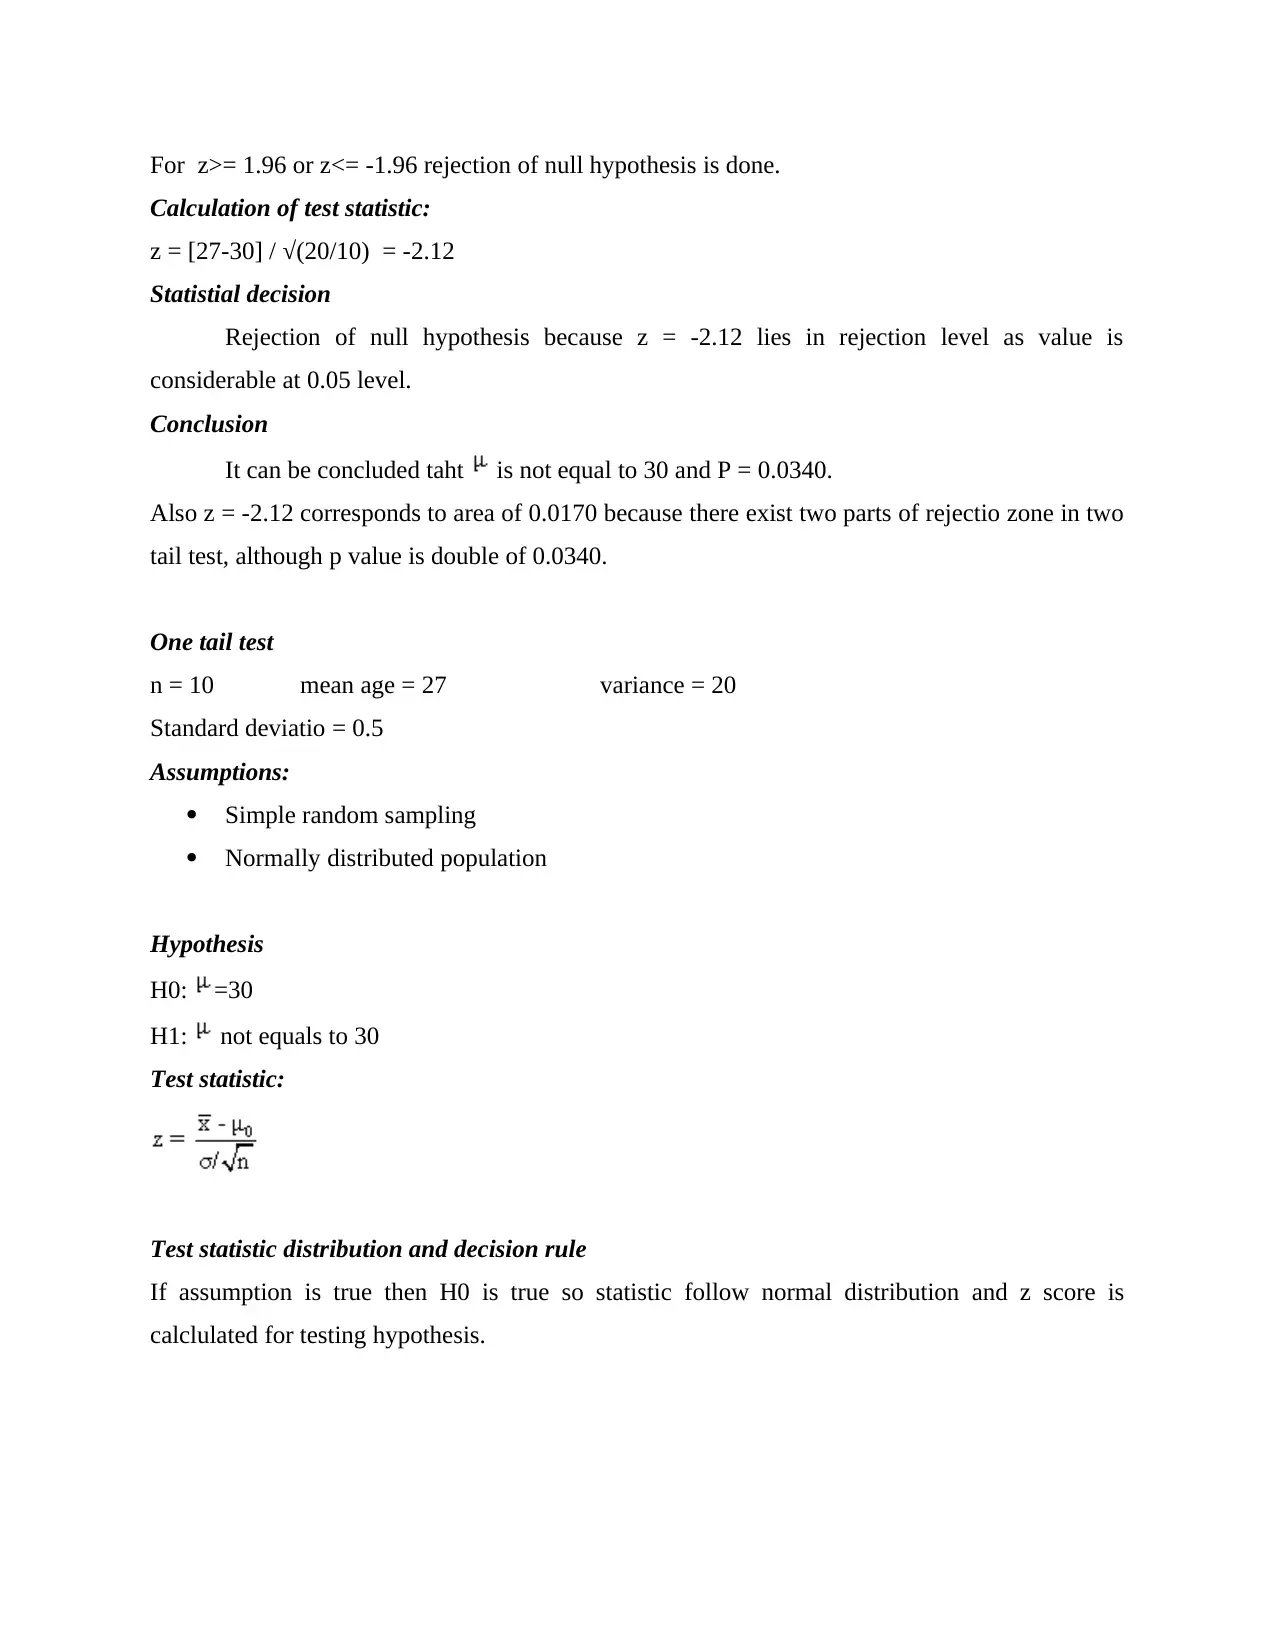
Significance level = 0.05 and entire rejection zone is on left hand side, critical value will be
1.645. Rejecting H0 is z < -1.645
Calculation
z = [27-30] / √(20/10) = -2.12
Statistical decision
Since -2.12 < -1.645, null hypothesis is rejected.
Thus it can be concluded that < 30 and p = 0.0170 because it is one tail test not two tail test.
TASK 3
Scenario 1
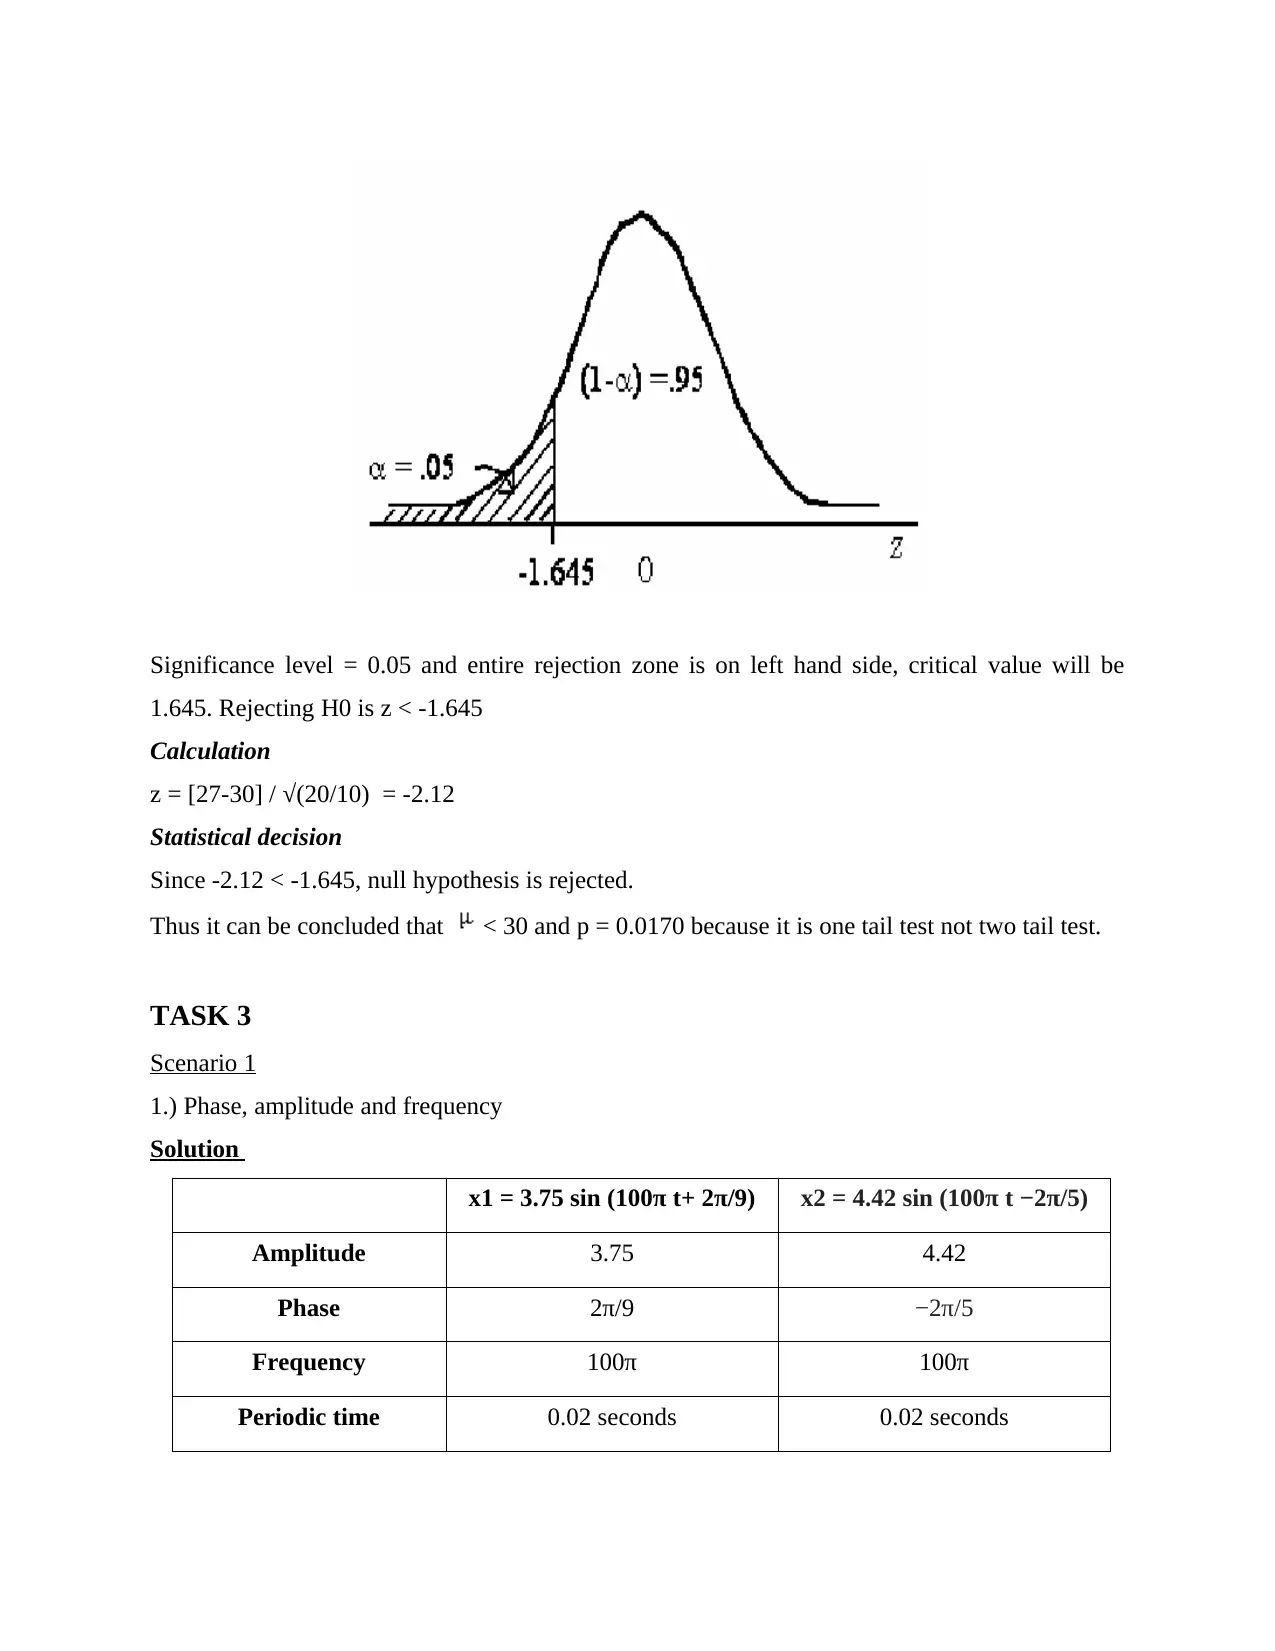
1.) Phase, amplitude and frequency
Solution
x1 = 3.75 sin (100π t+ 2π/9) x2 = 4.42 sin (100π t −2π/5)
Amplitude 3.75 4.42
Phase 2π/9 −2π/5
Frequency 100π 100π
Periodic time 0.02 seconds 0.02 seconds
1.645. Rejecting H0 is z < -1.645
Calculation
z = [27-30] / √(20/10) = -2.12
Statistical decision
Since -2.12 < -1.645, null hypothesis is rejected.
Thus it can be concluded that < 30 and p = 0.0170 because it is one tail test not two tail test.
TASK 3
Scenario 1
1.) Phase, amplitude and frequency
Solution
x1 = 3.75 sin (100π t+ 2π/9) x2 = 4.42 sin (100π t −2π/5)
Amplitude 3.75 4.42
Phase 2π/9 −2π/5
Frequency 100π 100π
Periodic time 0.02 seconds 0.02 seconds
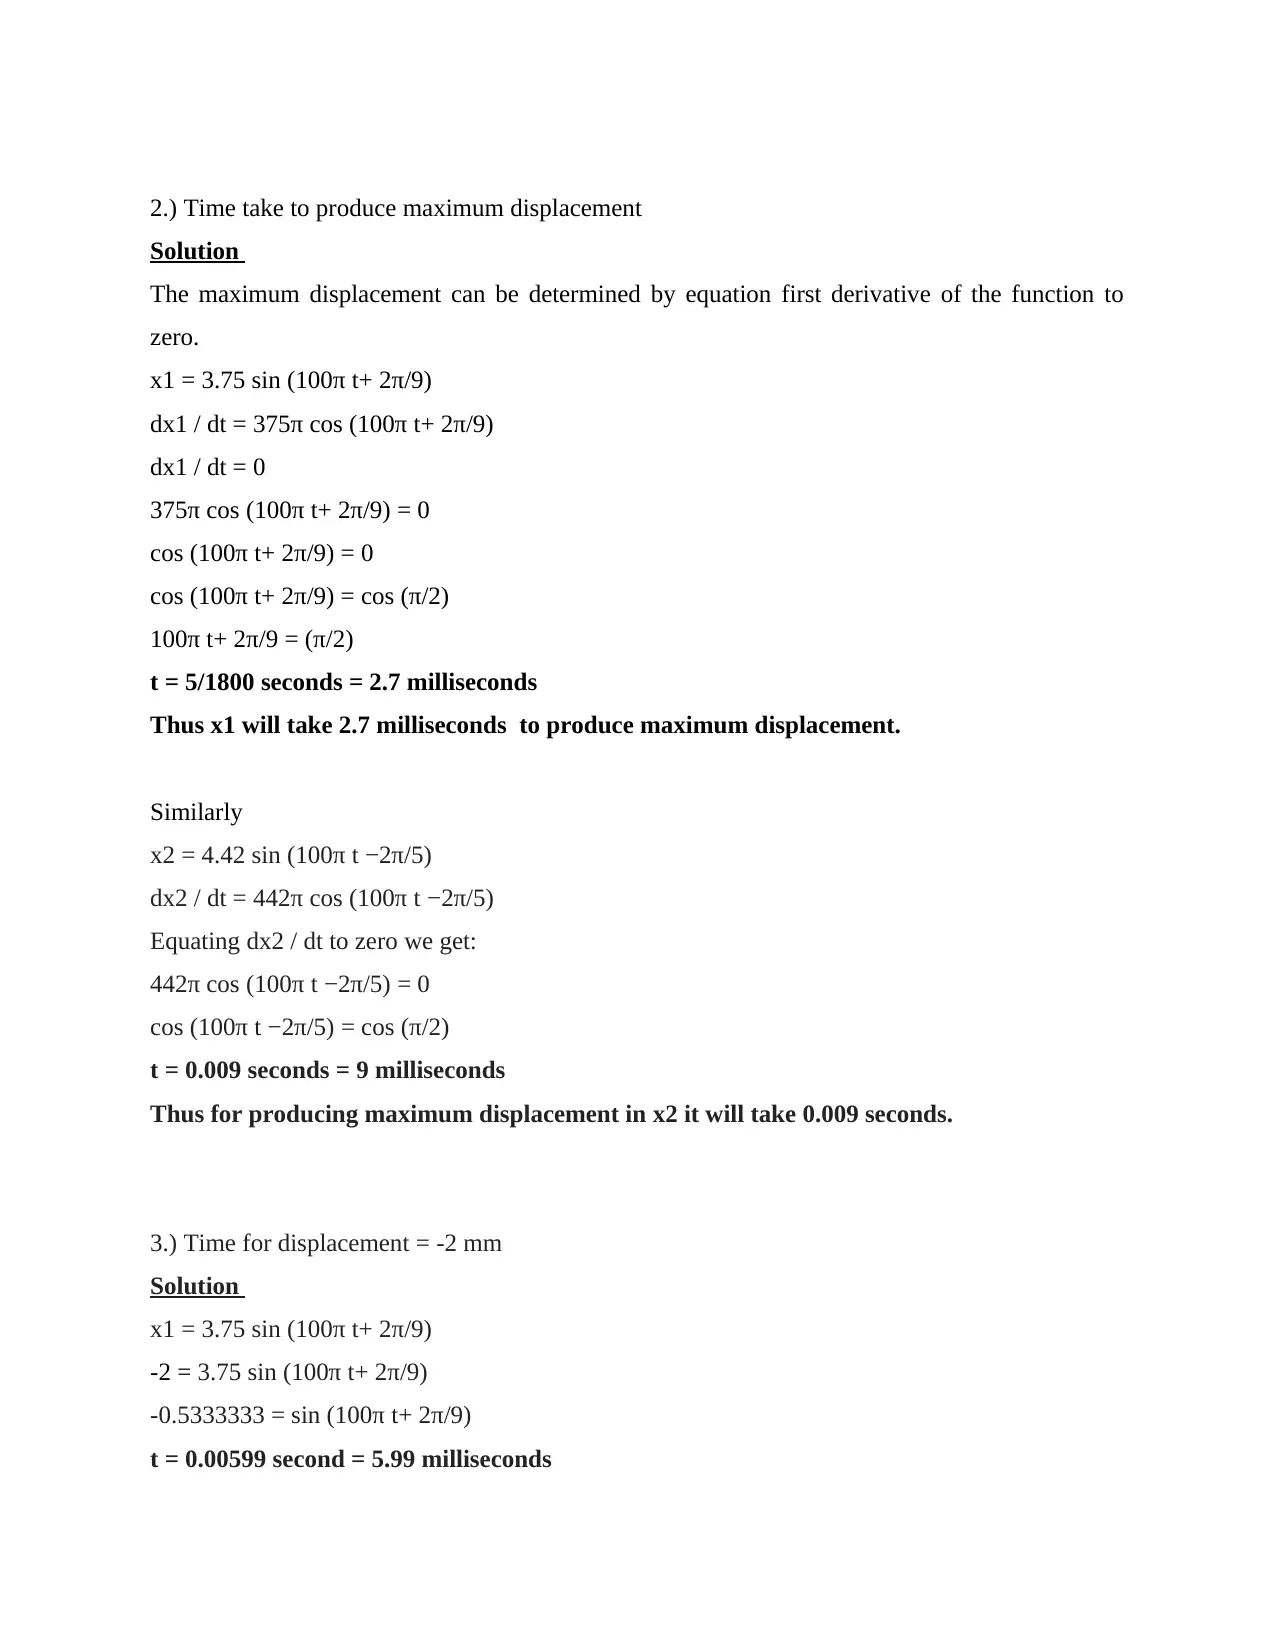
2.) Time take to produce maximum displacement
Solution
The maximum displacement can be determined by equation first derivative of the function to
zero.
x1 = 3.75 sin (100π t+ 2π/9)
dx1 / dt = 375π cos (100π t+ 2π/9)
dx1 / dt = 0
375π cos (100π t+ 2π/9) = 0
cos (100π t+ 2π/9) = 0
cos (100π t+ 2π/9) = cos (π/2)
100π t+ 2π/9 = (π/2)
t = 5/1800 seconds = 2.7 milliseconds
Thus x1 will take 2.7 milliseconds to produce maximum displacement.
Similarly
x2 = 4.42 sin (100π t −2π/5)
dx2 / dt = 442π cos (100π t −2π/5)
Equating dx2 / dt to zero we get:
442π cos (100π t −2π/5) = 0
cos (100π t −2π/5) = cos (π/2)
t = 0.009 seconds = 9 milliseconds
Thus for producing maximum displacement in x2 it will take 0.009 seconds.
3.) Time for displacement = -2 mm
Solution
x1 = 3.75 sin (100π t+ 2π/9)
-2 = 3.75 sin (100π t+ 2π/9)
-0.5333333 = sin (100π t+ 2π/9)
t = 0.00599 second = 5.99 milliseconds
Solution
The maximum displacement can be determined by equation first derivative of the function to
zero.
x1 = 3.75 sin (100π t+ 2π/9)
dx1 / dt = 375π cos (100π t+ 2π/9)
dx1 / dt = 0
375π cos (100π t+ 2π/9) = 0
cos (100π t+ 2π/9) = 0
cos (100π t+ 2π/9) = cos (π/2)
100π t+ 2π/9 = (π/2)
t = 5/1800 seconds = 2.7 milliseconds
Thus x1 will take 2.7 milliseconds to produce maximum displacement.
Similarly
x2 = 4.42 sin (100π t −2π/5)
dx2 / dt = 442π cos (100π t −2π/5)
Equating dx2 / dt to zero we get:
442π cos (100π t −2π/5) = 0
cos (100π t −2π/5) = cos (π/2)
t = 0.009 seconds = 9 milliseconds
Thus for producing maximum displacement in x2 it will take 0.009 seconds.
3.) Time for displacement = -2 mm
Solution
x1 = 3.75 sin (100π t+ 2π/9)
-2 = 3.75 sin (100π t+ 2π/9)
-0.5333333 = sin (100π t+ 2π/9)
t = 0.00599 second = 5.99 milliseconds
Paraphrase This Document
Need a fresh take? Get an instant paraphrase of this document with our AI Paraphraser
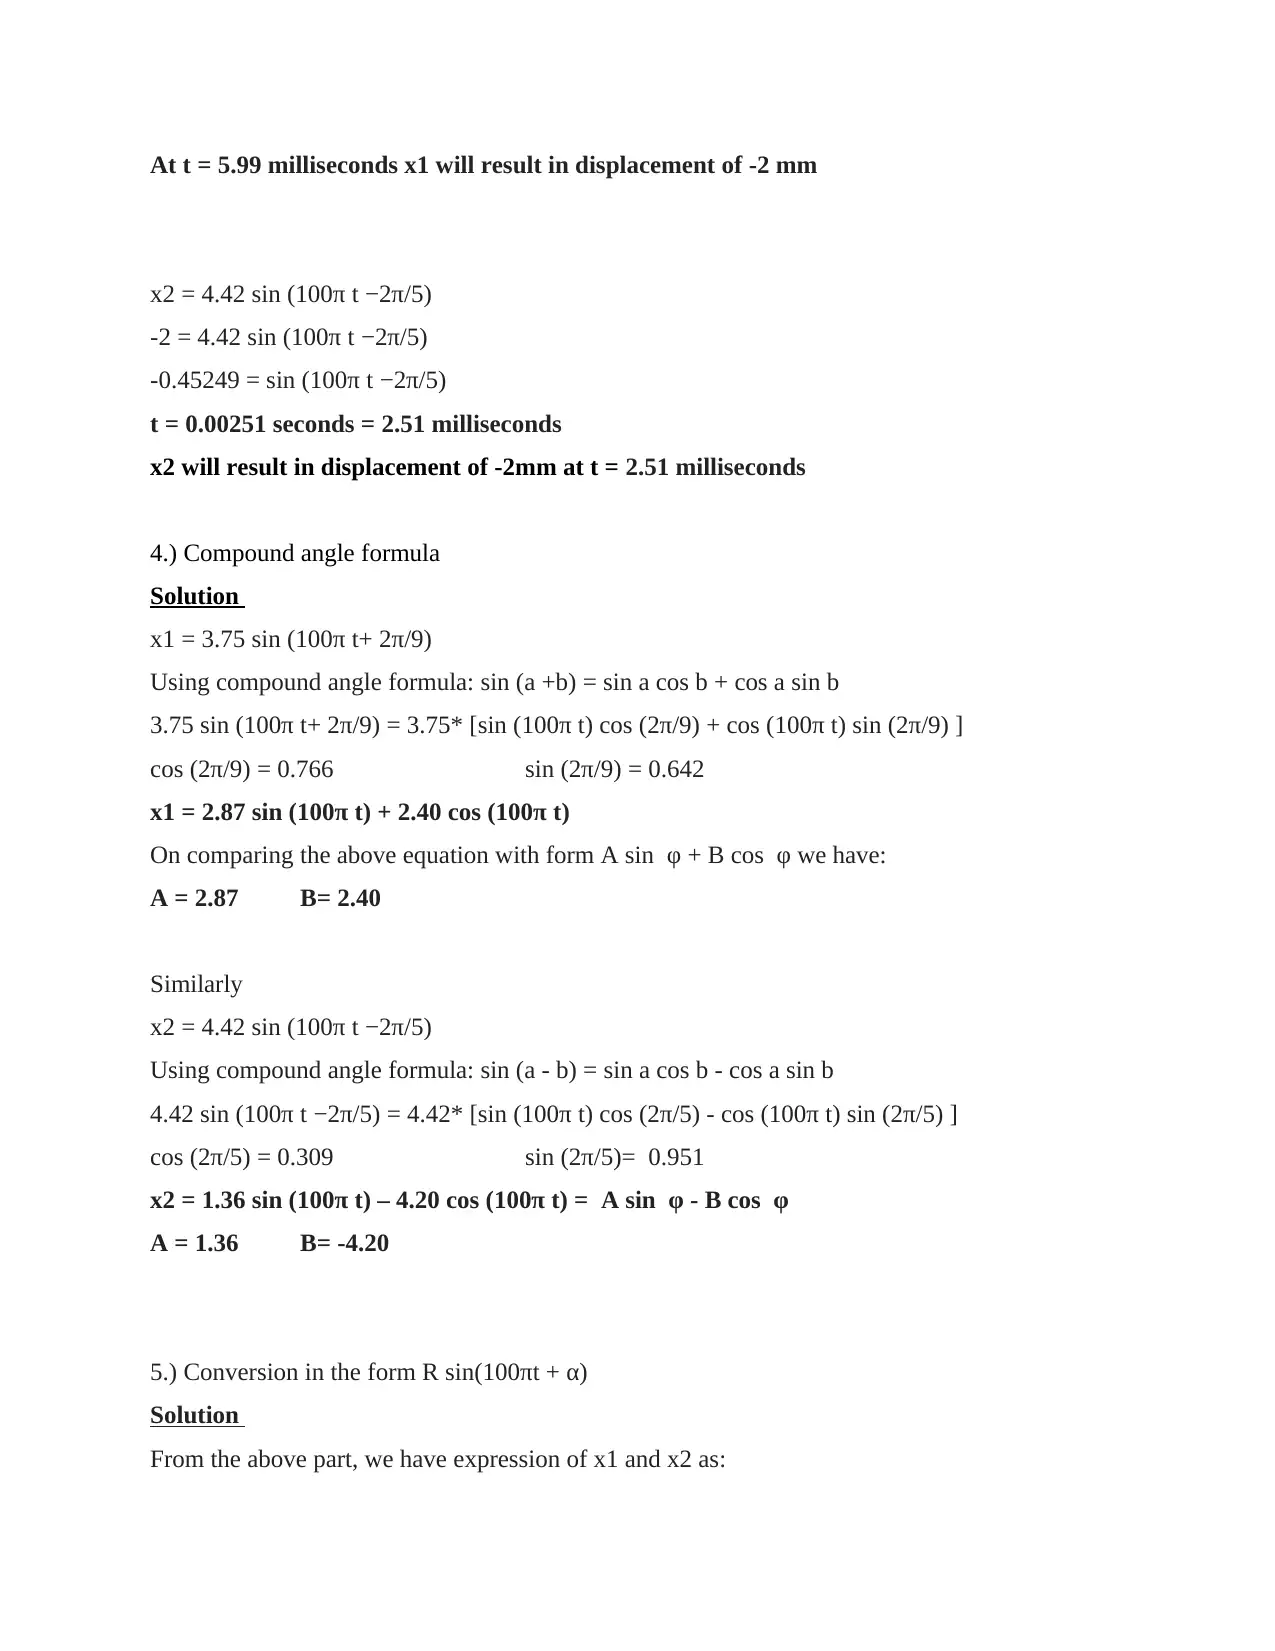
At t = 5.99 milliseconds x1 will result in displacement of -2 mm
x2 = 4.42 sin (100π t −2π/5)
-2 = 4.42 sin (100π t −2π/5)
-0.45249 = sin (100π t −2π/5)
t = 0.00251 seconds = 2.51 milliseconds
x2 will result in displacement of -2mm at t = 2.51 milliseconds
4.) Compound angle formula
Solution
x1 = 3.75 sin (100π t+ 2π/9)
Using compound angle formula: sin (a +b) = sin a cos b + cos a sin b
3.75 sin (100π t+ 2π/9) = 3.75* [sin (100π t) cos (2π/9) + cos (100π t) sin (2π/9) ]
cos (2π/9) = 0.766 sin (2π/9) = 0.642
x1 = 2.87 sin (100π t) + 2.40 cos (100π t)
On comparing the above equation with form A sin φ + B cos φ we have:
A = 2.87 B= 2.40
Similarly
x2 = 4.42 sin (100π t −2π/5)
Using compound angle formula: sin (a - b) = sin a cos b - cos a sin b
4.42 sin (100π t −2π/5) = 4.42* [sin (100π t) cos (2π/5) - cos (100π t) sin (2π/5) ]
cos (2π/5) = 0.309 sin (2π/5)= 0.951
x2 = 1.36 sin (100π t) – 4.20 cos (100π t) = A sin φ - B cos φ
A = 1.36 B= -4.20
5.) Conversion in the form R sin(100πt + α)
Solution
From the above part, we have expression of x1 and x2 as:
x2 = 4.42 sin (100π t −2π/5)
-2 = 4.42 sin (100π t −2π/5)
-0.45249 = sin (100π t −2π/5)
t = 0.00251 seconds = 2.51 milliseconds
x2 will result in displacement of -2mm at t = 2.51 milliseconds
4.) Compound angle formula
Solution
x1 = 3.75 sin (100π t+ 2π/9)
Using compound angle formula: sin (a +b) = sin a cos b + cos a sin b
3.75 sin (100π t+ 2π/9) = 3.75* [sin (100π t) cos (2π/9) + cos (100π t) sin (2π/9) ]
cos (2π/9) = 0.766 sin (2π/9) = 0.642
x1 = 2.87 sin (100π t) + 2.40 cos (100π t)
On comparing the above equation with form A sin φ + B cos φ we have:
A = 2.87 B= 2.40
Similarly
x2 = 4.42 sin (100π t −2π/5)
Using compound angle formula: sin (a - b) = sin a cos b - cos a sin b
4.42 sin (100π t −2π/5) = 4.42* [sin (100π t) cos (2π/5) - cos (100π t) sin (2π/5) ]
cos (2π/5) = 0.309 sin (2π/5)= 0.951
x2 = 1.36 sin (100π t) – 4.20 cos (100π t) = A sin φ - B cos φ
A = 1.36 B= -4.20
5.) Conversion in the form R sin(100πt + α)
Solution
From the above part, we have expression of x1 and x2 as:
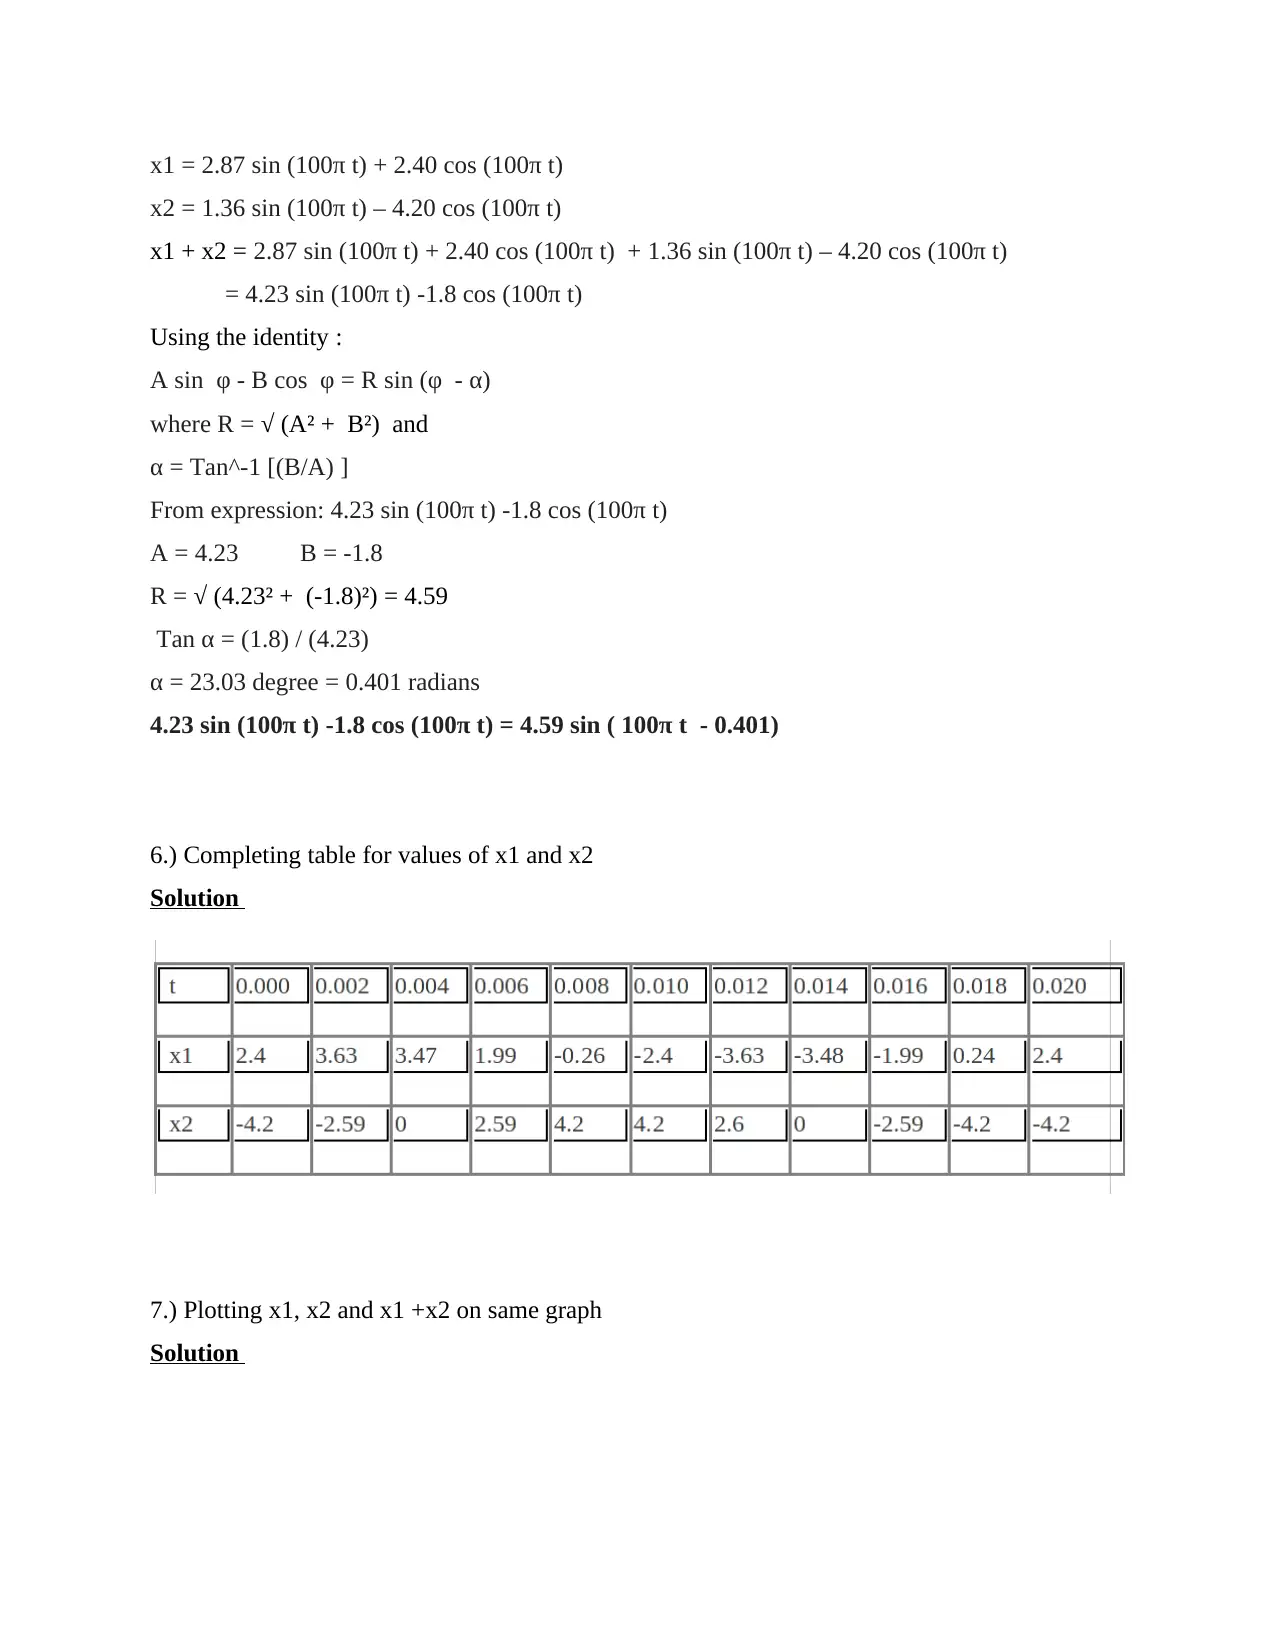
x1 = 2.87 sin (100π t) + 2.40 cos (100π t)
x2 = 1.36 sin (100π t) – 4.20 cos (100π t)
x1 + x2 = 2.87 sin (100π t) + 2.40 cos (100π t) + 1.36 sin (100π t) – 4.20 cos (100π t)
= 4.23 sin (100π t) -1.8 cos (100π t)
Using the identity :
A sin φ - B cos φ = R sin (φ - α)
where R = √ (A² + B²) and
α = Tan^-1 [(B/A) ]
From expression: 4.23 sin (100π t) -1.8 cos (100π t)
A = 4.23 B = -1.8
R = √ (4.23² + (-1.8)²) = 4.59
Tan α = (1.8) / (4.23)
α = 23.03 degree = 0.401 radians
4.23 sin (100π t) -1.8 cos (100π t) = 4.59 sin ( 100π t - 0.401)
6.) Completing table for values of x1 and x2
Solution
7.) Plotting x1, x2 and x1 +x2 on same graph
Solution
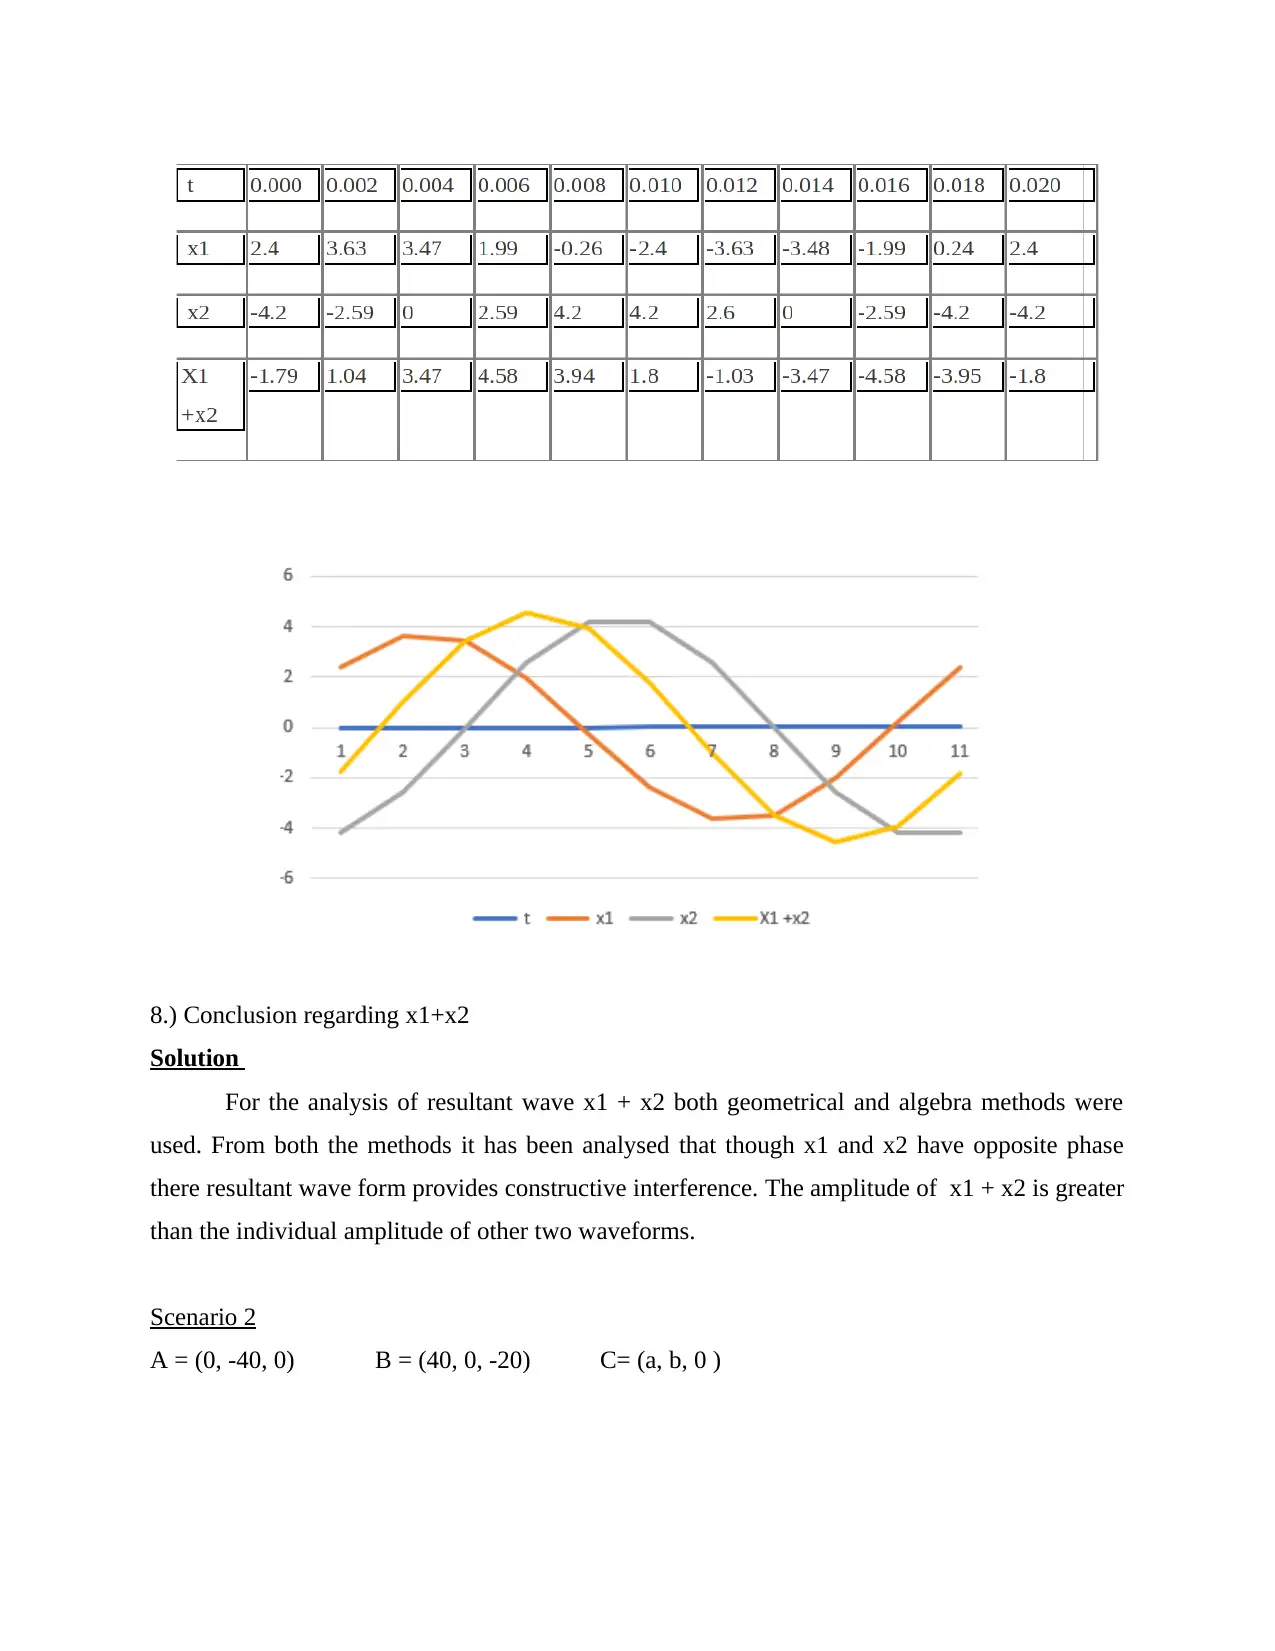
8.) Conclusion regarding x1+x2
Solution
For the analysis of resultant wave x1 + x2 both geometrical and algebra methods were
used. From both the methods it has been analysed that though x1 and x2 have opposite phase
there resultant wave form provides constructive interference. The amplitude of x1 + x2 is greater
than the individual amplitude of other two waveforms.
Scenario 2
A = (0, -40, 0) B = (40, 0, -20) C= (a, b, 0 )
Secure Best Marks with AI Grader
Need help grading? Try our AI Grader for instant feedback on your assignments.
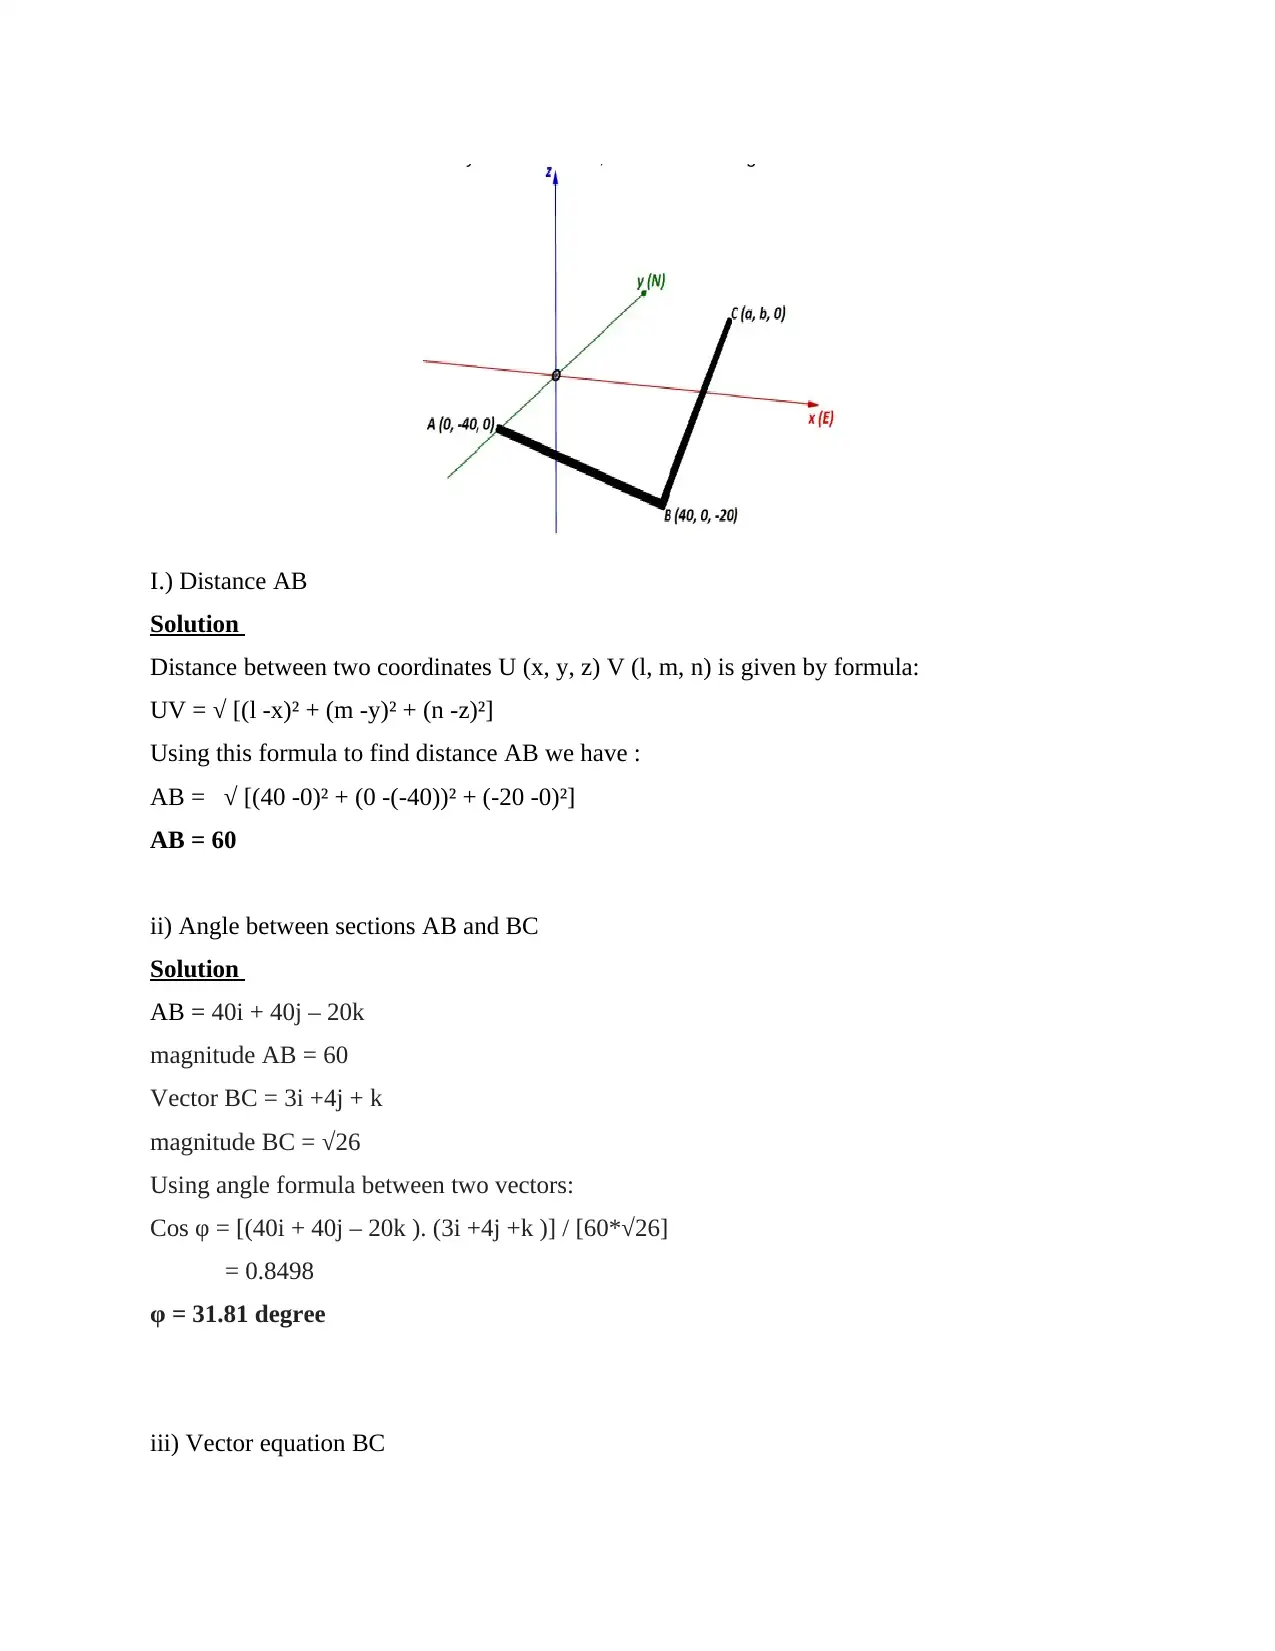
I.) Distance AB
Solution
Distance between two coordinates U (x, y, z) V (l, m, n) is given by formula:
UV = √ [(l -x)² + (m -y)² + (n -z)²]
Using this formula to find distance AB we have :
AB = √ [(40 -0)² + (0 -(-40))² + (-20 -0)²]
AB = 60
ii) Angle between sections AB and BC
Solution
AB = 40i + 40j – 20k
magnitude AB = 60
Vector BC = 3i +4j + k
magnitude BC = √26
Using angle formula between two vectors:
Cos φ = [(40i + 40j – 20k ). (3i +4j +k )] / [60*√26]
= 0.8498
φ = 31.81 degree
iii) Vector equation BC
Solution
B= (40, 0, -20)
rho = 20
C = B + rho* normal vector
(a, b, 0 ) = (40, 0, -20) + 20* (3, 4, 1)
(a, b, 0 ) = (40, 0, -20) + (60, 80, 20)
On comparing we get:
a = 100
b = 80
B= (40, 0, -20)
rho = 20
C = B + rho* normal vector
(a, b, 0 ) = (40, 0, -20) + 20* (3, 4, 1)
(a, b, 0 ) = (40, 0, -20) + (60, 80, 20)
On comparing we get:
a = 100
b = 80
TASK 4
Scenario 1
A1.)
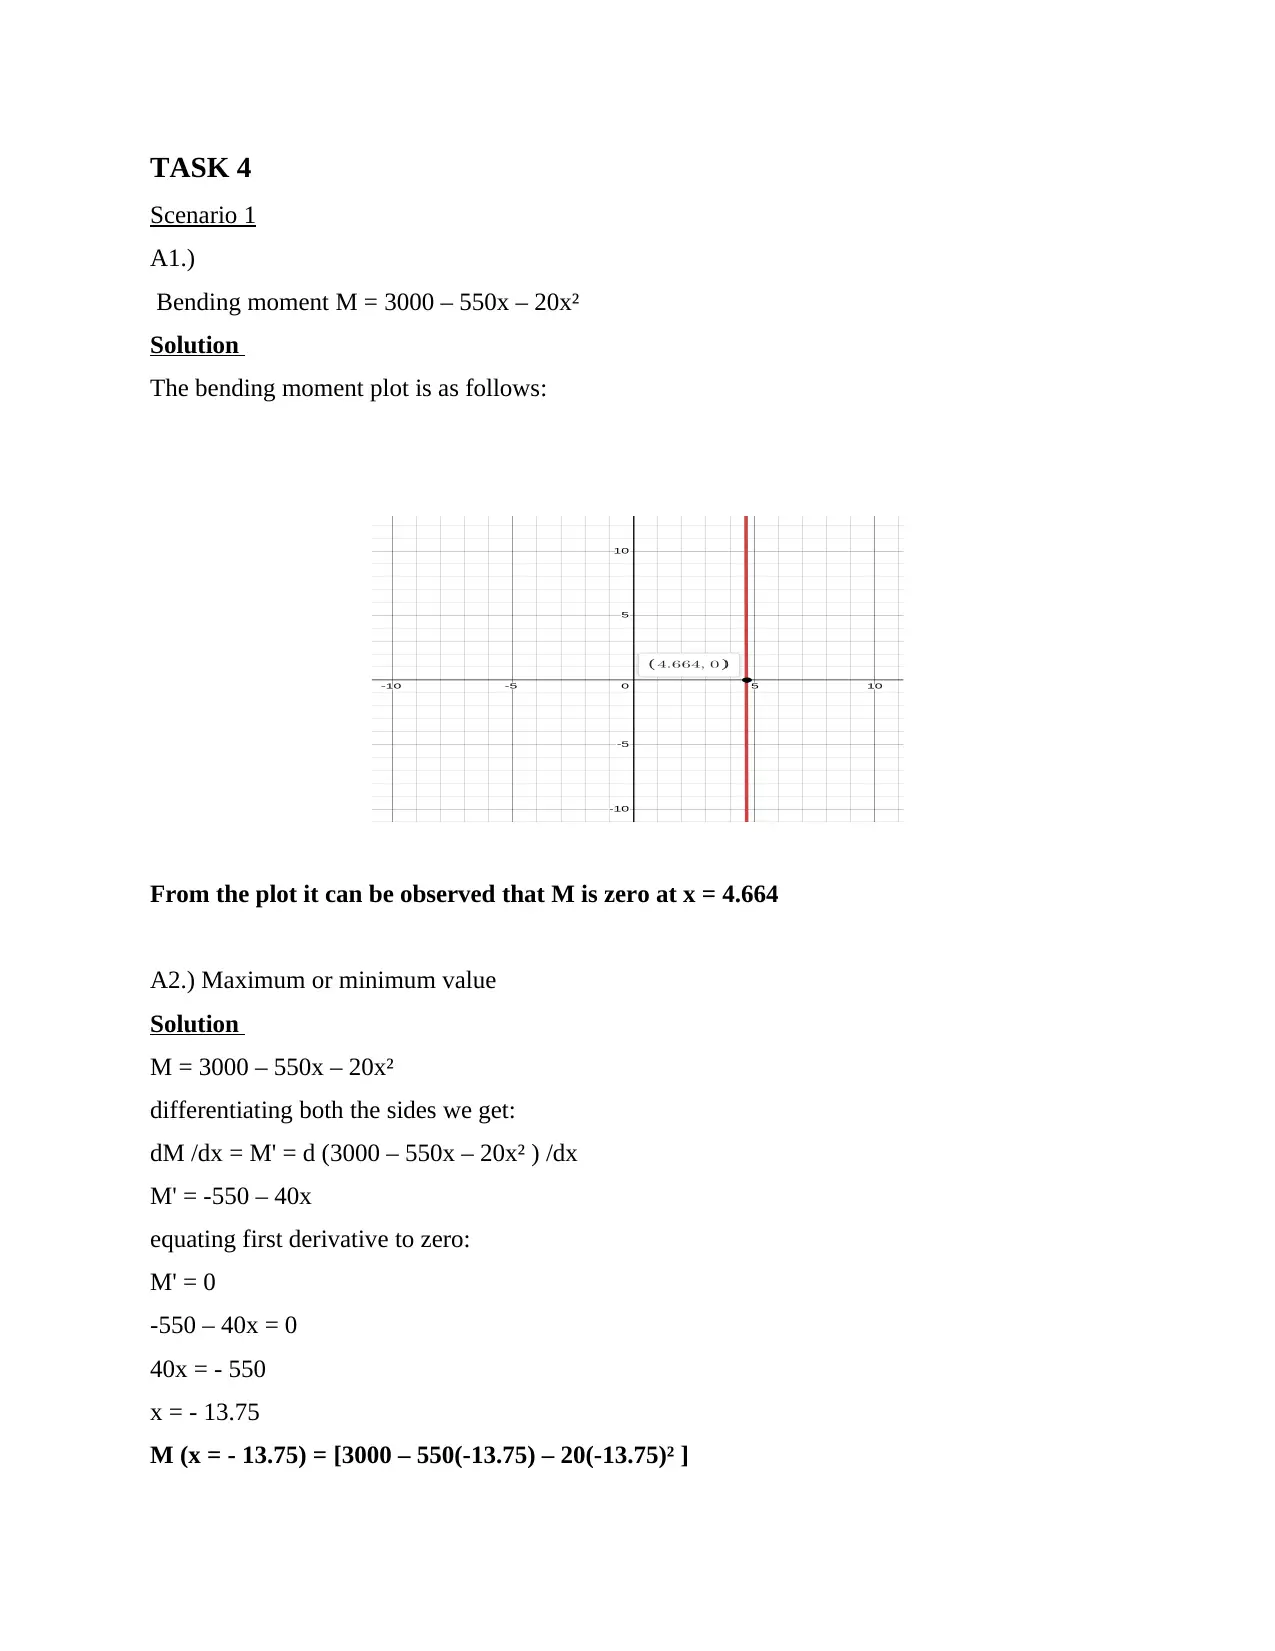
Bending moment M = 3000 – 550x – 20x²
Solution
The bending moment plot is as follows:
From the plot it can be observed that M is zero at x = 4.664
A2.) Maximum or minimum value
Solution
M = 3000 – 550x – 20x²
differentiating both the sides we get:
dM /dx = M' = d (3000 – 550x – 20x² ) /dx
M' = -550 – 40x
equating first derivative to zero:
M' = 0
-550 – 40x = 0
40x = - 550
x = - 13.75
M (x = - 13.75) = [3000 – 550(-13.75) – 20(-13.75)² ]
Scenario 1
A1.)
Bending moment M = 3000 – 550x – 20x²
Solution
The bending moment plot is as follows:
From the plot it can be observed that M is zero at x = 4.664
A2.) Maximum or minimum value
Solution
M = 3000 – 550x – 20x²
differentiating both the sides we get:
dM /dx = M' = d (3000 – 550x – 20x² ) /dx
M' = -550 – 40x
equating first derivative to zero:
M' = 0
-550 – 40x = 0
40x = - 550
x = - 13.75
M (x = - 13.75) = [3000 – 550(-13.75) – 20(-13.75)² ]
Paraphrase This Document
Need a fresh take? Get an instant paraphrase of this document with our AI Paraphraser
= 6781.25
Double differentiation of M is given as:
M'' = d (-550 – 40x ) /dx
M'' = -40
Double derivate is less than zero (negative), thus the bending moment M is function minima.
Thus range of values for which bending moment will have minimum values is given by the
coordinates : (-13.75, 6781.25)
B.) Ө= 300 + 100e^(-0.1t)
Ө = temperature (degree Celsius)
t = time (minutes)
Solution
t= 0 Ө= 300 + 100e^[-0.1(0)] = 400
t = 1 Ө= 300 + 100e^[-0.1(1)] = 390
t = 2 Ө= 300 + 100e^[-0.1(2)] = 381
t = 5 Ө= 300 + 100e^[-0.1(5)] = 360
For the positive value of time, temperature will be in the range (400, 300) as at t = infinity
temperature will reduced to 300 degree Celsius.
C.) log (P) + n log (V) – log (C)
P is pressure, V denotes volume, C is constant and n denotes index
Solution
On equating the expression to zero:
log (P) + n log (V) – log (C) = 0
log (P) + n log (V) = log (C)
Using property: a log(b) = log (b^a)
log (P) + log (V^n) = log (C)
Using property: log m + log n = log (mn)
Thus we have:
log (PV^n) = log (C)
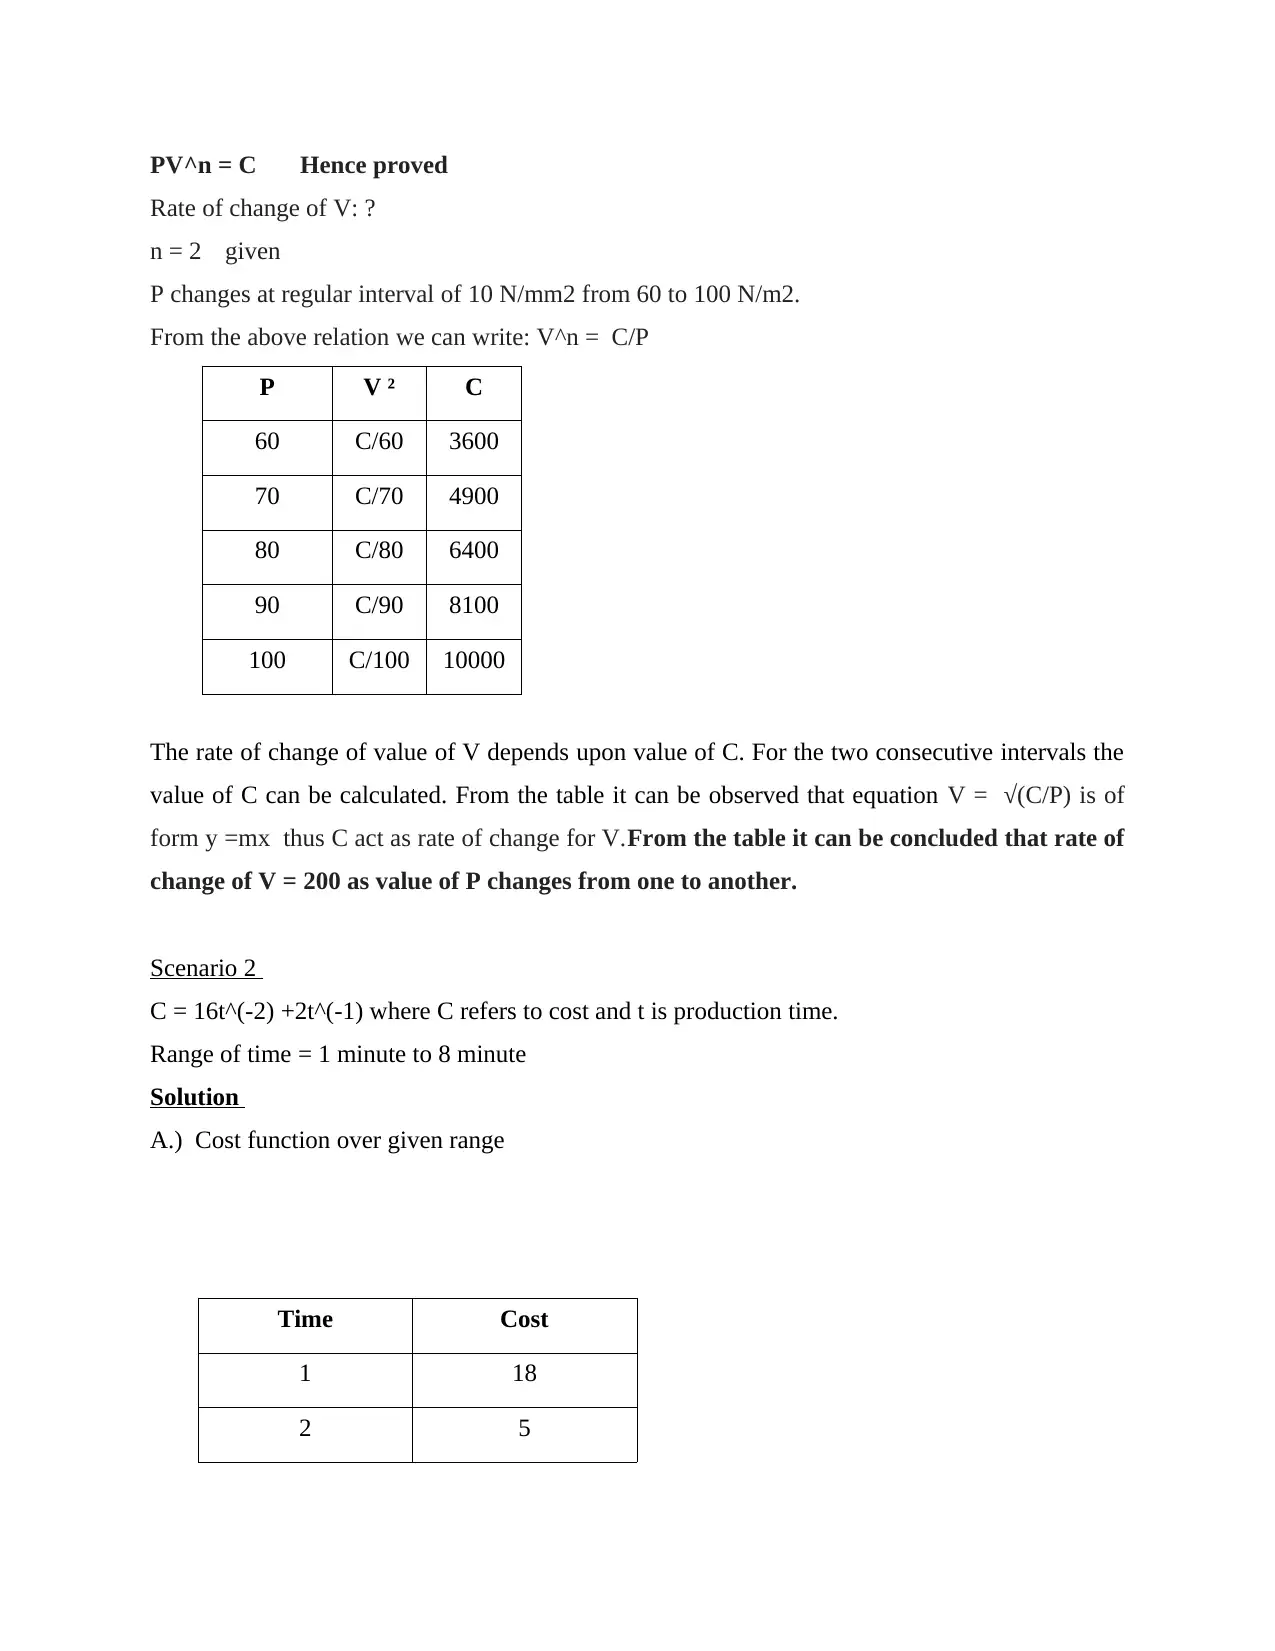
PV^n = C Hence proved
Rate of change of V: ?
n = 2 given
P changes at regular interval of 10 N/mm2 from 60 to 100 N/m2.
From the above relation we can write: V^n = C/P
P V ² C
60 C/60 3600
70 C/70 4900
80 C/80 6400
90 C/90 8100
100 C/100 10000
The rate of change of value of V depends upon value of C. For the two consecutive intervals the
value of C can be calculated. From the table it can be observed that equation V = √(C/P) is of
form y =mx thus C act as rate of change for V.From the table it can be concluded that rate of
change of V = 200 as value of P changes from one to another.
Scenario 2
C = 16t^(-2) +2t^(-1) where C refers to cost and t is production time.
Range of time = 1 minute to 8 minute
Solution
A.) Cost function over given range
Time Cost
1 18
2 5

3 2.44
4 1.5
5 1.04
6 0.77
7 0.61
8 0.5
B.) Use of calculus for analytical solution
Solution
To find and analytical and optimum solution of the given cost and production time based
problem differentiation can be used to determine the maximum and minimum value of specific
cost function. If cost and production time will be lowest then only then it will be feasible for the
Secure Best Marks with AI Grader
Need help grading? Try our AI Grader for instant feedback on your assignments.
organisation to accomplish production with least production cost and maximum profitability. In
order to find the optimum value points first derivative is calculated and equated to zero. It will
give the optimum time value. For calculating the optimum value of another parameter cost,
value of optimum time is substituted in the given function value. To determine if the optimum
value is maximum or minimum, double derivative is calculated. If double derivative is positive
then function has minima, if it is negative then function has maximum and if double derivative is
zero then it has neither maxima nor minima.
C.) Production time for at turning cost
Solution
C = 16t^(-2) +2t^(-1)
On differentiating both the sides
C' = -32t^(-3) – 2t^(-2)
Equating first derivative to zero
C' = -32t^(-3) – 2t^(-2) = 0
On simplifying this equation we get:
t = 16
Thus turning cost will be at t = 16 minute:
C = 16(16)^(-2) +2(16)^(-1)
Turning cost C= 0.186
Production time at turning cost = 16 minutes
D.) Minimum turning point
Solution
Double derivative of cost function is:
C'' = 96t^(-4) +4t^(-3)
The value will result in positive value thus cost function has minima.
Scenario 3
Heat flow (h) = e^3t where t is temperature difference in degree Celsius
Solution
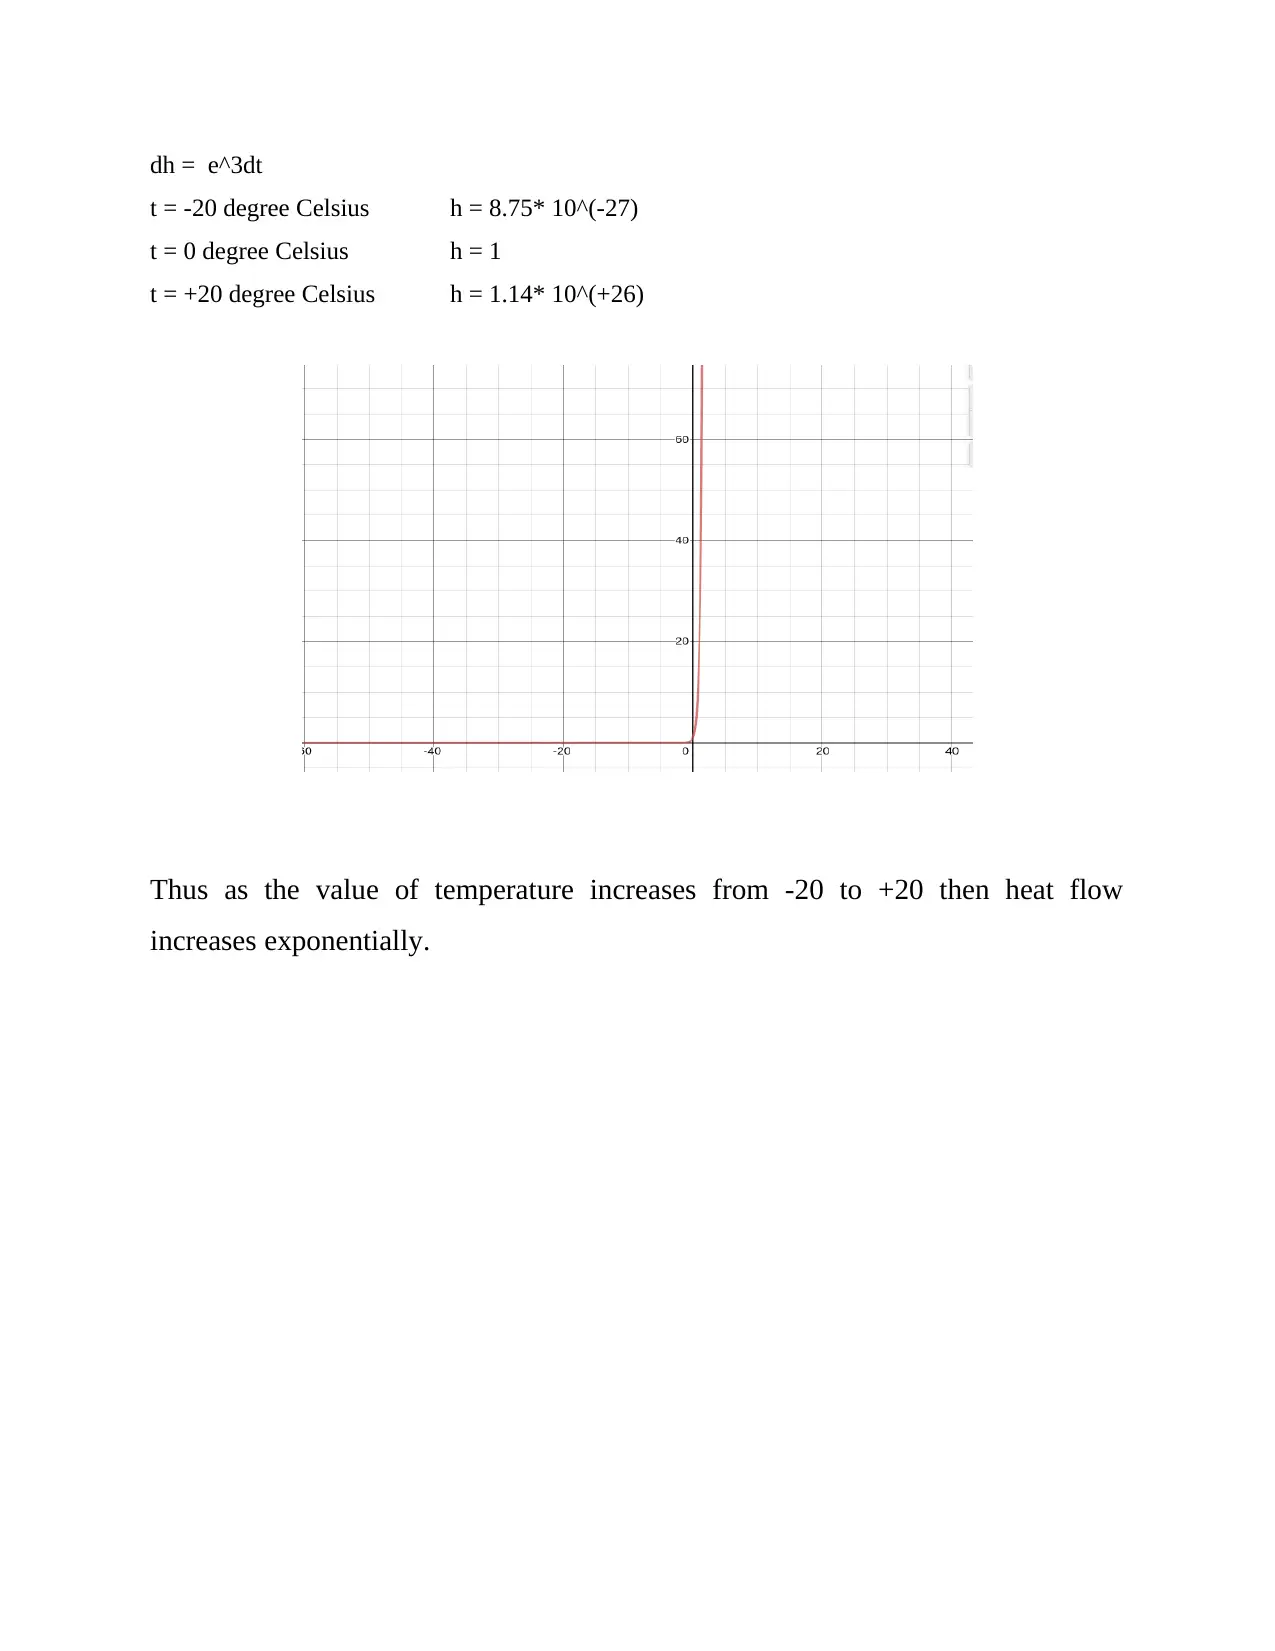
dh = e^3dt
t = -20 degree Celsius h = 8.75* 10^(-27)
t = 0 degree Celsius h = 1
t = +20 degree Celsius h = 1.14* 10^(+26)
Thus as the value of temperature increases from -20 to +20 then heat flow
increases exponentially.
t = -20 degree Celsius h = 8.75* 10^(-27)
t = 0 degree Celsius h = 1
t = +20 degree Celsius h = 1.14* 10^(+26)
Thus as the value of temperature increases from -20 to +20 then heat flow
increases exponentially.

1 out of 25
Related Documents


Your All-in-One AI-Powered Toolkit for Academic Success.
+13062052269
info@desklib.com
Available 24*7 on WhatsApp / Email
![[object Object]](/_next/static/media/star-bottom.7253800d.svg)
Unlock your academic potential
© 2024 | Zucol Services PVT LTD | All rights reserved.