A REPORT / COURSE WORK.
VerifiedAdded on 2023/01/18
|13
|3282
|99
AI Summary
Contribute Materials
Your contribution can guide someone’s learning journey. Share your
documents today.
A
REPORT / COURSE WORK
ON
ELECTROENCEPHALOGRAPH (EEG):
BASIC BRAIN WAVES, WORKING, QUANTIFICATION
AND
DESIGN OF DIGITAL FILTER IN MATLAB
In partial fulfillment for the award of the Degree of
BEng (GCU) IN Electronics and Instrumentation Engineering
Submitted by
NAME:
Reg no:
Bio-Medical Instrumentation
MHH624668
Secure Best Marks with AI Grader
Need help grading? Try our AI Grader for instant feedback on your assignments.

ACKKNOWLEDGEMENT
I take this opportunity to express my sincere gratitude and deep regards to my supervisor
NAME, DESIGNATION for guiding me throughout my entire course work technically and
methodologically.
I would like to thank all the teaching and non-teaching staffs of Dept and Institute name, for
providing enormous support to carry out my research works. I would like to thank all my
colleagues of Institute name, for providing their support in various manners during my course
works.
Abstract: This documentation describes the basic brain wave patterns, associated
with Electroencephalograph (EEG). The fundamental knowledge about neuronal
waves, attributes of the signals, different sensing devices and quantification methods
are discussed .The next section delineates the signal conditioning part of the system:
designing and implementing an IIR-Butterworth filter in Matlab. The designed filter
can wipe out the external noise interference, which deform the actual EEG signal
during the process of recording in hospital.
Introduction:
EEG is a bio-signal generated from the neuronal cell oh human mind. This is
basically the action potential of the neurons due to the movement of Na+, K+, and Cl-
ions present in cell. This action potential is picked up by sensors and analysed for
estimating the state of mind. Specially used for diagnosis and treatment purpose.
Now-a-days EEG signal processing is very popular and widely used for BCI, Brain
Computer Interface. The researcher design and implement different algorithm to
analyse the features present in the bio signals. It is claimed that the change in
pattern of alpha and beta band actually indicates the state of human mental state.
EEG signal measurement is very challenging because of their very low amplitude
and frequency components and its get affected and distorted by the external
interference and noise. As any movement in the body causes different artifacts which
affect the EEG signal recording.
I. Fundamentals
a) The brain waves are classified based on the frequency components
(Whittingstall, 2009) present in acquired signal. They are classified as Gamma
(γ), Beta (β), Alpha (α), Theta (θ), and Delta (δ). The brain waves with their
different features and patterns are discussed below.
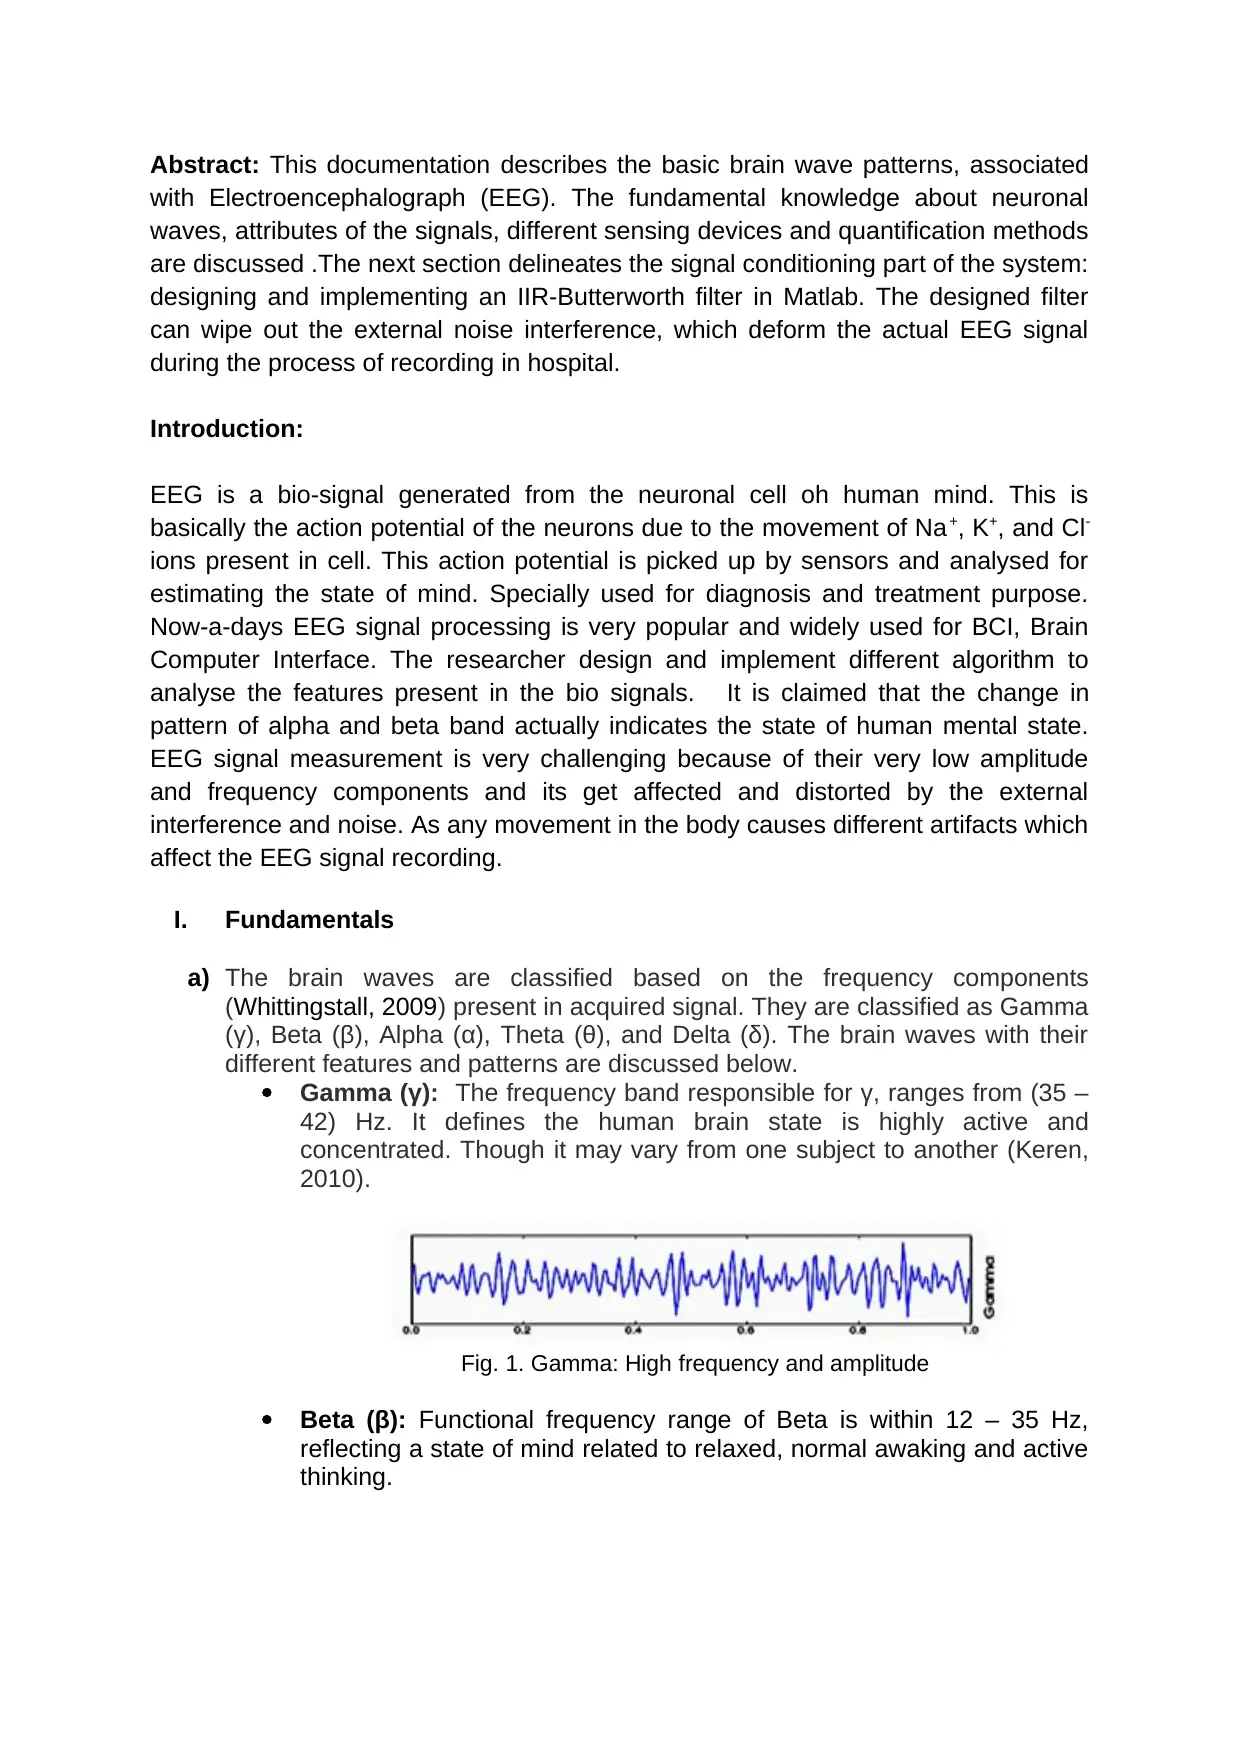
Gamma (γ): The frequency band responsible for γ, ranges from (35 –
42) Hz. It defines the human brain state is highly active and
concentrated. Though it may vary from one subject to another (Keren,
2010).
Fig. 1. Gamma: High frequency and amplitude
Beta (β): Functional frequency range of Beta is within 12 – 35 Hz,
reflecting a state of mind related to relaxed, normal awaking and active
thinking.
with Electroencephalograph (EEG). The fundamental knowledge about neuronal
waves, attributes of the signals, different sensing devices and quantification methods
are discussed .The next section delineates the signal conditioning part of the system:
designing and implementing an IIR-Butterworth filter in Matlab. The designed filter
can wipe out the external noise interference, which deform the actual EEG signal
during the process of recording in hospital.
Introduction:
EEG is a bio-signal generated from the neuronal cell oh human mind. This is
basically the action potential of the neurons due to the movement of Na+, K+, and Cl-
ions present in cell. This action potential is picked up by sensors and analysed for
estimating the state of mind. Specially used for diagnosis and treatment purpose.
Now-a-days EEG signal processing is very popular and widely used for BCI, Brain
Computer Interface. The researcher design and implement different algorithm to
analyse the features present in the bio signals. It is claimed that the change in
pattern of alpha and beta band actually indicates the state of human mental state.
EEG signal measurement is very challenging because of their very low amplitude
and frequency components and its get affected and distorted by the external
interference and noise. As any movement in the body causes different artifacts which
affect the EEG signal recording.
I. Fundamentals
a) The brain waves are classified based on the frequency components
(Whittingstall, 2009) present in acquired signal. They are classified as Gamma
(γ), Beta (β), Alpha (α), Theta (θ), and Delta (δ). The brain waves with their
different features and patterns are discussed below.
Gamma (γ): The frequency band responsible for γ, ranges from (35 –
42) Hz. It defines the human brain state is highly active and
concentrated. Though it may vary from one subject to another (Keren,
2010).
Fig. 1. Gamma: High frequency and amplitude
Beta (β): Functional frequency range of Beta is within 12 – 35 Hz,
reflecting a state of mind related to relaxed, normal awaking and active
thinking.
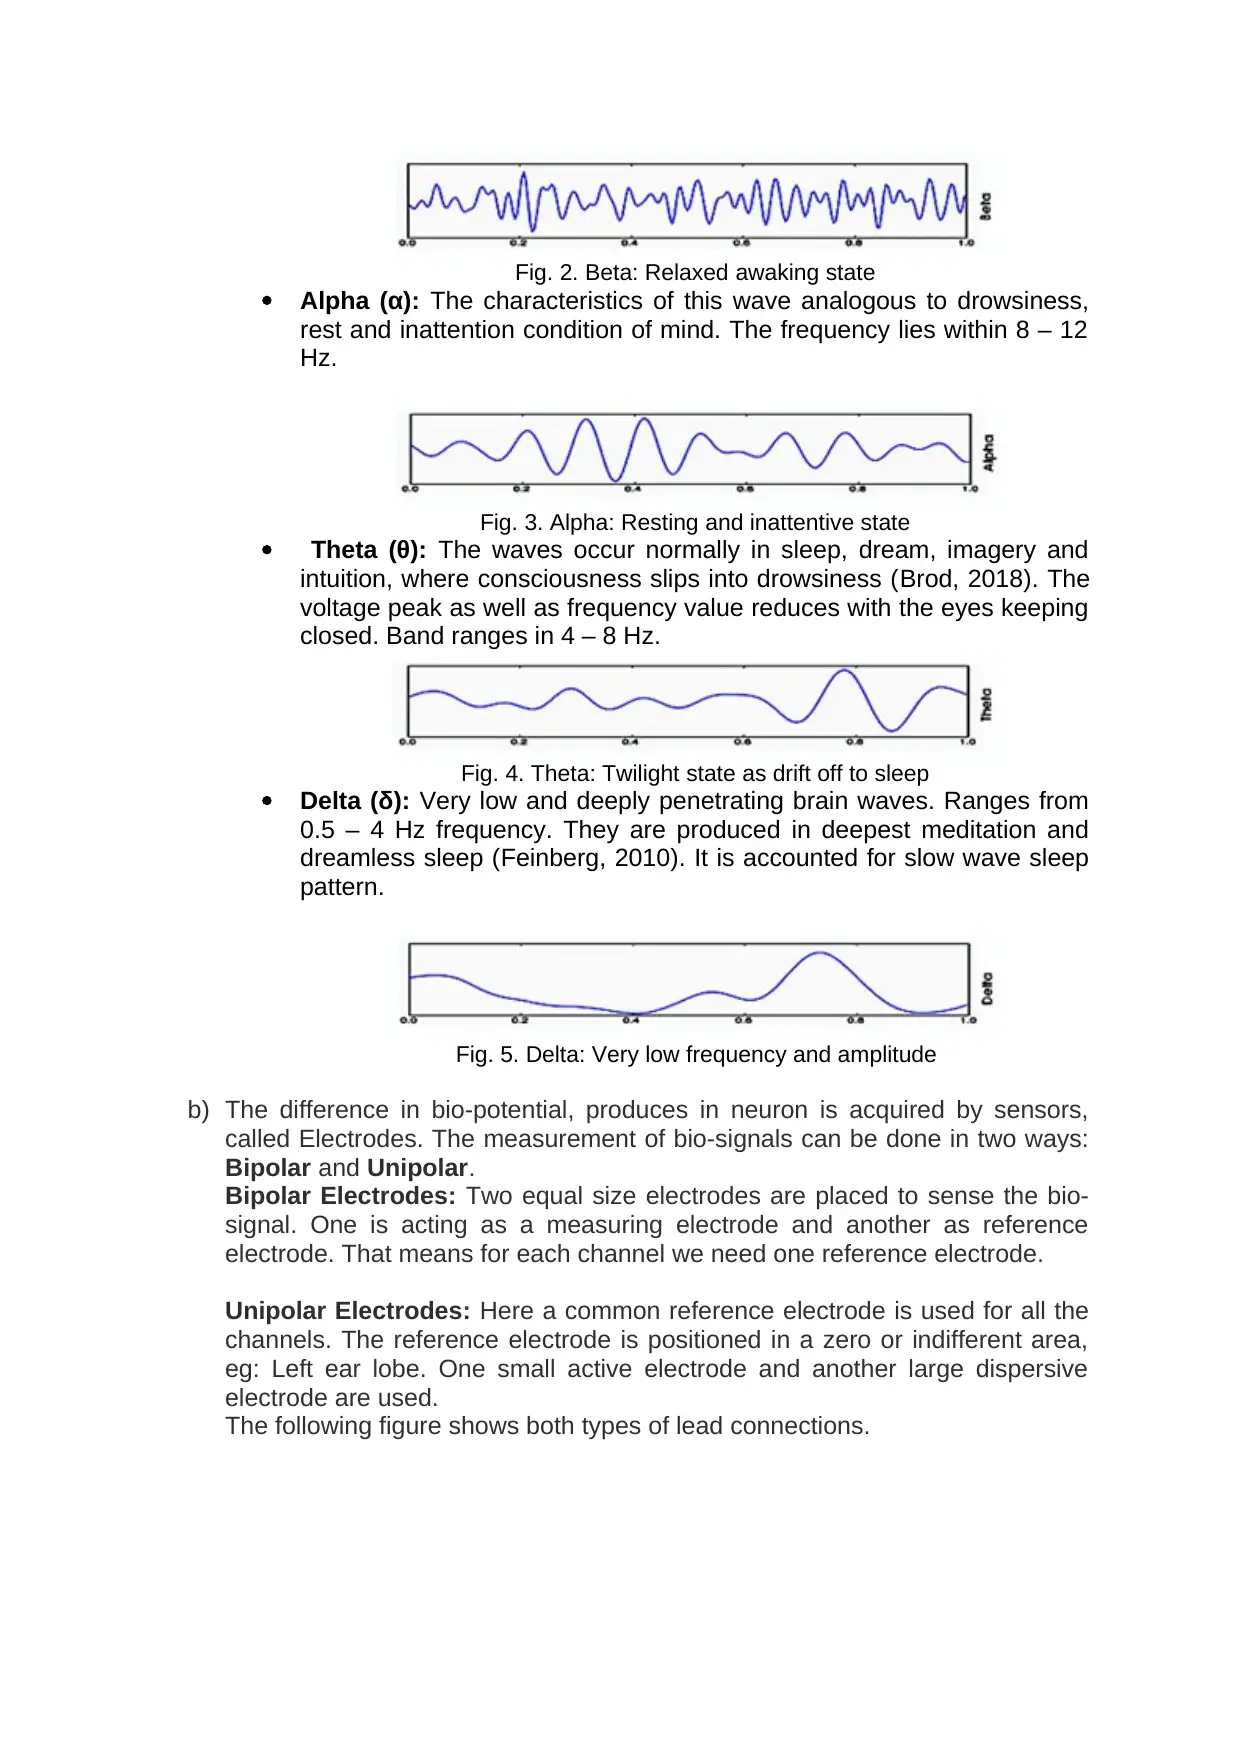
Fig. 2. Beta: Relaxed awaking state
Alpha (α): The characteristics of this wave analogous to drowsiness,
rest and inattention condition of mind. The frequency lies within 8 – 12
Hz.
Fig. 3. Alpha: Resting and inattentive state
Theta (θ): The waves occur normally in sleep, dream, imagery and
intuition, where consciousness slips into drowsiness (Brod, 2018). The
voltage peak as well as frequency value reduces with the eyes keeping
closed. Band ranges in 4 – 8 Hz.
Fig. 4. Theta: Twilight state as drift off to sleep
Delta (δ): Very low and deeply penetrating brain waves. Ranges from
0.5 – 4 Hz frequency. They are produced in deepest meditation and
dreamless sleep (Feinberg, 2010). It is accounted for slow wave sleep
pattern.
Fig. 5. Delta: Very low frequency and amplitude
b) The difference in bio-potential, produces in neuron is acquired by sensors,
called Electrodes. The measurement of bio-signals can be done in two ways:
Bipolar and Unipolar.
Bipolar Electrodes: Two equal size electrodes are placed to sense the bio-
signal. One is acting as a measuring electrode and another as reference
electrode. That means for each channel we need one reference electrode.
Unipolar Electrodes: Here a common reference electrode is used for all the
channels. The reference electrode is positioned in a zero or indifferent area,
eg: Left ear lobe. One small active electrode and another large dispersive
electrode are used.
The following figure shows both types of lead connections.
Secure Best Marks with AI Grader
Need help grading? Try our AI Grader for instant feedback on your assignments.
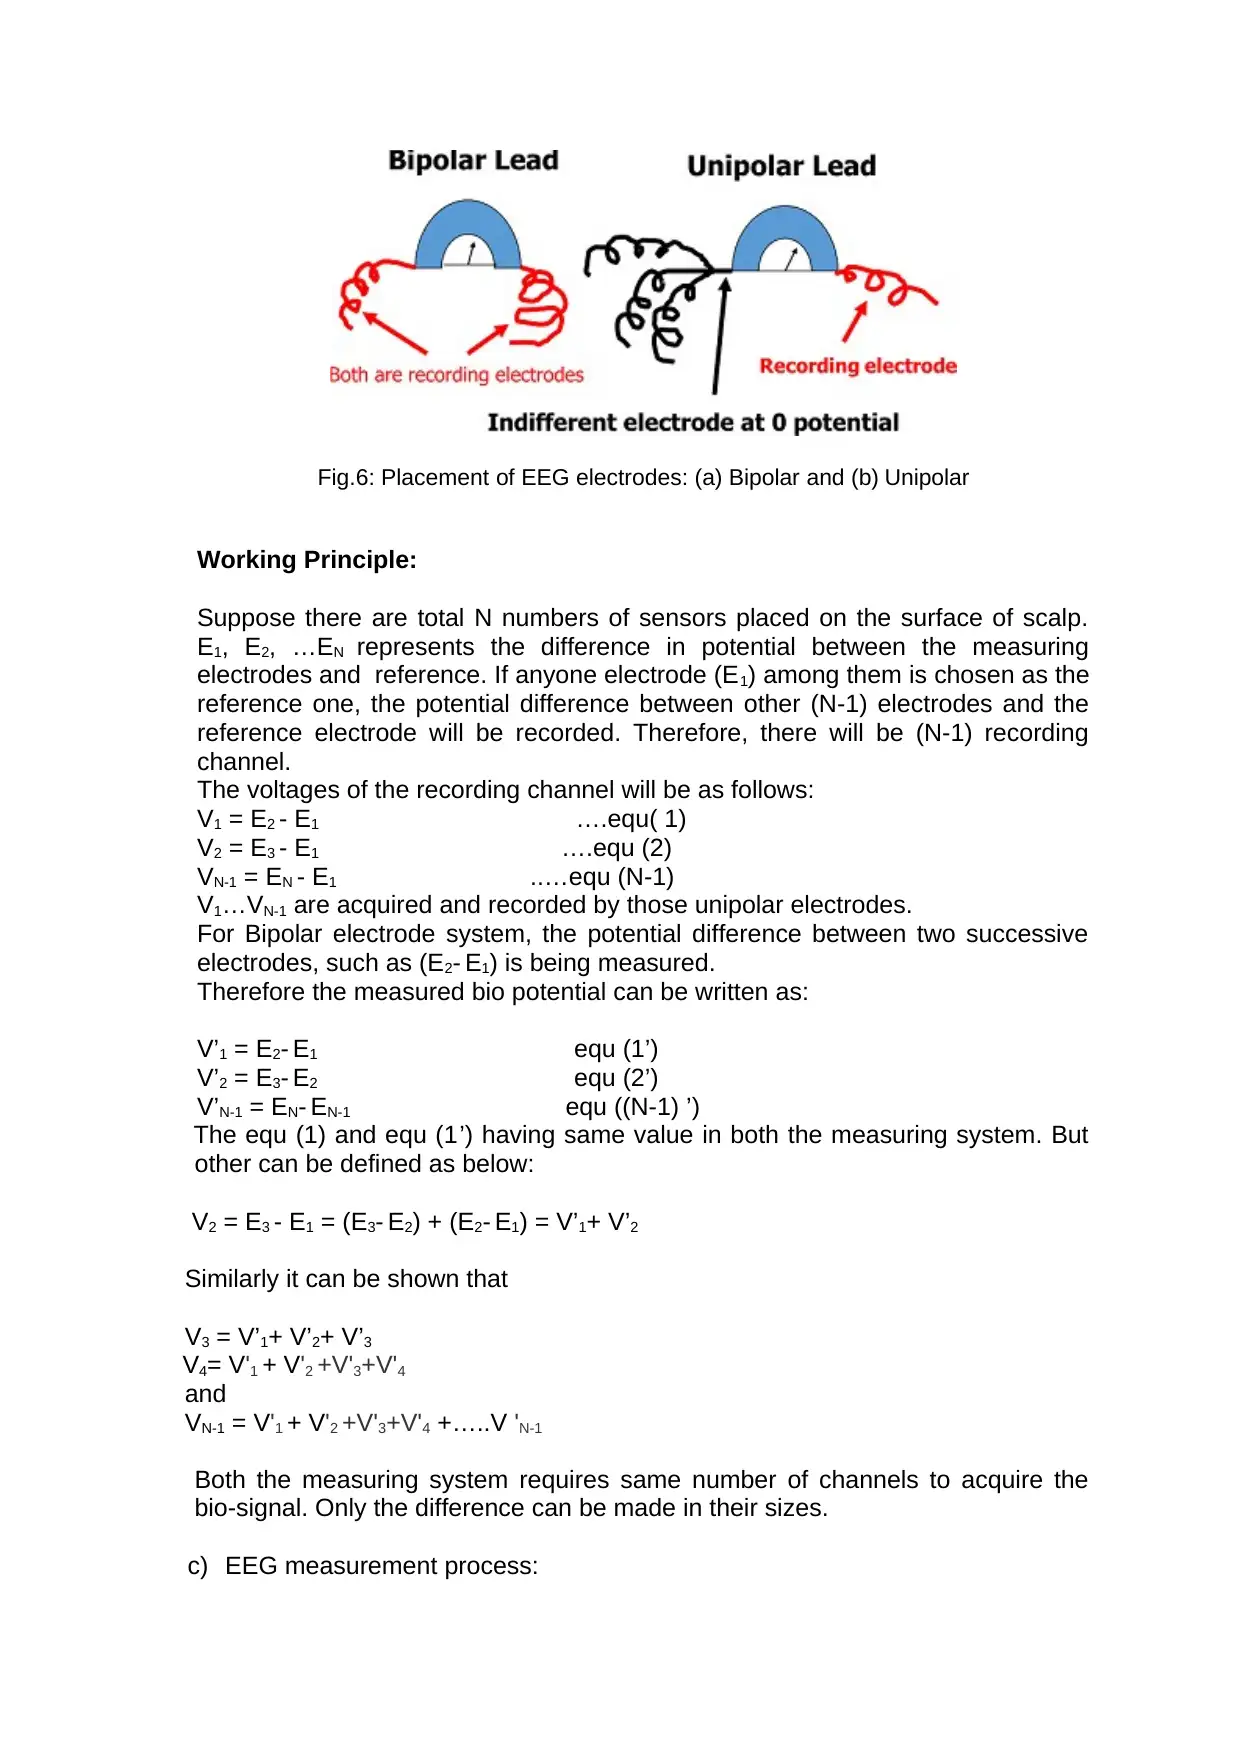
Fig.6: Placement of EEG electrodes: (a) Bipolar and (b) Unipolar
Working Principle:
Suppose there are total N numbers of sensors placed on the surface of scalp.
E1, E2, …EN represents the difference in potential between the measuring
electrodes and reference. If anyone electrode (E1) among them is chosen as the
reference one, the potential difference between other (N-1) electrodes and the
reference electrode will be recorded. Therefore, there will be (N-1) recording
channel.
The voltages of the recording channel will be as follows:
V1 = E2 - E1 ….equ( 1)
V2 = E3 - E1 ….equ (2)
VN-1 = EN - E1 ..…equ (N-1)
V1…VN-1 are acquired and recorded by those unipolar electrodes.
For Bipolar electrode system, the potential difference between two successive
electrodes, such as (E2- E1) is being measured.
Therefore the measured bio potential can be written as:
V’1 = E2- E1 equ (1’)
V’2 = E3- E2 equ (2’)
V’N-1 = EN- EN-1 equ ((N-1) ’)
The equ (1) and equ (1’) having same value in both the measuring system. But
other can be defined as below:
V2 = E3 - E1 = (E3- E2) + (E2- E1) = V’1+ V’2
Similarly it can be shown that
V3 = V’1+ V’2+ V’3
V4= V'1 + V'2 +V'3+V'4
and
VN-1 = V'1 + V'2 +V'3+V'4 +…..V 'N-1
Both the measuring system requires same number of channels to acquire the
bio-signal. Only the difference can be made in their sizes.
c) EEG measurement process:
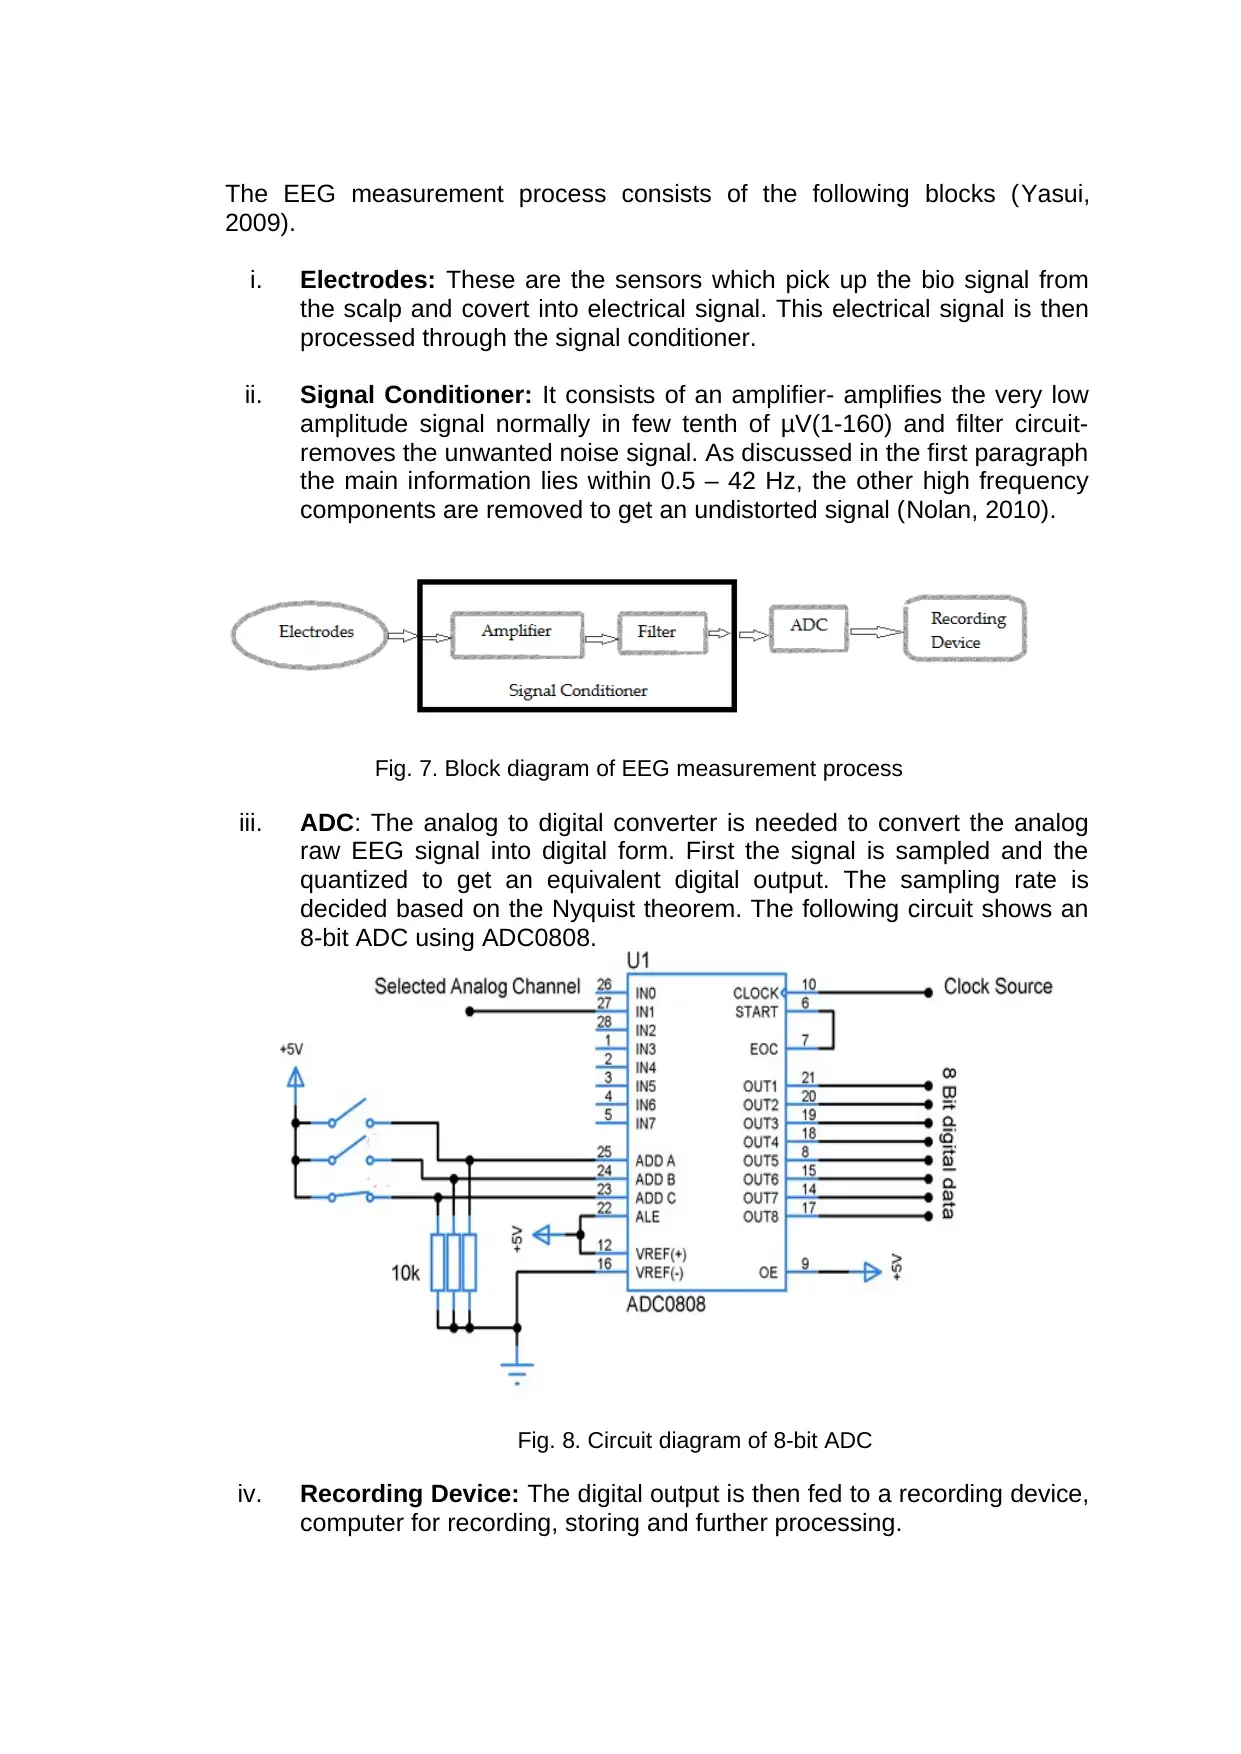
The EEG measurement process consists of the following blocks (Yasui,
2009).
i. Electrodes: These are the sensors which pick up the bio signal from
the scalp and covert into electrical signal. This electrical signal is then
processed through the signal conditioner.
ii. Signal Conditioner: It consists of an amplifier- amplifies the very low
amplitude signal normally in few tenth of μV(1-160) and filter circuit-
removes the unwanted noise signal. As discussed in the first paragraph
the main information lies within 0.5 – 42 Hz, the other high frequency
components are removed to get an undistorted signal (Nolan, 2010).
Fig. 7. Block diagram of EEG measurement process
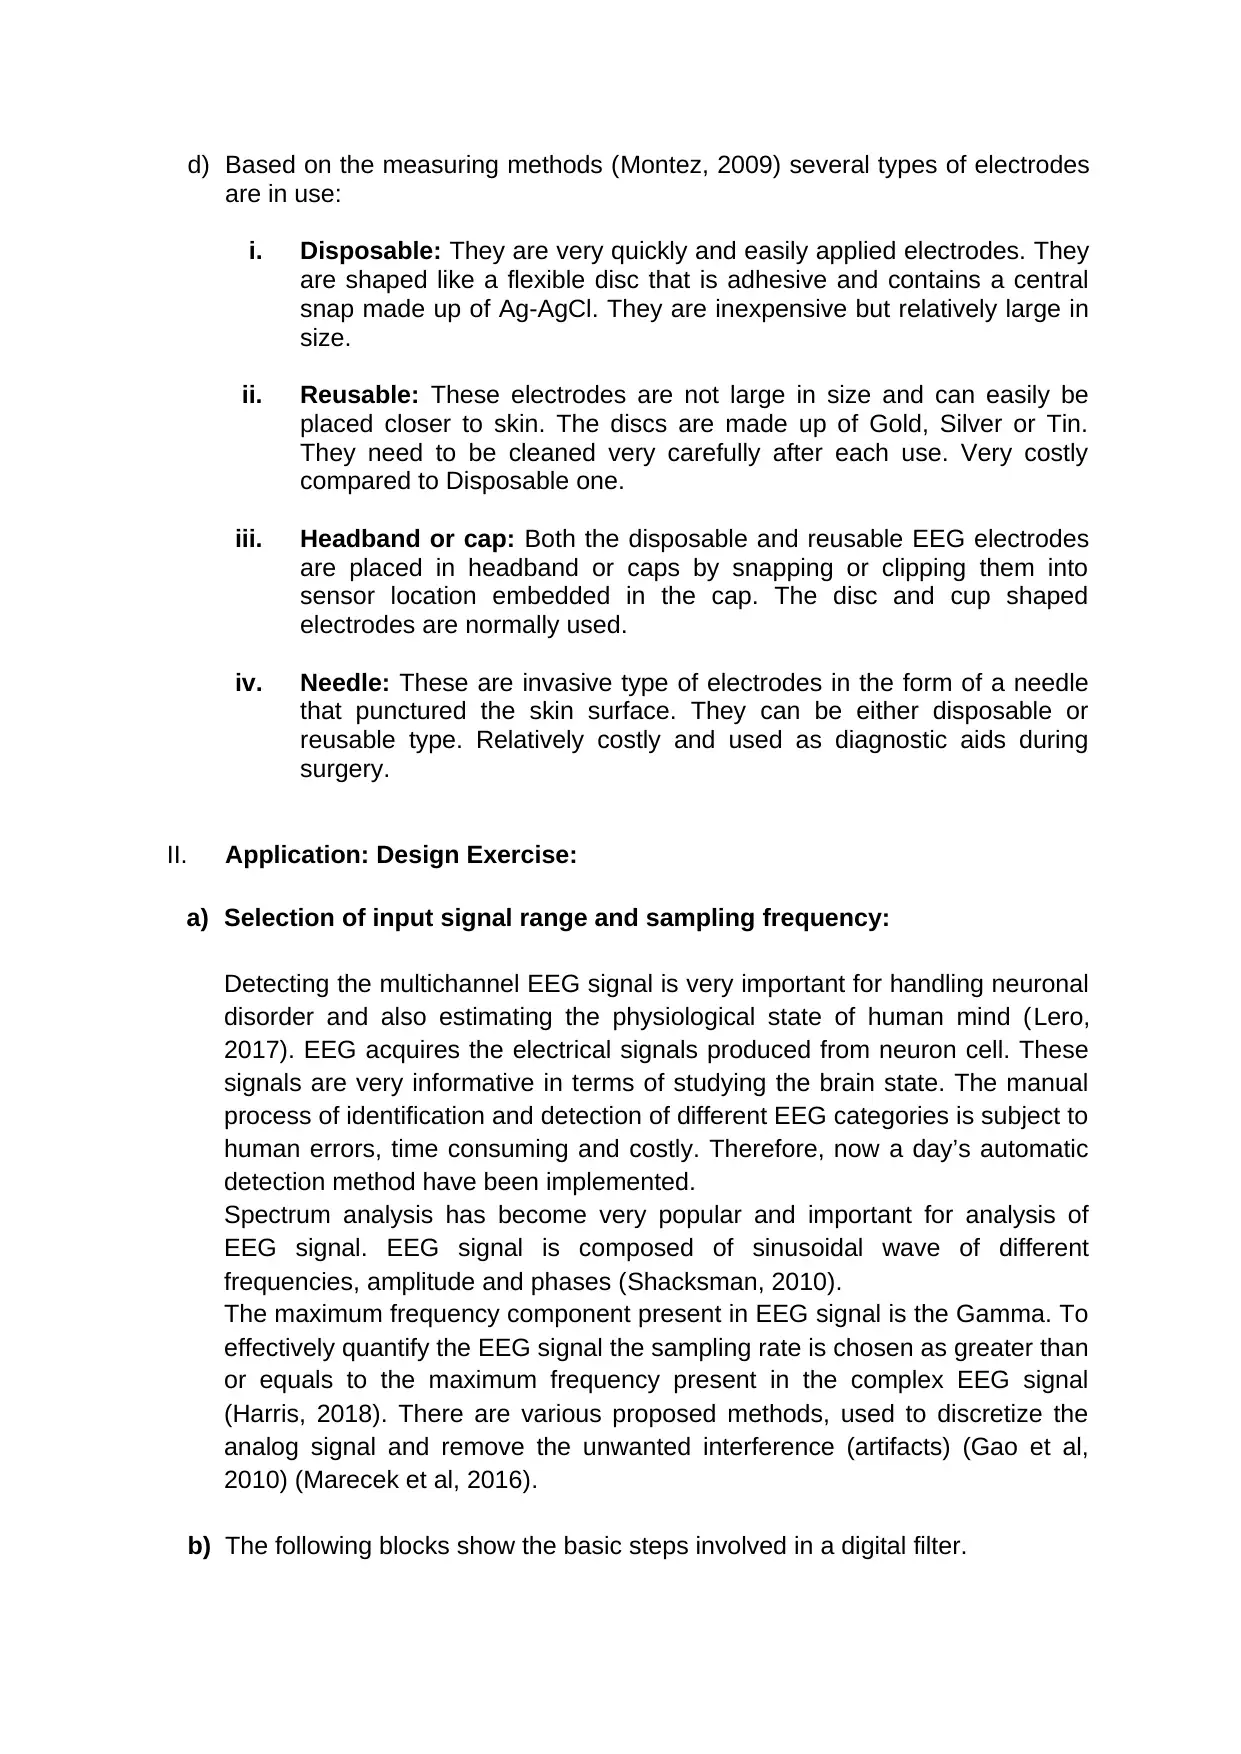
iii. ADC: The analog to digital converter is needed to convert the analog
raw EEG signal into digital form. First the signal is sampled and the
quantized to get an equivalent digital output. The sampling rate is
decided based on the Nyquist theorem. The following circuit shows an
8-bit ADC using ADC0808.
Fig. 8. Circuit diagram of 8-bit ADC
iv. Recording Device: The digital output is then fed to a recording device,
computer for recording, storing and further processing.
2009).
i. Electrodes: These are the sensors which pick up the bio signal from
the scalp and covert into electrical signal. This electrical signal is then
processed through the signal conditioner.
ii. Signal Conditioner: It consists of an amplifier- amplifies the very low
amplitude signal normally in few tenth of μV(1-160) and filter circuit-
removes the unwanted noise signal. As discussed in the first paragraph
the main information lies within 0.5 – 42 Hz, the other high frequency
components are removed to get an undistorted signal (Nolan, 2010).
Fig. 7. Block diagram of EEG measurement process
iii. ADC: The analog to digital converter is needed to convert the analog
raw EEG signal into digital form. First the signal is sampled and the
quantized to get an equivalent digital output. The sampling rate is
decided based on the Nyquist theorem. The following circuit shows an
8-bit ADC using ADC0808.
Fig. 8. Circuit diagram of 8-bit ADC
iv. Recording Device: The digital output is then fed to a recording device,
computer for recording, storing and further processing.
d) Based on the measuring methods (Montez, 2009) several types of electrodes
are in use:
i. Disposable: They are very quickly and easily applied electrodes. They
are shaped like a flexible disc that is adhesive and contains a central
snap made up of Ag-AgCl. They are inexpensive but relatively large in
size.
ii. Reusable: These electrodes are not large in size and can easily be
placed closer to skin. The discs are made up of Gold, Silver or Tin.
They need to be cleaned very carefully after each use. Very costly
compared to Disposable one.
iii. Headband or cap: Both the disposable and reusable EEG electrodes
are placed in headband or caps by snapping or clipping them into
sensor location embedded in the cap. The disc and cup shaped
electrodes are normally used.
iv. Needle: These are invasive type of electrodes in the form of a needle
that punctured the skin surface. They can be either disposable or
reusable type. Relatively costly and used as diagnostic aids during
surgery.
II. Application: Design Exercise:
a) Selection of input signal range and sampling frequency:
Detecting the multichannel EEG signal is very important for handling neuronal
disorder and also estimating the physiological state of human mind (Lero,
2017). EEG acquires the electrical signals produced from neuron cell. These
signals are very informative in terms of studying the brain state. The manual
process of identification and detection of different EEG categories is subject to
human errors, time consuming and costly. Therefore, now a day’s automatic
detection method have been implemented.
Spectrum analysis has become very popular and important for analysis of
EEG signal. EEG signal is composed of sinusoidal wave of different
frequencies, amplitude and phases (Shacksman, 2010).
The maximum frequency component present in EEG signal is the Gamma. To
effectively quantify the EEG signal the sampling rate is chosen as greater than
or equals to the maximum frequency present in the complex EEG signal
(Harris, 2018). There are various proposed methods, used to discretize the
analog signal and remove the unwanted interference (artifacts) (Gao et al,
2010) (Marecek et al, 2016).
b) The following blocks show the basic steps involved in a digital filter.
Paraphrase This Document
Need a fresh take? Get an instant paraphrase of this document with our AI Paraphraser
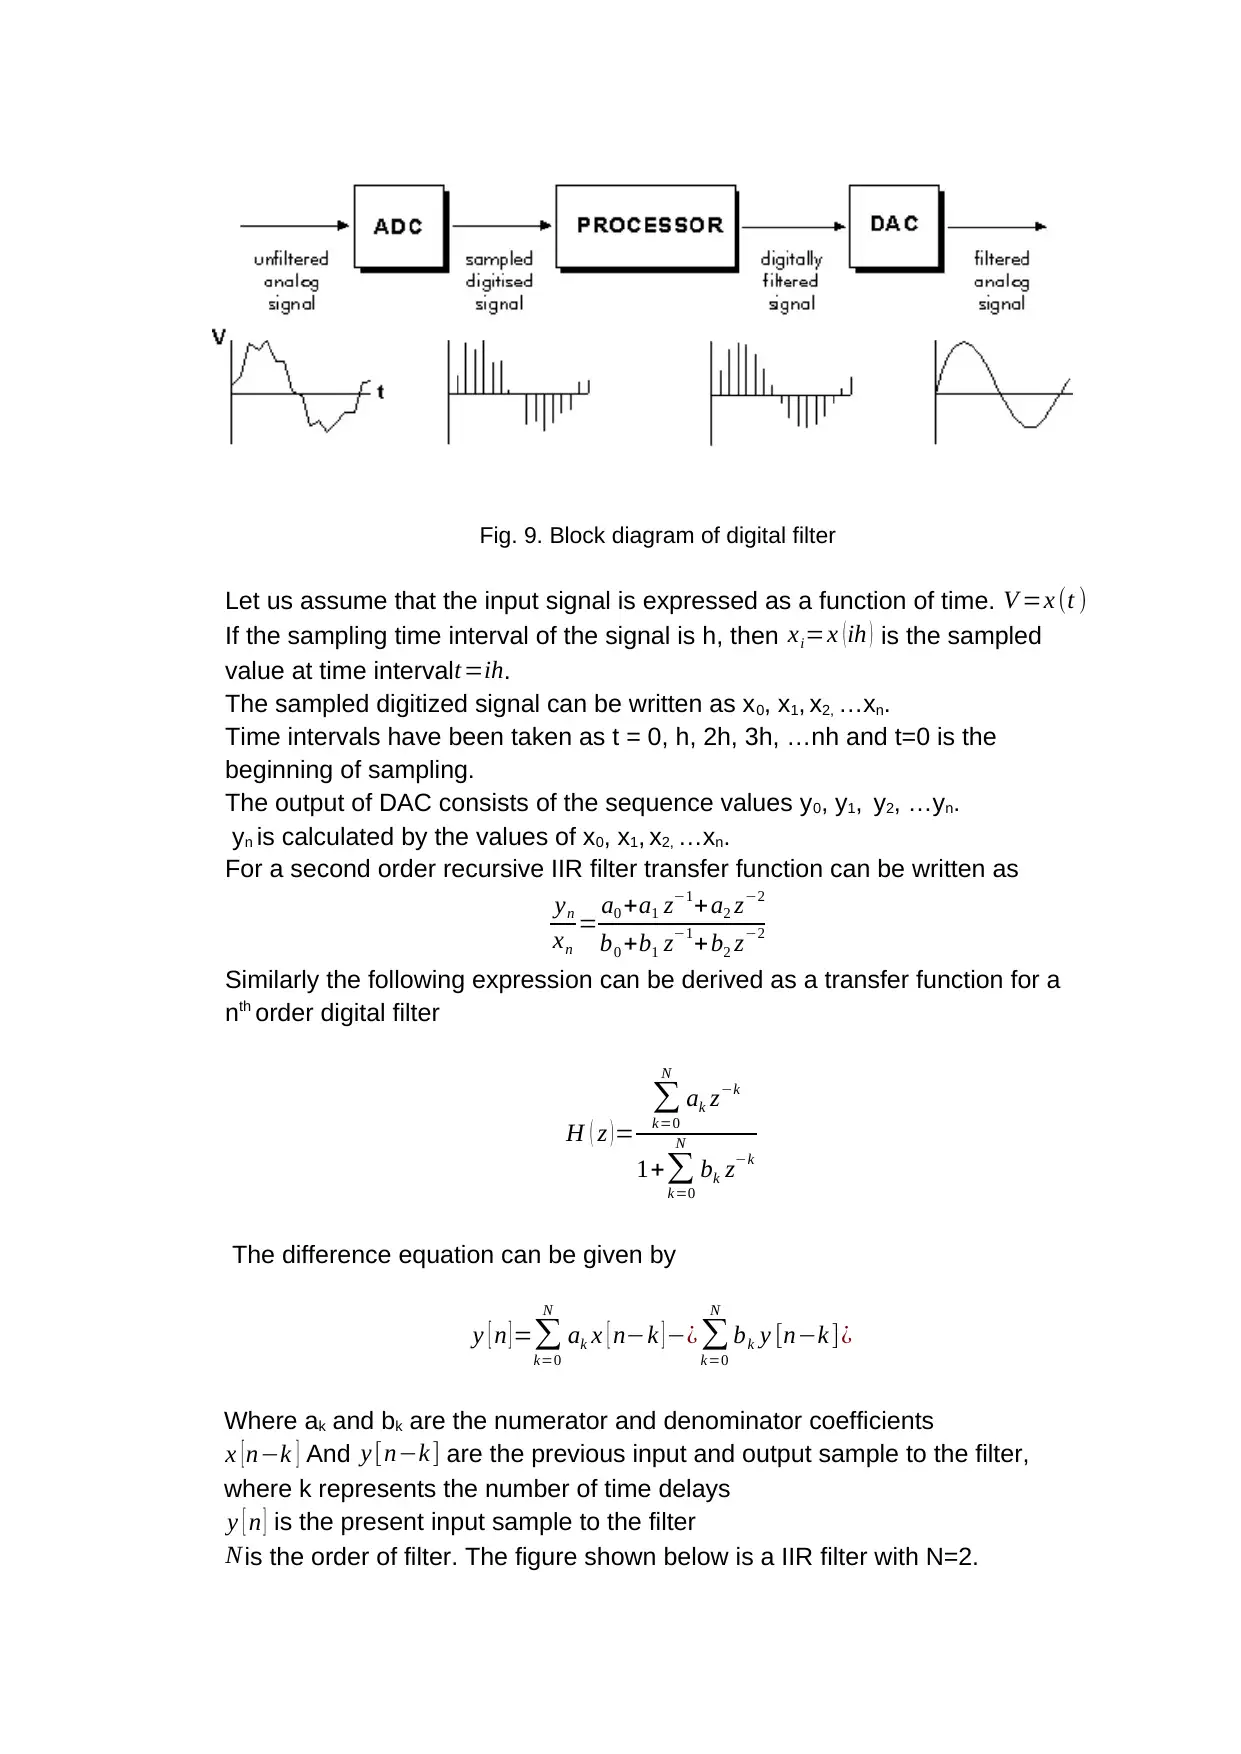
Fig. 9. Block diagram of digital filter
Let us assume that the input signal is expressed as a function of time. V =x (t )
If the sampling time interval of the signal is h, then xi=x ( ih ) is the sampled
value at time interval t=ih.
The sampled digitized signal can be written as x0, x1, x2, …xn.
Time intervals have been taken as t = 0, h, 2h, 3h, …nh and t=0 is the
beginning of sampling.
The output of DAC consists of the sequence values y0, y1, y2, …yn.
yn is calculated by the values of x0, x1, x2, …xn.
For a second order recursive IIR filter transfer function can be written as
yn
xn
= a0 +a1 z−1+a2 z−2
b0 +b1 z−1+b2 z−2
Similarly the following expression can be derived as a transfer function for a
nth order digital filter
H ( z )=
∑
k=0
N
ak z−k
1+∑
k=0
N
bk z−k
The difference equation can be given by
y [ n ] =∑
k=0
N
ak x [ n−k ] −¿ ∑
k=0
N
bk y [n−k ]¿
Where ak and bk are the numerator and denominator coefficients
x [ n−k ] And y [n−k ] are the previous input and output sample to the filter,
where k represents the number of time delays
y [ n ] is the present input sample to the filter
Nis the order of filter. The figure shown below is a IIR filter with N=2.
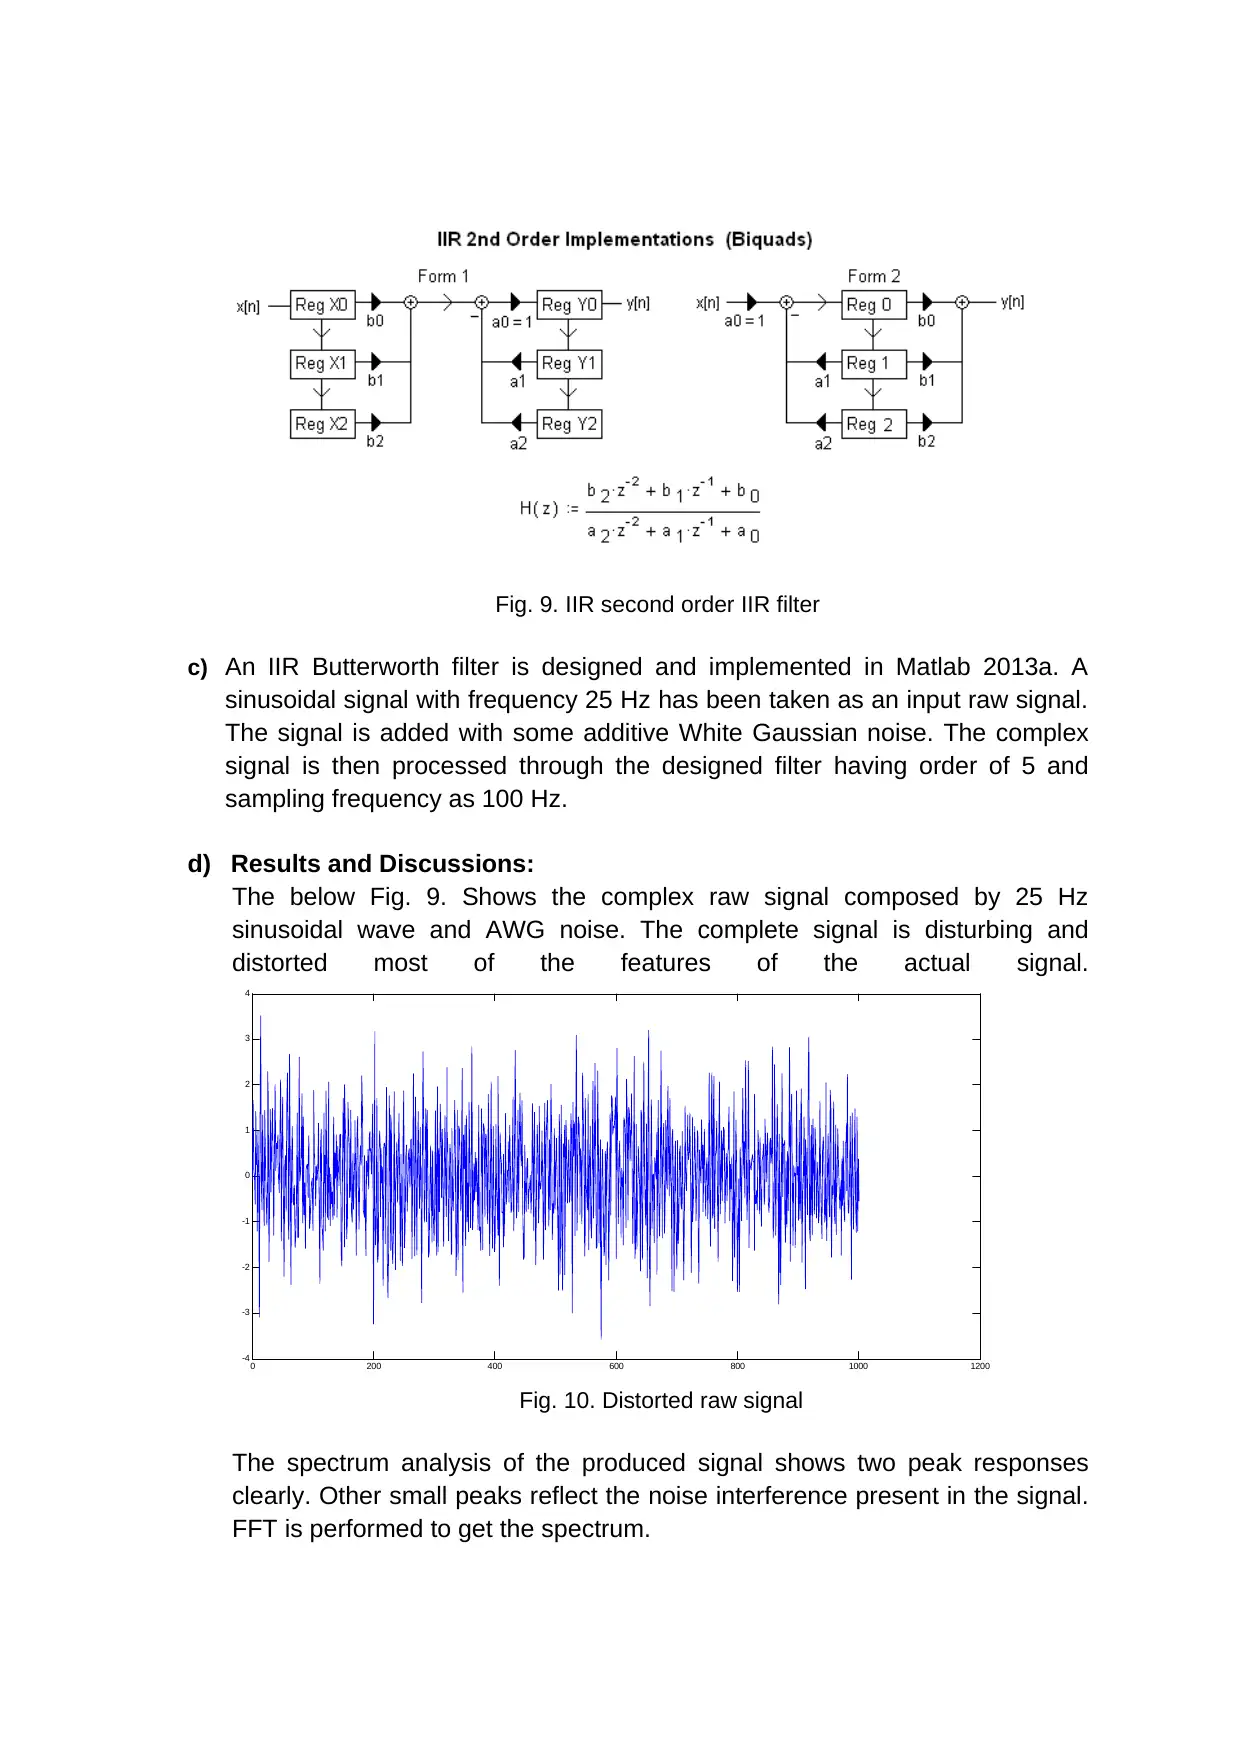
Fig. 9. IIR second order IIR filter
c) An IIR Butterworth filter is designed and implemented in Matlab 2013a. A
sinusoidal signal with frequency 25 Hz has been taken as an input raw signal.
The signal is added with some additive White Gaussian noise. The complex
signal is then processed through the designed filter having order of 5 and
sampling frequency as 100 Hz.
d) Results and Discussions:
The below Fig. 9. Shows the complex raw signal composed by 25 Hz
sinusoidal wave and AWG noise. The complete signal is disturbing and
distorted most of the features of the actual signal.
0 200 400 600 800 1000 1200
-4
-3
-2
-1
0
1
2
3
4
Fig. 10. Distorted raw signal
The spectrum analysis of the produced signal shows two peak responses
clearly. Other small peaks reflect the noise interference present in the signal.
FFT is performed to get the spectrum.
0 200 400 600 800 1000 1200
0
50
100
150
200
250
300
350
400
450
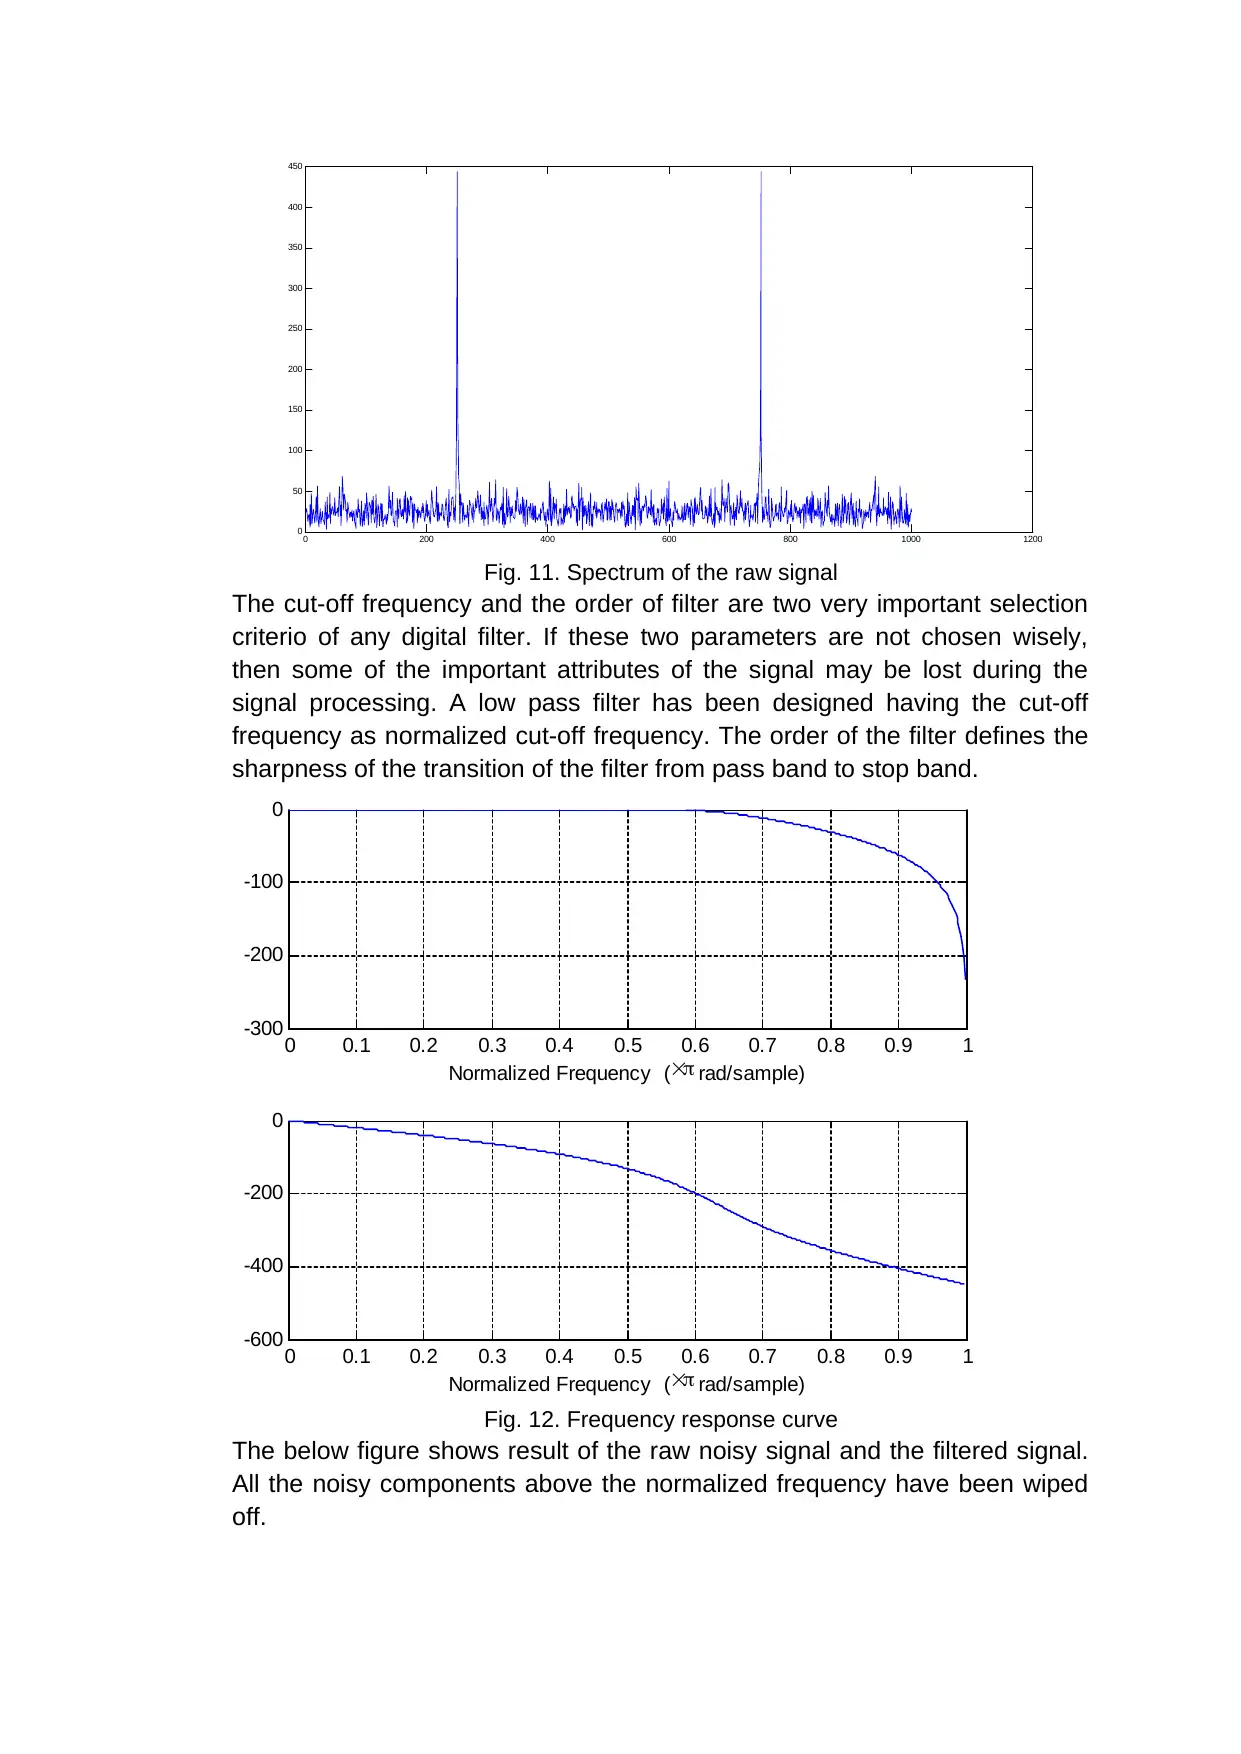
Fig. 11. Spectrum of the raw signal
The cut-off frequency and the order of filter are two very important selection
criterio of any digital filter. If these two parameters are not chosen wisely,
then some of the important attributes of the signal may be lost during the
signal processing. A low pass filter has been designed having the cut-off
frequency as normalized cut-off frequency. The order of the filter defines the
sharpness of the transition of the filter from pass band to stop band.
0 0.1 0.2 0.3 0.4 0.5 0.6 0.7 0.8 0.9 1
-600
-400
-200
0
Normalized Frequency ( rad/sample)
Phase (degrees)
0 0.1 0.2 0.3 0.4 0.5 0.6 0.7 0.8 0.9 1
-300
-200
-100
0
Normalized Frequency ( rad/sample)
Magnitude (dB)
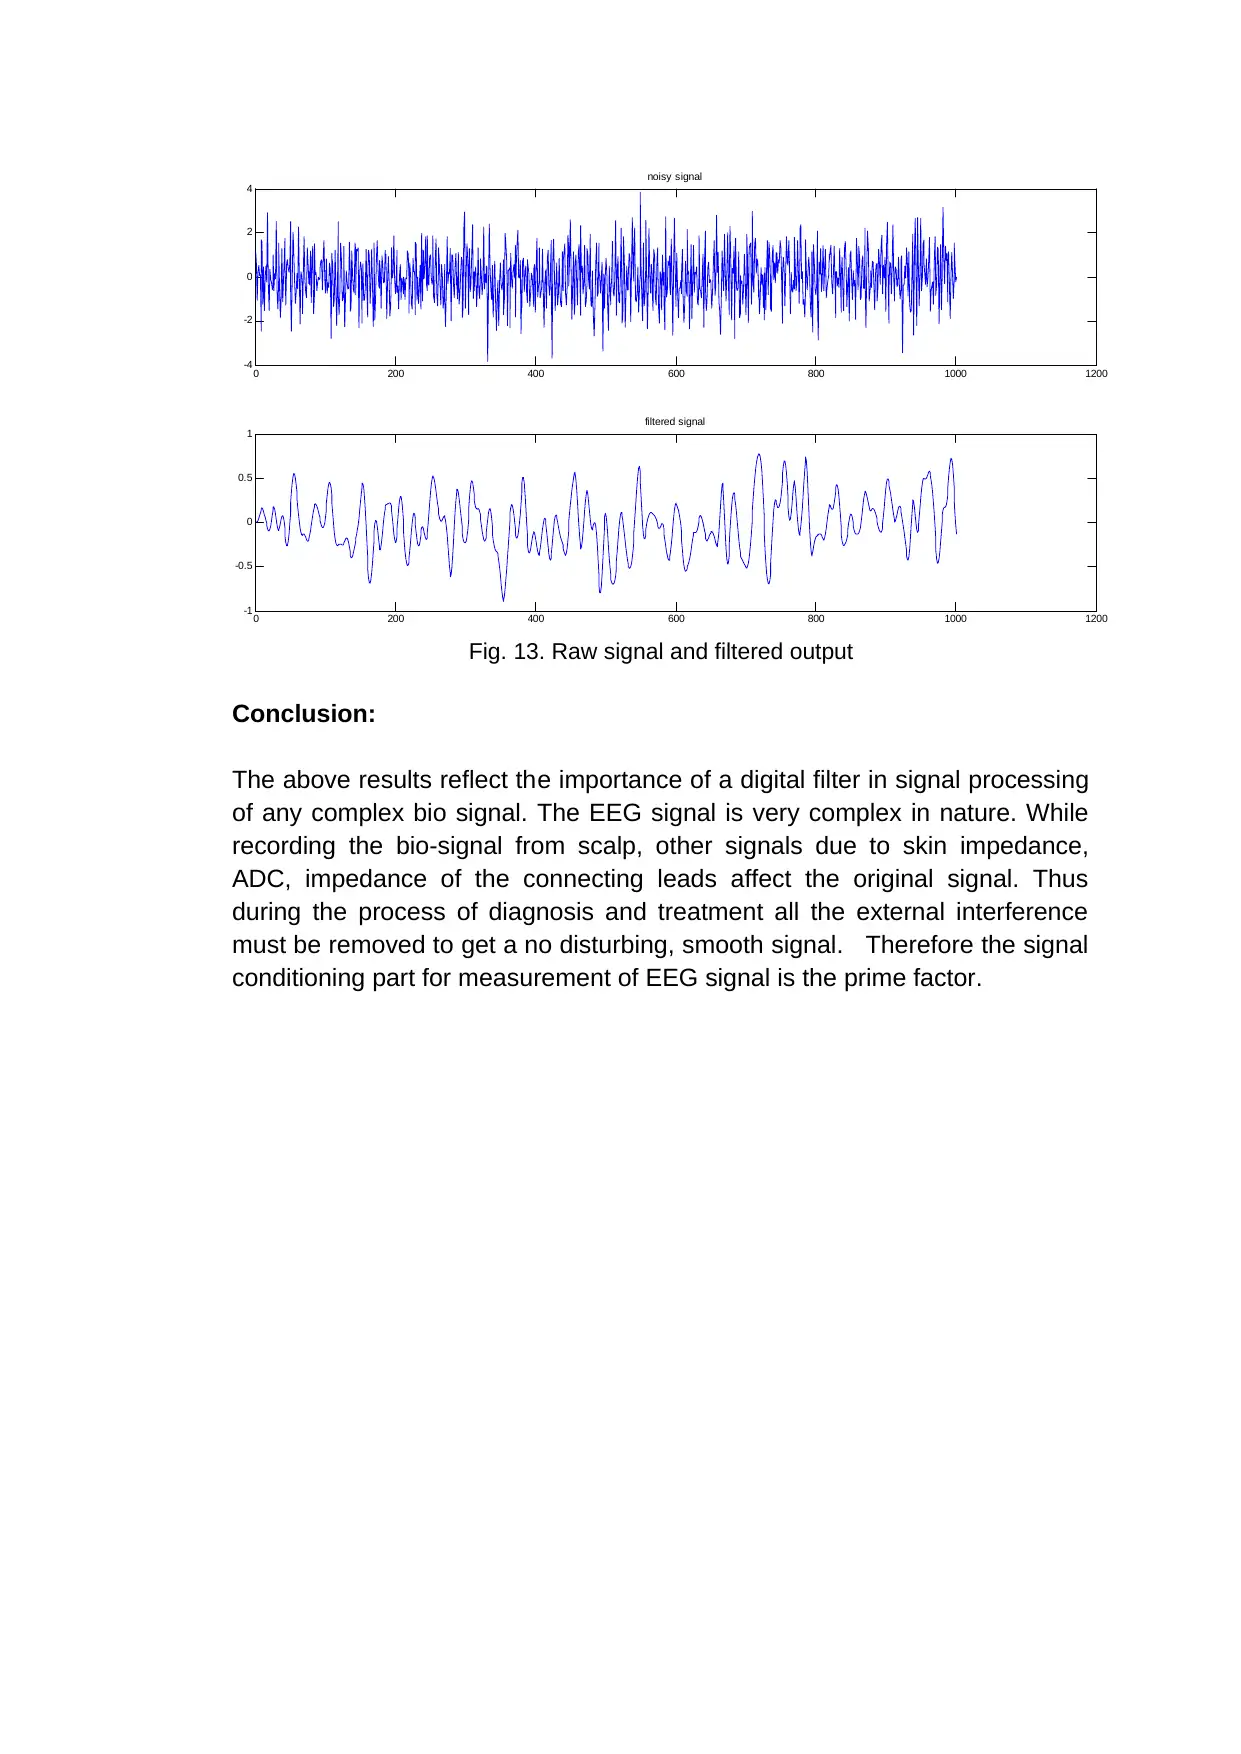
Fig. 12. Frequency response curve
The below figure shows result of the raw noisy signal and the filtered signal.
All the noisy components above the normalized frequency have been wiped
off.
0
50
100
150
200
250
300
350
400
450
Fig. 11. Spectrum of the raw signal
The cut-off frequency and the order of filter are two very important selection
criterio of any digital filter. If these two parameters are not chosen wisely,
then some of the important attributes of the signal may be lost during the
signal processing. A low pass filter has been designed having the cut-off
frequency as normalized cut-off frequency. The order of the filter defines the
sharpness of the transition of the filter from pass band to stop band.
0 0.1 0.2 0.3 0.4 0.5 0.6 0.7 0.8 0.9 1
-600
-400
-200
0
Normalized Frequency ( rad/sample)
Phase (degrees)
0 0.1 0.2 0.3 0.4 0.5 0.6 0.7 0.8 0.9 1
-300
-200
-100
0
Normalized Frequency ( rad/sample)
Magnitude (dB)
Fig. 12. Frequency response curve
The below figure shows result of the raw noisy signal and the filtered signal.
All the noisy components above the normalized frequency have been wiped
off.
Secure Best Marks with AI Grader
Need help grading? Try our AI Grader for instant feedback on your assignments.
0 200 400 600 800 1000 1200
-4
-2
0
2
4
noisy signal
0 200 400 600 800 1000 1200
-1
-0.5
0
0.5
1
filtered signal
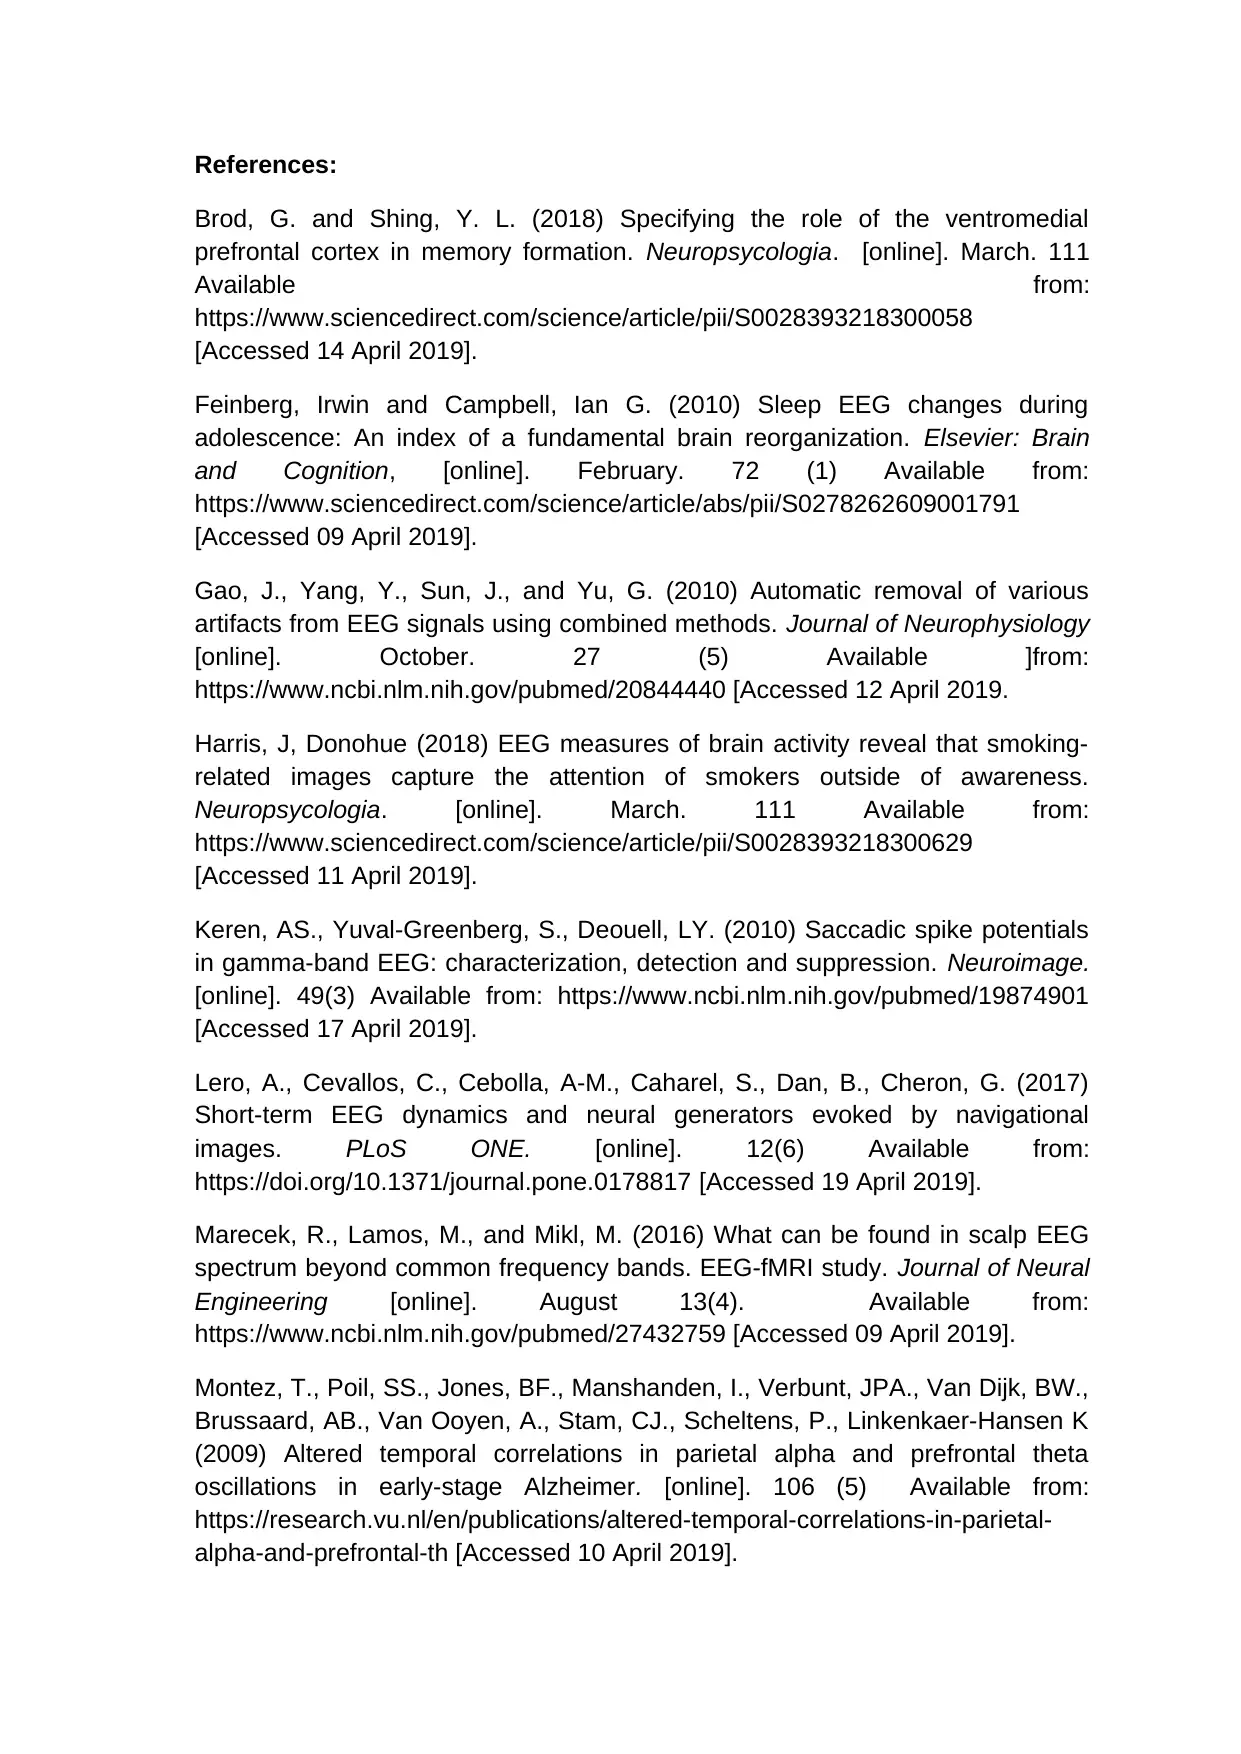
Fig. 13. Raw signal and filtered output
Conclusion:
The above results reflect the importance of a digital filter in signal processing
of any complex bio signal. The EEG signal is very complex in nature. While
recording the bio-signal from scalp, other signals due to skin impedance,
ADC, impedance of the connecting leads affect the original signal. Thus
during the process of diagnosis and treatment all the external interference
must be removed to get a no disturbing, smooth signal. Therefore the signal
conditioning part for measurement of EEG signal is the prime factor.
-4
-2
0
2
4
noisy signal
0 200 400 600 800 1000 1200
-1
-0.5
0
0.5
1
filtered signal
Fig. 13. Raw signal and filtered output
Conclusion:
The above results reflect the importance of a digital filter in signal processing
of any complex bio signal. The EEG signal is very complex in nature. While
recording the bio-signal from scalp, other signals due to skin impedance,
ADC, impedance of the connecting leads affect the original signal. Thus
during the process of diagnosis and treatment all the external interference
must be removed to get a no disturbing, smooth signal. Therefore the signal
conditioning part for measurement of EEG signal is the prime factor.
References:
Brod, G. and Shing, Y. L. (2018) Specifying the role of the ventromedial
prefrontal cortex in memory formation. Neuropsycologia. [online]. March. 111
Available from:
https://www.sciencedirect.com/science/article/pii/S0028393218300058
[Accessed 14 April 2019].
Feinberg, Irwin and Campbell, Ian G. (2010) Sleep EEG changes during
adolescence: An index of a fundamental brain reorganization. Elsevier: Brain
and Cognition, [online]. February. 72 (1) Available from:
https://www.sciencedirect.com/science/article/abs/pii/S0278262609001791
[Accessed 09 April 2019].
Gao, J., Yang, Y., Sun, J., and Yu, G. (2010) Automatic removal of various
artifacts from EEG signals using combined methods. Journal of Neurophysiology
[online]. October. 27 (5) Available ]from:
https://www.ncbi.nlm.nih.gov/pubmed/20844440 [Accessed 12 April 2019.
Harris, J, Donohue (2018) EEG measures of brain activity reveal that smoking-
related images capture the attention of smokers outside of awareness.
Neuropsycologia. [online]. March. 111 Available from:
https://www.sciencedirect.com/science/article/pii/S0028393218300629
[Accessed 11 April 2019].
Keren, AS., Yuval-Greenberg, S., Deouell, LY. (2010) Saccadic spike potentials
in gamma-band EEG: characterization, detection and suppression. Neuroimage.
[online]. 49(3) Available from: https://www.ncbi.nlm.nih.gov/pubmed/19874901
[Accessed 17 April 2019].
Lero, A., Cevallos, C., Cebolla, A-M., Caharel, S., Dan, B., Cheron, G. (2017)
Short-term EEG dynamics and neural generators evoked by navigational
images. PLoS ONE. [online]. 12(6) Available from:
https://doi.org/10.1371/journal.pone.0178817 [Accessed 19 April 2019].
Marecek, R., Lamos, M., and Mikl, M. (2016) What can be found in scalp EEG
spectrum beyond common frequency bands. EEG-fMRI study. Journal of Neural
Engineering [online]. August 13(4). Available from:
https://www.ncbi.nlm.nih.gov/pubmed/27432759 [Accessed 09 April 2019].
Montez, T., Poil, SS., Jones, BF., Manshanden, I., Verbunt, JPA., Van Dijk, BW.,
Brussaard, AB., Van Ooyen, A., Stam, CJ., Scheltens, P., Linkenkaer-Hansen K
(2009) Altered temporal correlations in parietal alpha and prefrontal theta
oscillations in early-stage Alzheimer. [online]. 106 (5) Available from:
https://research.vu.nl/en/publications/altered-temporal-correlations-in-parietal-
alpha-and-prefrontal-th [Accessed 10 April 2019].
Nolan, H., Whelan, R., and Reilly, RB. (2010) FASTER: Fully Automated
Statistical Thresholding for EEG artifact Rejection. Journal of Neural Engineering
[online]. September. 192(1) Available from:
https://www.ncbi.nlm.nih.gov/pubmed/20654646 [Accessed 12 April 2019].
Shacksman, AJ., McMenamin, BW., Maxwell, JS., Greischar, LL., and
Davidson, RJ.(2010) Identifying Robust and Sensitive Frequency Bands for
Interrogating Neural Oscillations. Neuroimage [online]. July 51 (4) Available
from: https://www.ncbi.nlm.nih.gov/pmc/articles/PMC2871966/ [Accessed 12
April 2019].
Whittingstall, K and Logosthetic, NK. (2009) Frequency-band coupling in surface
EEG reflects spiking activity in monkey visual cortex. Neuron. [online]. 64 (2)
Available from: https://www.ncbi.nlm.nih.gov/pubmed/19874794 [Accessed 18
April 2019].
Yasui, Yoshitsugu. (2009) A Brainwave Signal Measurement and Data
Processing Technique for Daily Life Applications Journal of PHYSIOLOGICAL
ANTHROPOLOGY [online]. 28 (3) Available from:
https://www.ncbi.nlm.nih.gov/pubmed/12899256 [Accessed 11 April 2019].
1 out of 13

Your All-in-One AI-Powered Toolkit for Academic Success.
+13062052269
info@desklib.com
Available 24*7 on WhatsApp / Email
![[object Object]](/_next/static/media/star-bottom.7253800d.svg)
Unlock your academic potential
© 2024 | Zucol Services PVT LTD | All rights reserved.