logo

Null and Alternative hypothesis test

6 Pages1132 Words409 Views
   

Added on  2023-04-26

About This Document

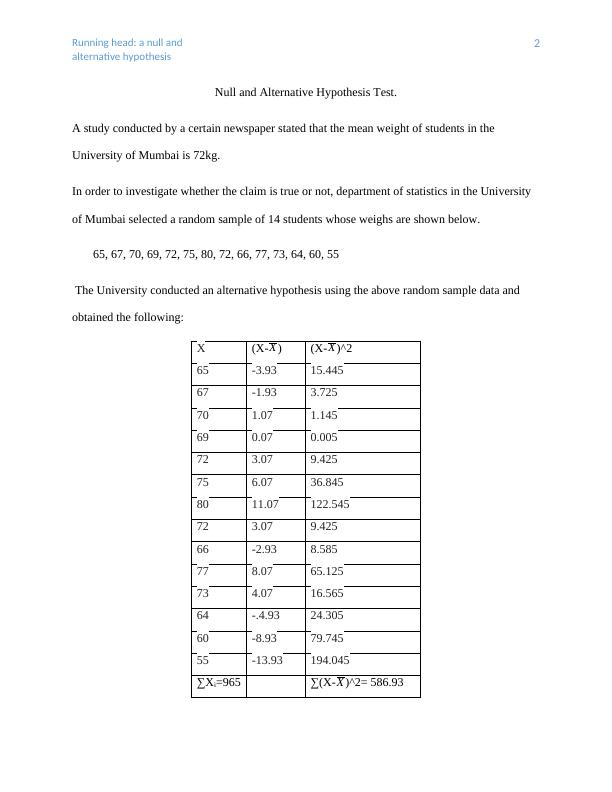
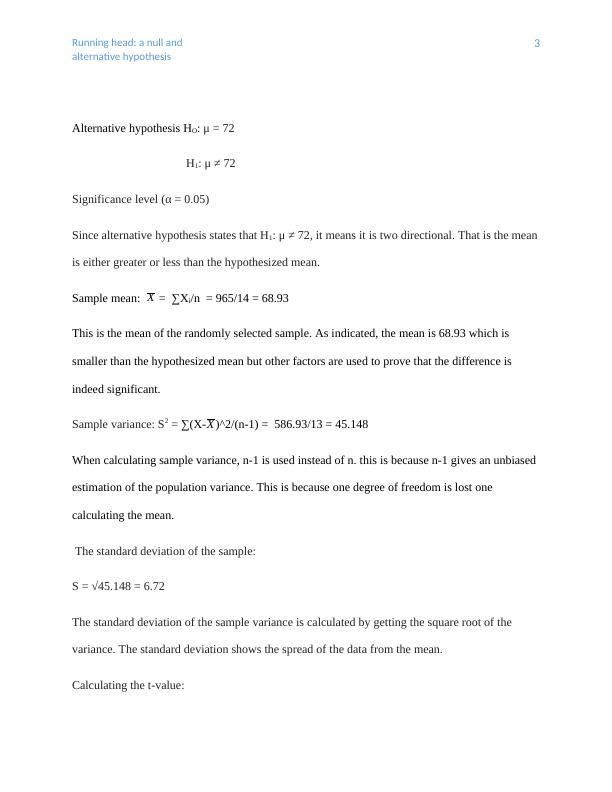
This article explains the concept of Null and Alternative hypothesis test with an example. It covers the significance level, sample mean, sample variance, standard deviation, t-value, decision rule, and conclusion. The article also discusses the difference between the sample mean and hypothesized mean, comparison between the sample and population characteristics, and the probability of type I and type II errors.

Null and Alternative hypothesis test

   Added on 2023-04-26

ShareRelated Documents
Running head: a null and
alternative hypothesis
1
Null and Alternative hypothesis test
Name:
Instructor:
Affiliated institution:
Null and Alternative hypothesis test_1
Running head: a null and
alternative hypothesis
2
Null and Alternative Hypothesis Test.
A study conducted by a certain newspaper stated that the mean weight of students in the
University of Mumbai is 72kg.
In order to investigate whether the claim is true or not, department of statistics in the University
of Mumbai selected a random sample of 14 students whose weighs are shown below.
65, 67, 70, 69, 72, 75, 80, 72, 66, 77, 73, 64, 60, 55
The University conducted an alternative hypothesis using the above random sample data and
obtained the following:
X (X-X ) (X-X )^2
65 -3.93 15.445
67 -1.93 3.725
70 1.07 1.145
69 0.07 0.005
72 3.07 9.425
75 6.07 36.845
80 11.07 122.545
72 3.07 9.425
66 -2.93 8.585
77 8.07 65.125
73 4.07 16.565
64 -.4.93 24.305
60 -8.93 79.745
55 -13.93 194.045
∑Xi=965 ∑(X-X )^2= 586.93
Null and Alternative hypothesis test_2
Running head: a null and
alternative hypothesis
3
Alternative hypothesis HO: μ = 72
H1: μ ≠ 72
Significance level (α = 0.05)
Since alternative hypothesis states that H1: μ ≠ 72, it means it is two directional. That is the mean
is either greater or less than the hypothesized mean.
Sample mean: X = ∑Xi/n = 965/14 = 68.93
This is the mean of the randomly selected sample. As indicated, the mean is 68.93 which is
smaller than the hypothesized mean but other factors are used to prove that the difference is
indeed significant.
Sample variance: S2 = ∑(X-X )^2/(n-1) = 586.93/13 = 45.148
When calculating sample variance, n-1 is used instead of n. this is because n-1 gives an unbiased
estimation of the population variance. This is because one degree of freedom is lost one
calculating the mean.
The standard deviation of the sample:
S = √45.148 = 6.72
The standard deviation of the sample variance is calculated by getting the square root of the
variance. The standard deviation shows the spread of the data from the mean.
Calculating the t-value:
Null and Alternative hypothesis test_3

End of preview

Want to access all the pages? Upload your documents or become a member.

Related Documents
Statistical Reasoning
|11
|1658
|58

Statistical Problems: One Sample t-test, Two Sample t-test, Two Sample Proportion z-test, One-way ANOVA
|8
|1638
|262

Statistics. Statistics Student name: Tutor name:. 1|Pag
|4
|455
|86

Population mean or mean score of school
|7
|983
|42

Homework 4 (Individual Exercise)
|7
|1226
|81

Solutions to Assignment
|9
|1717
|78