logo

Solutions to Assignment

An assignment on probability and statistics which includes calculating confidence intervals for population mean temperature in a sample of houses.

9 Pages1717 Words78 Views
   

Added on  2023-01-19

About This Document

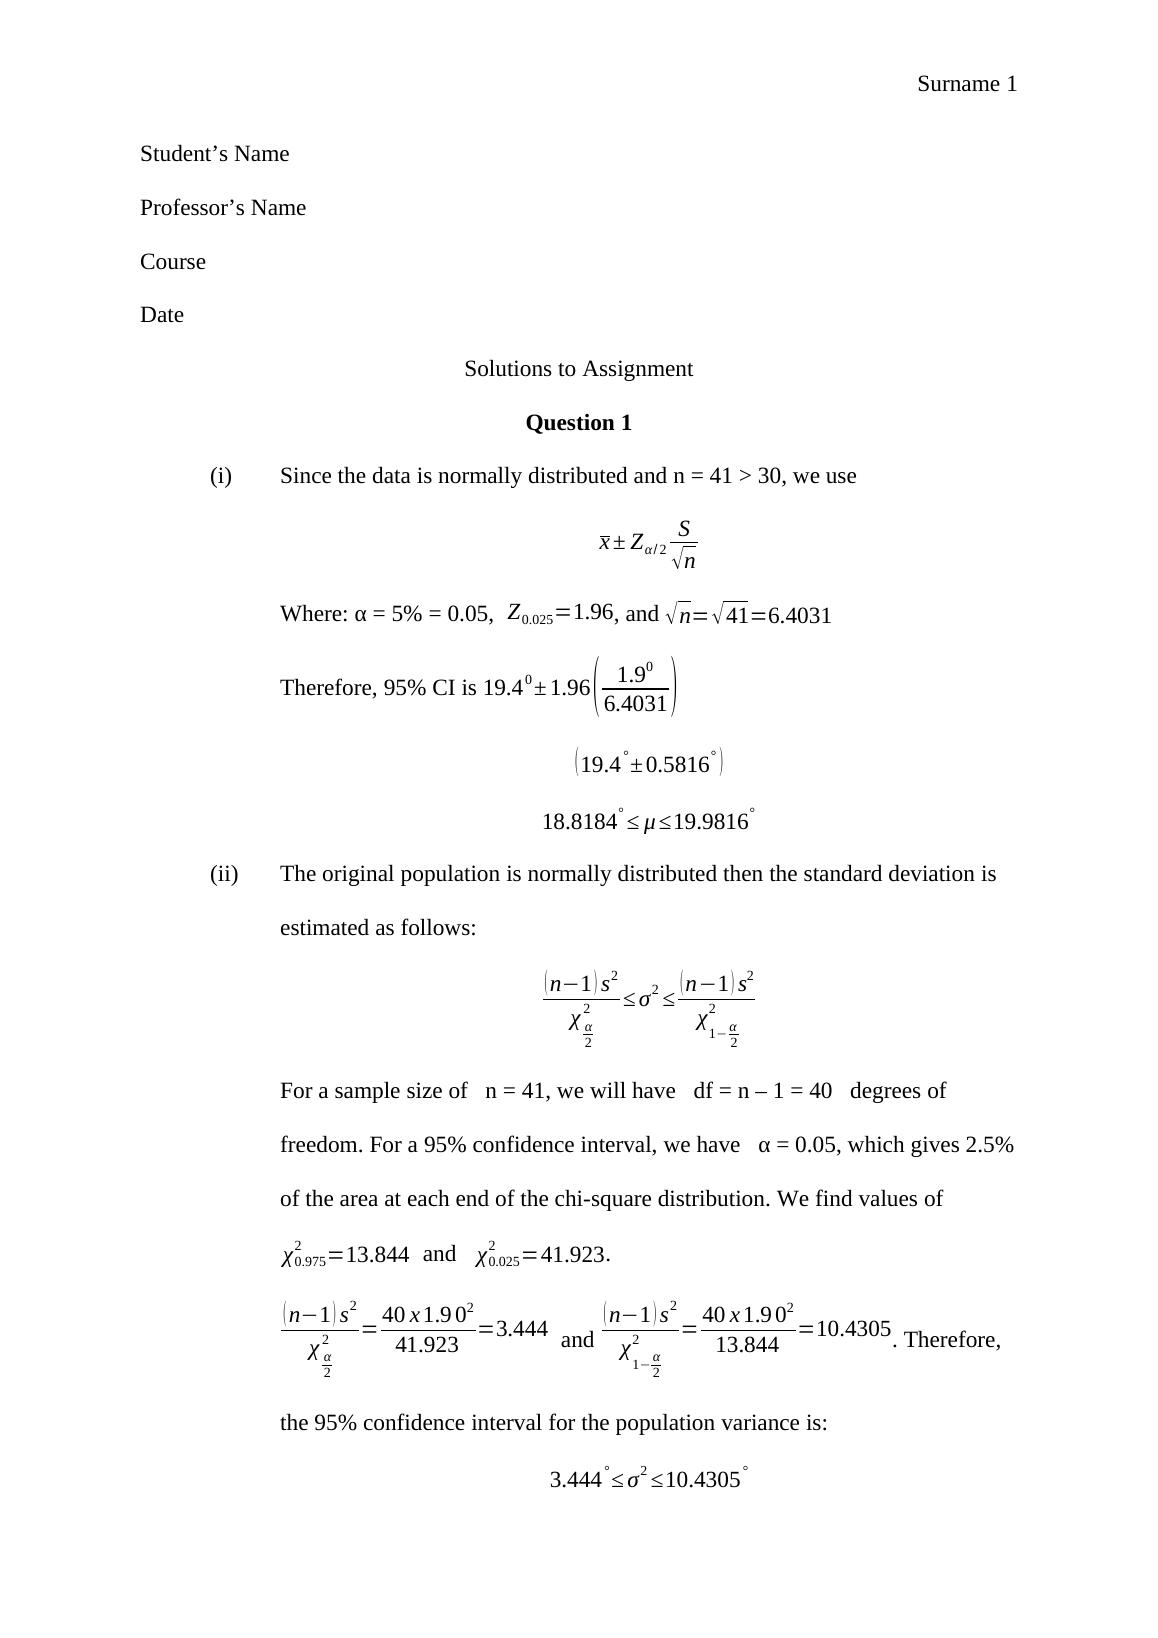
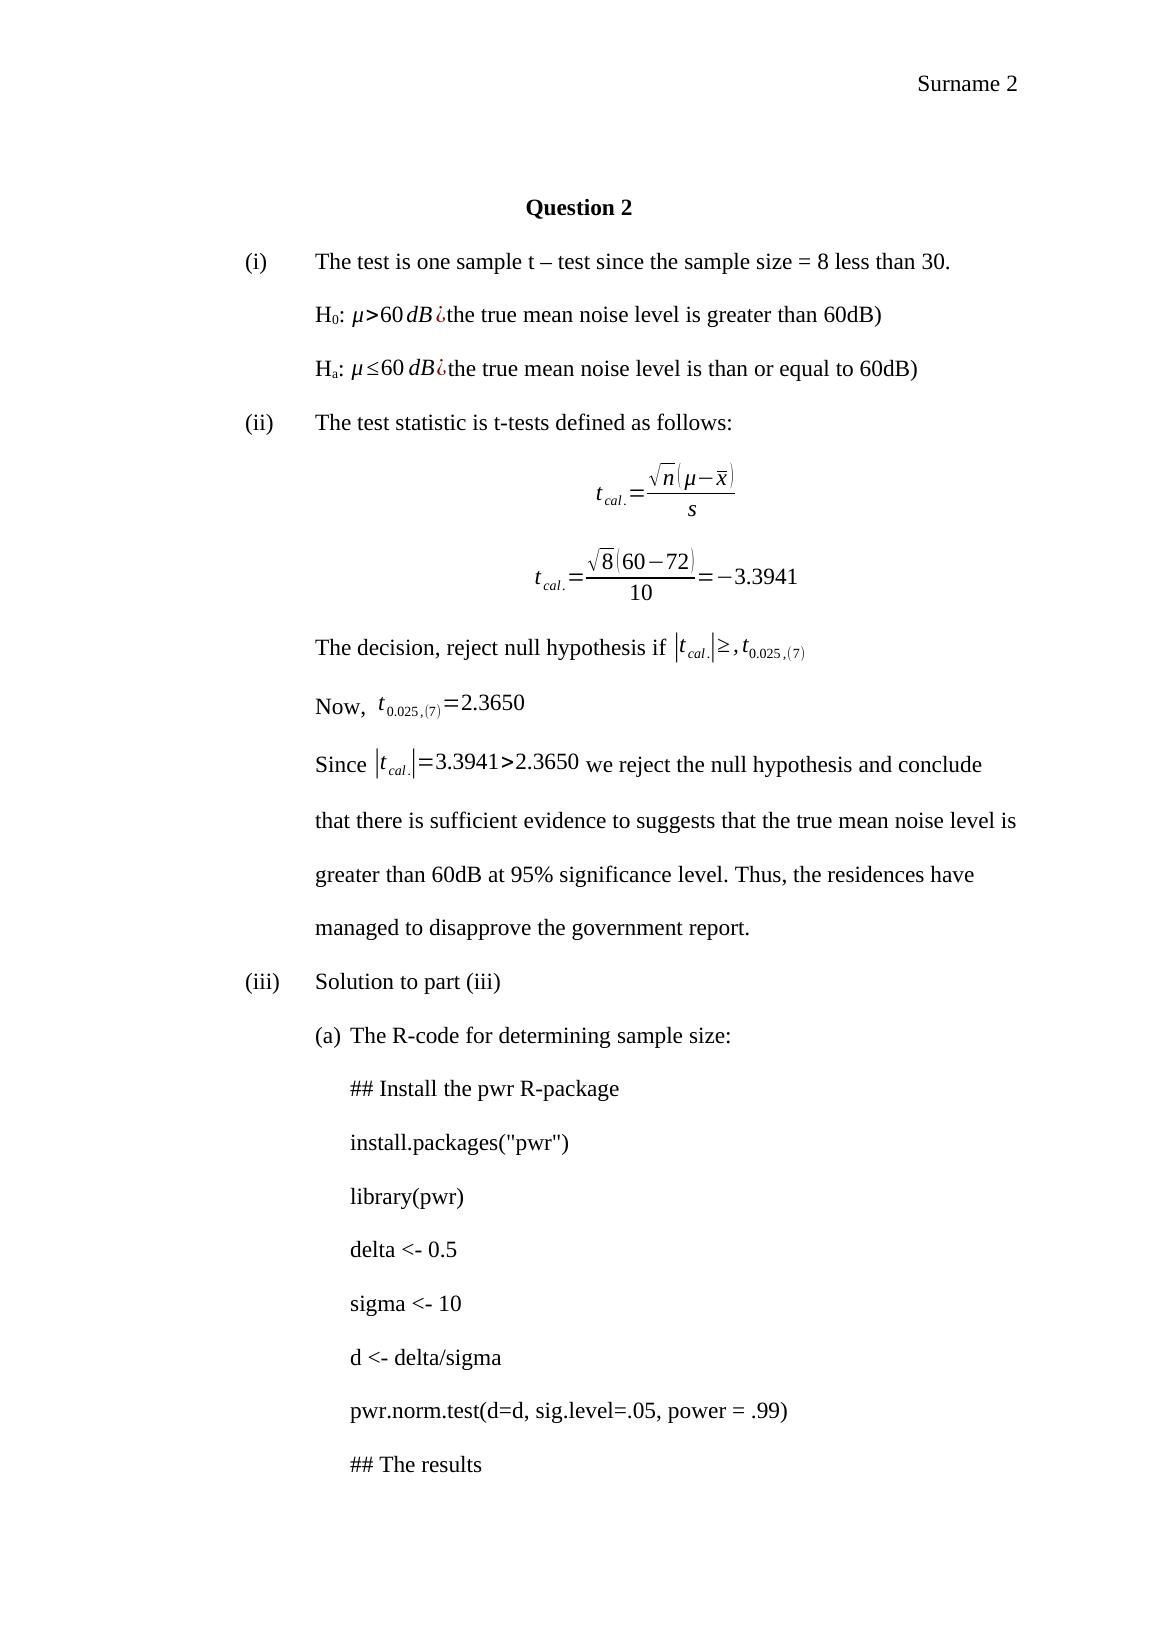
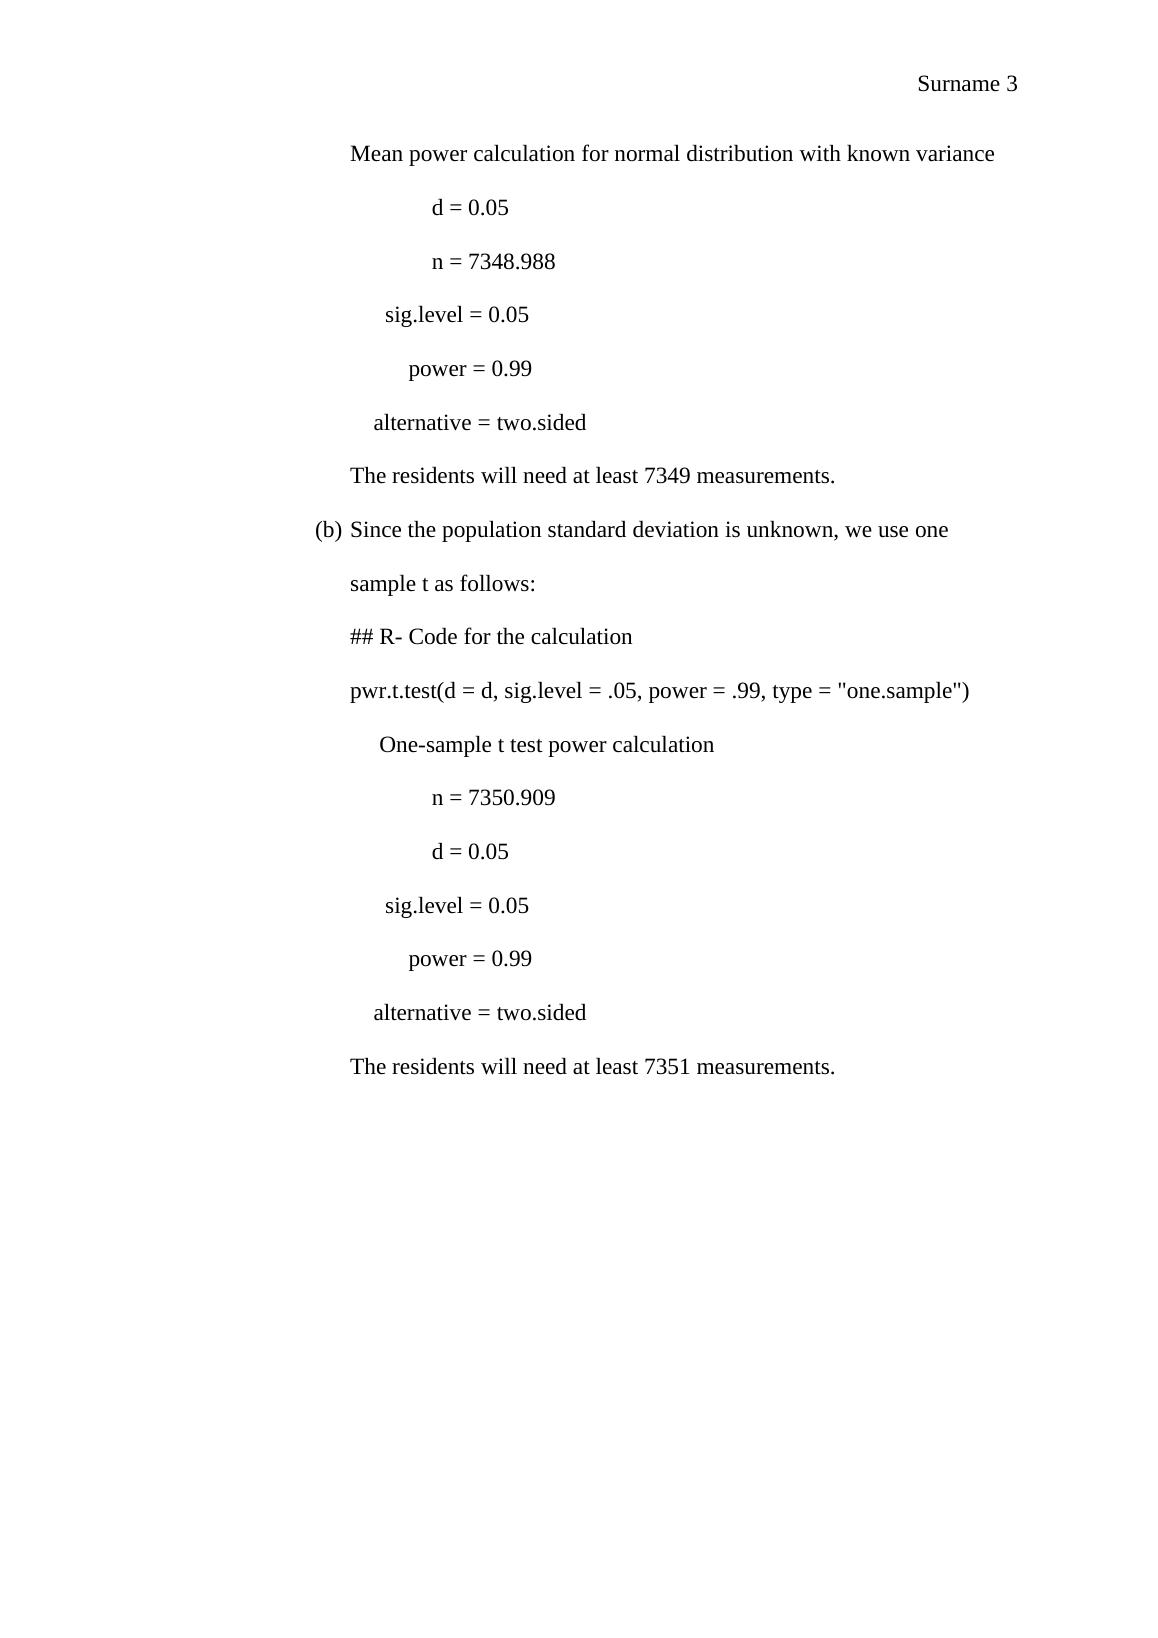
This document provides solutions to various assignment questions. It covers topics such as confidence intervals, hypothesis testing, and chi-square tests. The solutions are explained step by step with relevant formulas and calculations. The document also includes R code for performing statistical tests. The assignments are related to different subjects and courses.

Solutions to Assignment

An assignment on probability and statistics which includes calculating confidence intervals for population mean temperature in a sample of houses.

   Added on 2023-01-19

ShareRelated Documents
Surname 1
Student’s Name
Professor’s Name
Course
Date
Solutions to Assignment
Question 1
(i) Since the data is normally distributed and n = 41 > 30, we use
x ± Zα/ 2
S
n
Where: α = 5% = 0.05, Z0.025=1.96, and n= 41=6.4031
Therefore, 95% CI is 19.40 ± 1.96 ( 1.90
6.4031 )
( 19.4° ± 0.5816° )
18.8184° μ 19.9816°
(ii) The original population is normally distributed then the standard deviation is
estimated as follows:
( n1 ) s2
χ α
2
2 σ2 ( n1 ) s2
χ1 α
2
2
For a sample size of n = 41, we will have df = n – 1 = 40 degrees of
freedom. For a 95% confidence interval, we have α = 0.05, which gives 2.5%
of the area at each end of the chi-square distribution. We find values of
χ0.975
2 =13.844 and χ0.025
2 =41.923.
( n1 ) s2
χ α
2
2 = 40 x 1.9 02
41.923 =3.444 and
( n1 ) s2
χ1 α
2
2 = 40 x 1.9 02
13.844 =10.4305. Therefore,
the 95% confidence interval for the population variance is:
3.444° σ2 10.4305°
Solutions to Assignment_1
Surname 2
Question 2
(i) The test is one sample t – test since the sample size = 8 less than 30.
H0: μ>60 dB ¿the true mean noise level is greater than 60dB)
Ha: μ 60 dB¿the true mean noise level is than or equal to 60dB)
(ii) The test statistic is t-tests defined as follows:
tcal .= n ( μx )
s
tcal .= 8 ( 6072 )
10 =3.3941
The decision, reject null hypothesis if |tcal .| , t0.025 ,(7)
Now, t0.025 ,(7)=2.3650
Since |tcal .|=3.3941>2.3650 we reject the null hypothesis and conclude
that there is sufficient evidence to suggests that the true mean noise level is
greater than 60dB at 95% significance level. Thus, the residences have
managed to disapprove the government report.
(iii) Solution to part (iii)
(a) The R-code for determining sample size:
## Install the pwr R-package
install.packages("pwr")
library(pwr)
delta <- 0.5
sigma <- 10
d <- delta/sigma
pwr.norm.test(d=d, sig.level=.05, power = .99)
## The results
Solutions to Assignment_2
Surname 3
Mean power calculation for normal distribution with known variance
d = 0.05
n = 7348.988
sig.level = 0.05
power = 0.99
alternative = two.sided
The residents will need at least 7349 measurements.
(b) Since the population standard deviation is unknown, we use one
sample t as follows:
## R- Code for the calculation
pwr.t.test(d = d, sig.level = .05, power = .99, type = "one.sample")
One-sample t test power calculation
n = 7350.909
d = 0.05
sig.level = 0.05
power = 0.99
alternative = two.sided
The residents will need at least 7351 measurements.
Solutions to Assignment_3

End of preview

Want to access all the pages? Upload your documents or become a member.

Related Documents
Statistical Problems: One Sample t-test, Two Sample t-test, Two Sample Proportion z-test, One-way ANOVA
|8
|1638
|262

Confidence Interval and Hypothesis Testing for Population Mean
|5
|725
|430

Stock Return Analysis
|8
|1300
|101

Comparison of Tar Yield in Side Stream and Main Stream Smokers
|19
|3282
|90

Biostatistics Assignment Solutions and Examples
|7
|855
|268

Statistics Assignment 9
|10
|1808
|50