Accounting and Finance for Managers
Added on 2023-01-10
27 Pages4544 Words82 Views
ACCOUNTING AND FINANCE FOR MANAGERS
1
ACCOUNTING AND FINANCE FOR MANAGERS
1
ACCOUNTING AND FINANCE FOR MANAGERS
ACCOUNTING AND FINANCE FOR MANAGERS
2
Contents
Section A:................................................................................................................ 3
Part a:.................................................................................................................. 3
Debt to total assets ratio:...................................................................................... 10
Part b:................................................................................................................ 13
Part c:................................................................................................................ 14
Section B:.............................................................................................................. 15
References............................................................................................................ 20
Appendix:.............................................................................................................. 22
ACCOUNTING AND FINANCE FOR MANAGERS
3
Section A:
Part a:
Financial ratios:
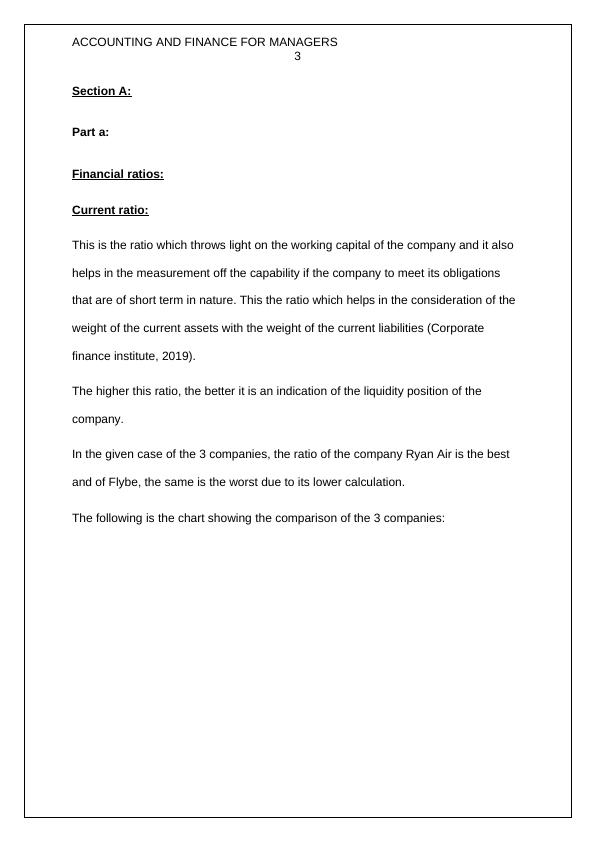
Current ratio:
This is the ratio which throws light on the working capital of the company and it also
helps in the measurement off the capability if the company to meet its obligations
that are of short term in nature. This the ratio which helps in the consideration of the
weight of the current assets with the weight of the current liabilities (Corporate
finance institute, 2019).
The higher this ratio, the better it is an indication of the liquidity position of the
company.
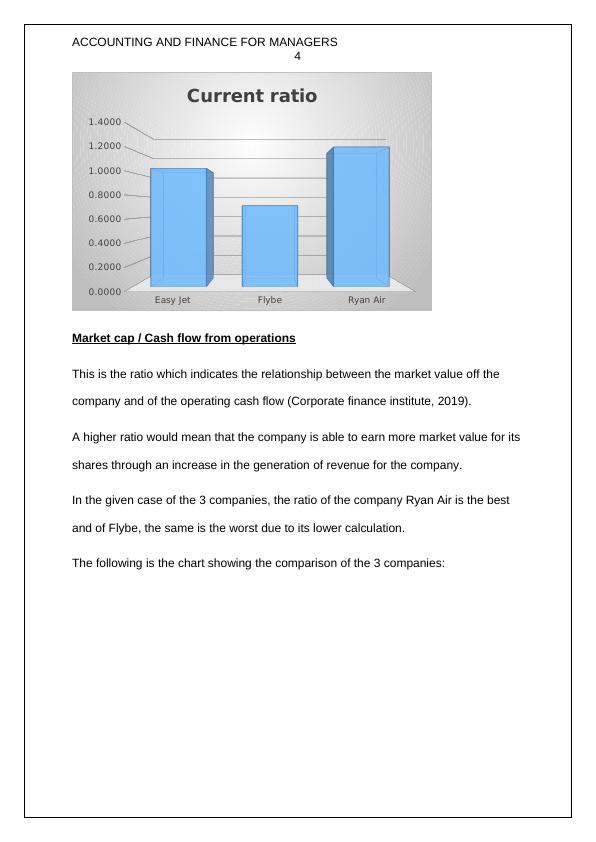
In the given case of the 3 companies, the ratio of the company Ryan Air is the best
and of Flybe, the same is the worst due to its lower calculation.
The following is the chart showing the comparison of the 3 companies:
3
Section A:
Part a:
Financial ratios:
Current ratio:
This is the ratio which throws light on the working capital of the company and it also
helps in the measurement off the capability if the company to meet its obligations
that are of short term in nature. This the ratio which helps in the consideration of the
weight of the current assets with the weight of the current liabilities (Corporate
finance institute, 2019).
The higher this ratio, the better it is an indication of the liquidity position of the
company.
In the given case of the 3 companies, the ratio of the company Ryan Air is the best
and of Flybe, the same is the worst due to its lower calculation.
The following is the chart showing the comparison of the 3 companies:
ACCOUNTING AND FINANCE FOR MANAGERS
4
Easy Jet Flybe Ryan Air
0.0000
0.2000
0.4000
0.6000
0.8000
1.0000
1.2000
1.4000
Current ratio
Market cap / Cash flow from operations
This is the ratio which indicates the relationship between the market value off the
company and of the operating cash flow (Corporate finance institute, 2019).
A higher ratio would mean that the company is able to earn more market value for its
shares through an increase in the generation of revenue for the company.
In the given case of the 3 companies, the ratio of the company Ryan Air is the best
and of Flybe, the same is the worst due to its lower calculation.
The following is the chart showing the comparison of the 3 companies:
ACCOUNTING AND FINANCE FOR MANAGERS
5
Easy Jet Flybe Ryan Air
0.0000
2.0000
4.0000
6.0000
8.0000
10.0000
12.0000
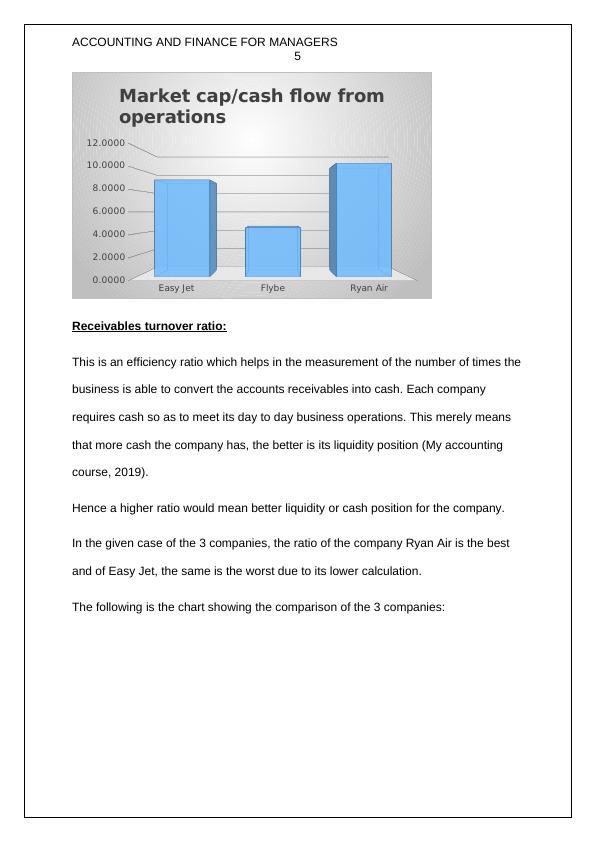
Market cap/cash flow from
operations
Receivables turnover ratio:
This is an efficiency ratio which helps in the measurement of the number of times the
business is able to convert the accounts receivables into cash. Each company
requires cash so as to meet its day to day business operations. This merely means
that more cash the company has, the better is its liquidity position (My accounting
course, 2019).
Hence a higher ratio would mean better liquidity or cash position for the company.
In the given case of the 3 companies, the ratio of the company Ryan Air is the best
and of Easy Jet, the same is the worst due to its lower calculation.
The following is the chart showing the comparison of the 3 companies:
5
Easy Jet Flybe Ryan Air
0.0000
2.0000
4.0000
6.0000
8.0000
10.0000
12.0000
Market cap/cash flow from
operations
Receivables turnover ratio:
This is an efficiency ratio which helps in the measurement of the number of times the
business is able to convert the accounts receivables into cash. Each company
requires cash so as to meet its day to day business operations. This merely means
that more cash the company has, the better is its liquidity position (My accounting
course, 2019).
Hence a higher ratio would mean better liquidity or cash position for the company.
In the given case of the 3 companies, the ratio of the company Ryan Air is the best
and of Easy Jet, the same is the worst due to its lower calculation.
The following is the chart showing the comparison of the 3 companies:
ACCOUNTING AND FINANCE FOR MANAGERS
6
Easy Jet Flybe Ryan Air
0.0000
20.0000
40.0000
60.0000
80.0000
100.0000
120.0000
140.0000
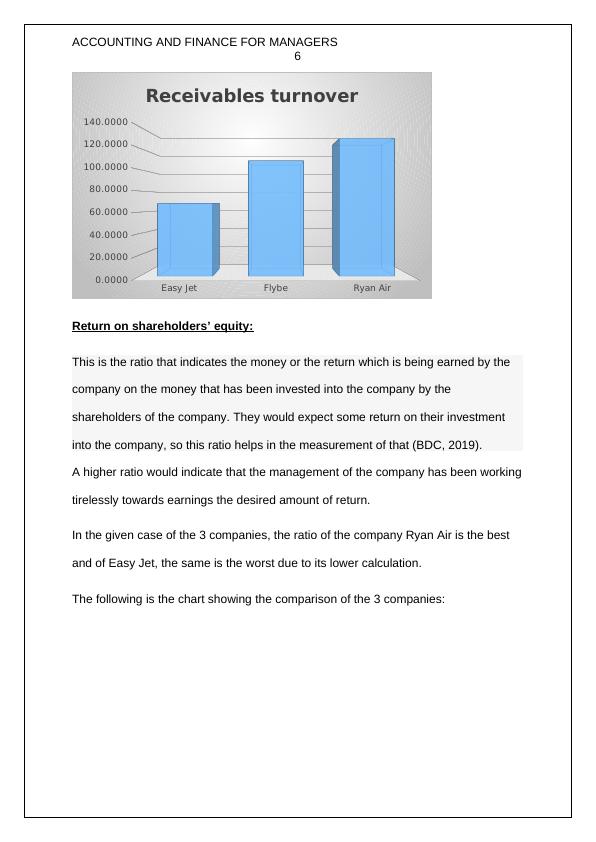
Receivables turnover
Return on shareholders’ equity:
This is the ratio that indicates the money or the return which is being earned by the
company on the money that has been invested into the company by the
shareholders of the company. They would expect some return on their investment
into the company, so this ratio helps in the measurement of that (BDC, 2019).
A higher ratio would indicate that the management of the company has been working
tirelessly towards earnings the desired amount of return.
In the given case of the 3 companies, the ratio of the company Ryan Air is the best
and of Easy Jet, the same is the worst due to its lower calculation.
The following is the chart showing the comparison of the 3 companies:
6
Easy Jet Flybe Ryan Air
0.0000
20.0000
40.0000
60.0000
80.0000
100.0000
120.0000
140.0000
Receivables turnover
Return on shareholders’ equity:
This is the ratio that indicates the money or the return which is being earned by the
company on the money that has been invested into the company by the
shareholders of the company. They would expect some return on their investment
into the company, so this ratio helps in the measurement of that (BDC, 2019).
A higher ratio would indicate that the management of the company has been working
tirelessly towards earnings the desired amount of return.
In the given case of the 3 companies, the ratio of the company Ryan Air is the best
and of Easy Jet, the same is the worst due to its lower calculation.
The following is the chart showing the comparison of the 3 companies:
End of preview
Want to access all the pages? Upload your documents or become a member.
Related Documents
Ratio Analysis and Investment Appraisal in Financelg...
|17
|3578
|76
Difference Between Accounting and Financelg...
|13
|3879
|18
Accounting for Managerslg...
|16
|3705
|78
Accounting and Finance Contentslg...
|13
|3677
|371
Finance Project Report: Ratio Analysis, BEP, DOL, DFL, Loan Recommendation, Policy Change Impactlg...
|9
|1361
|440
(PDF) Financial Accounting Assignmentlg...
|12
|3487
|405