Difference Between Accounting and Finance
13 Pages3879 Words18 Views
Added on 2021-02-19
Difference Between Accounting and Finance
Added on 2021-02-19
ShareRelated Documents
Accounting and Finance
Table of Contents
INTRODUCTION..............................................................................................................................................................................................2
MAIN BODY.....................................................................................................................................................................................................2
Ratio analysis of given three companies:.............................................................................................................................................2
Non financial ratios:............................................................................................................................................................................10
QUESTION 2:....................................................................................................................................................................................12
CONCLUSION................................................................................................................................................................................................13
REFERENCES.................................................................................................................................................................................................14
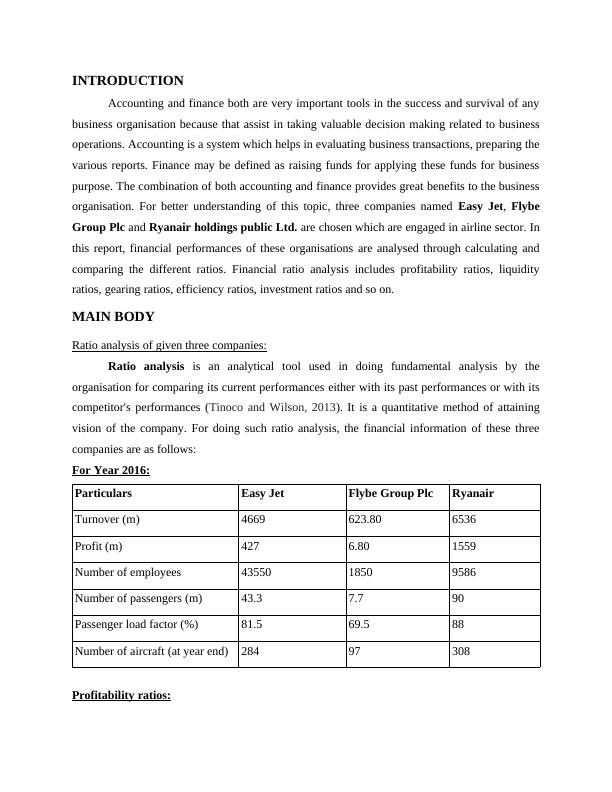
INTRODUCTION
Accounting and finance both are very important tools in the success and survival of any
business organisation because that assist in taking valuable decision making related to business
operations. Accounting is a system which helps in evaluating business transactions, preparing the
various reports. Finance may be defined as raising funds for applying these funds for business
purpose. The combination of both accounting and finance provides great benefits to the business
organisation. For better understanding of this topic, three companies named Easy Jet, Flybe
Group Plc and Ryanair holdings public Ltd. are chosen which are engaged in airline sector. In
this report, financial performances of these organisations are analysed through calculating and
comparing the different ratios. Financial ratio analysis includes profitability ratios, liquidity
ratios, gearing ratios, efficiency ratios, investment ratios and so on.
MAIN BODY
Ratio analysis of given three companies:
Ratio analysis is an analytical tool used in doing fundamental analysis by the
organisation for comparing its current performances either with its past performances or with its
competitor's performances (Tinoco and Wilson, 2013). It is a quantitative method of attaining
vision of the company. For doing such ratio analysis, the financial information of these three
companies are as follows:
For Year 2016:
Particulars Easy Jet Flybe Group Plc Ryanair
Turnover (m) 4669 623.80 6536
Profit (m) 427 6.80 1559
Number of employees 43550 1850 9586
Number of passengers (m) 43.3 7.7 90
Passenger load factor (%) 81.5 69.5 88
Number of aircraft (at year end) 284 97 308
Profitability ratios:
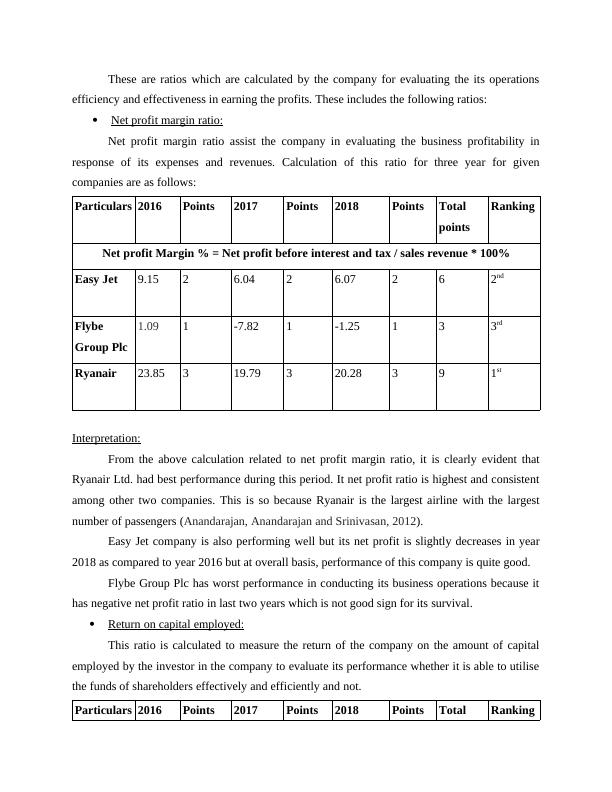
These are ratios which are calculated by the company for evaluating the its operations
efficiency and effectiveness in earning the profits. These includes the following ratios:
Net profit margin ratio:
Net profit margin ratio assist the company in evaluating the business profitability in
response of its expenses and revenues. Calculation of this ratio for three year for given
companies are as follows:
Particulars 2016 Points 2017 Points 2018 Points Total
points
Ranking
Net profit Margin % = Net profit before interest and tax / sales revenue * 100%
Easy Jet 9.15 2 6.04 2 6.07 2 6 2nd
Flybe
Group Plc
1.09 1 -7.82 1 -1.25 1 3 3rd
Ryanair 23.85 3 19.79 3 20.28 3 9 1st
Interpretation:
From the above calculation related to net profit margin ratio, it is clearly evident that
Ryanair Ltd. had best performance during this period. It net profit ratio is highest and consistent
among other two companies. This is so because Ryanair is the largest airline with the largest
number of passengers (Anandarajan, Anandarajan and Srinivasan, 2012).
Easy Jet company is also performing well but its net profit is slightly decreases in year
2018 as compared to year 2016 but at overall basis, performance of this company is quite good.
Flybe Group Plc has worst performance in conducting its business operations because it
has negative net profit ratio in last two years which is not good sign for its survival.
Return on capital employed:
This ratio is calculated to measure the return of the company on the amount of capital
employed by the investor in the company to evaluate its performance whether it is able to utilise
the funds of shareholders effectively and efficiently and not.
Particulars 2016 Points 2017 Points 2018 Points Total Ranking
points
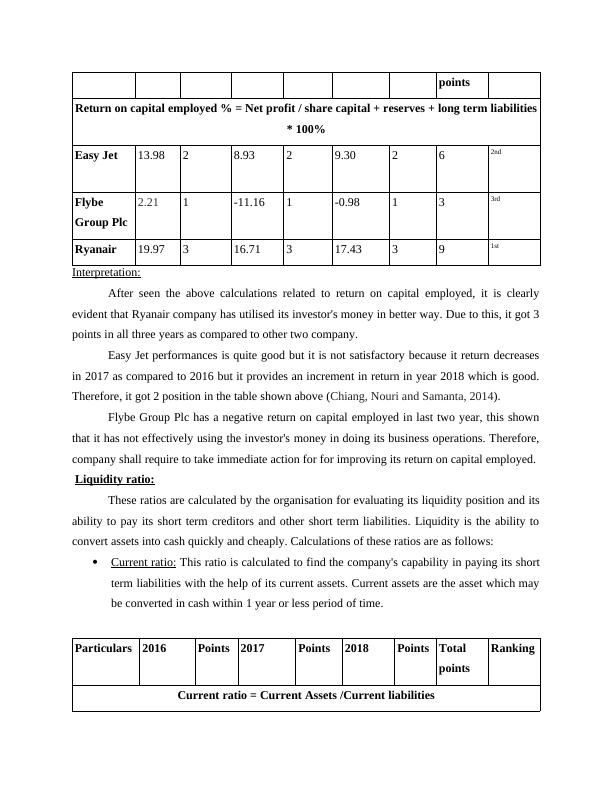
Return on capital employed % = Net profit / share capital + reserves + long term liabilities
* 100%
Easy Jet 13.98 2 8.93 2 9.30 2 6 2nd
Flybe
Group Plc
2.21 1 -11.16 1 -0.98 1 3 3rd
Ryanair 19.97 3 16.71 3 17.43 3 9 1st
Interpretation:
After seen the above calculations related to return on capital employed, it is clearly
evident that Ryanair company has utilised its investor's money in better way. Due to this, it got 3
points in all three years as compared to other two company.
Easy Jet performances is quite good but it is not satisfactory because it return decreases
in 2017 as compared to 2016 but it provides an increment in return in year 2018 which is good.
Therefore, it got 2 position in the table shown above (Chiang, Nouri and Samanta, 2014).
Flybe Group Plc has a negative return on capital employed in last two year, this shown
that it has not effectively using the investor's money in doing its business operations. Therefore,
company shall require to take immediate action for for improving its return on capital employed.
Liquidity ratio:
These ratios are calculated by the organisation for evaluating its liquidity position and its
ability to pay its short term creditors and other short term liabilities. Liquidity is the ability to
convert assets into cash quickly and cheaply. Calculations of these ratios are as follows:
Current ratio: This ratio is calculated to find the company's capability in paying its short
term liabilities with the help of its current assets. Current assets are the asset which may
be converted in cash within 1 year or less period of time.
Particulars 2016 Points 2017 Points 2018 Points Total
points
Ranking
Current ratio = Current Assets /Current liabilities
End of preview
Want to access all the pages? Upload your documents or become a member.
Related Documents
Analysis of Financial Ratios in the Aviation Industrylg...
|22
|3279
|1
Comparative Analysis of Easy Jet Plc and Ryanairlg...
|25
|5096
|190
Accounting and Finance Contentslg...
|13
|3677
|371
Ratio Analysis and Investment Appraisal in Financelg...
|17
|3578
|76
Financial Management: Analyzing the Financial Performance and Position of Companieslg...
|19
|2594
|33
Financial Report - Ryanair, Easy jet and Flybelg...
|26
|4086
|185