Financial Analysis Report: Walmart's Accounting Controllership Review
VerifiedAdded on 2020/05/04
|4
|471
|79
Report
AI Summary
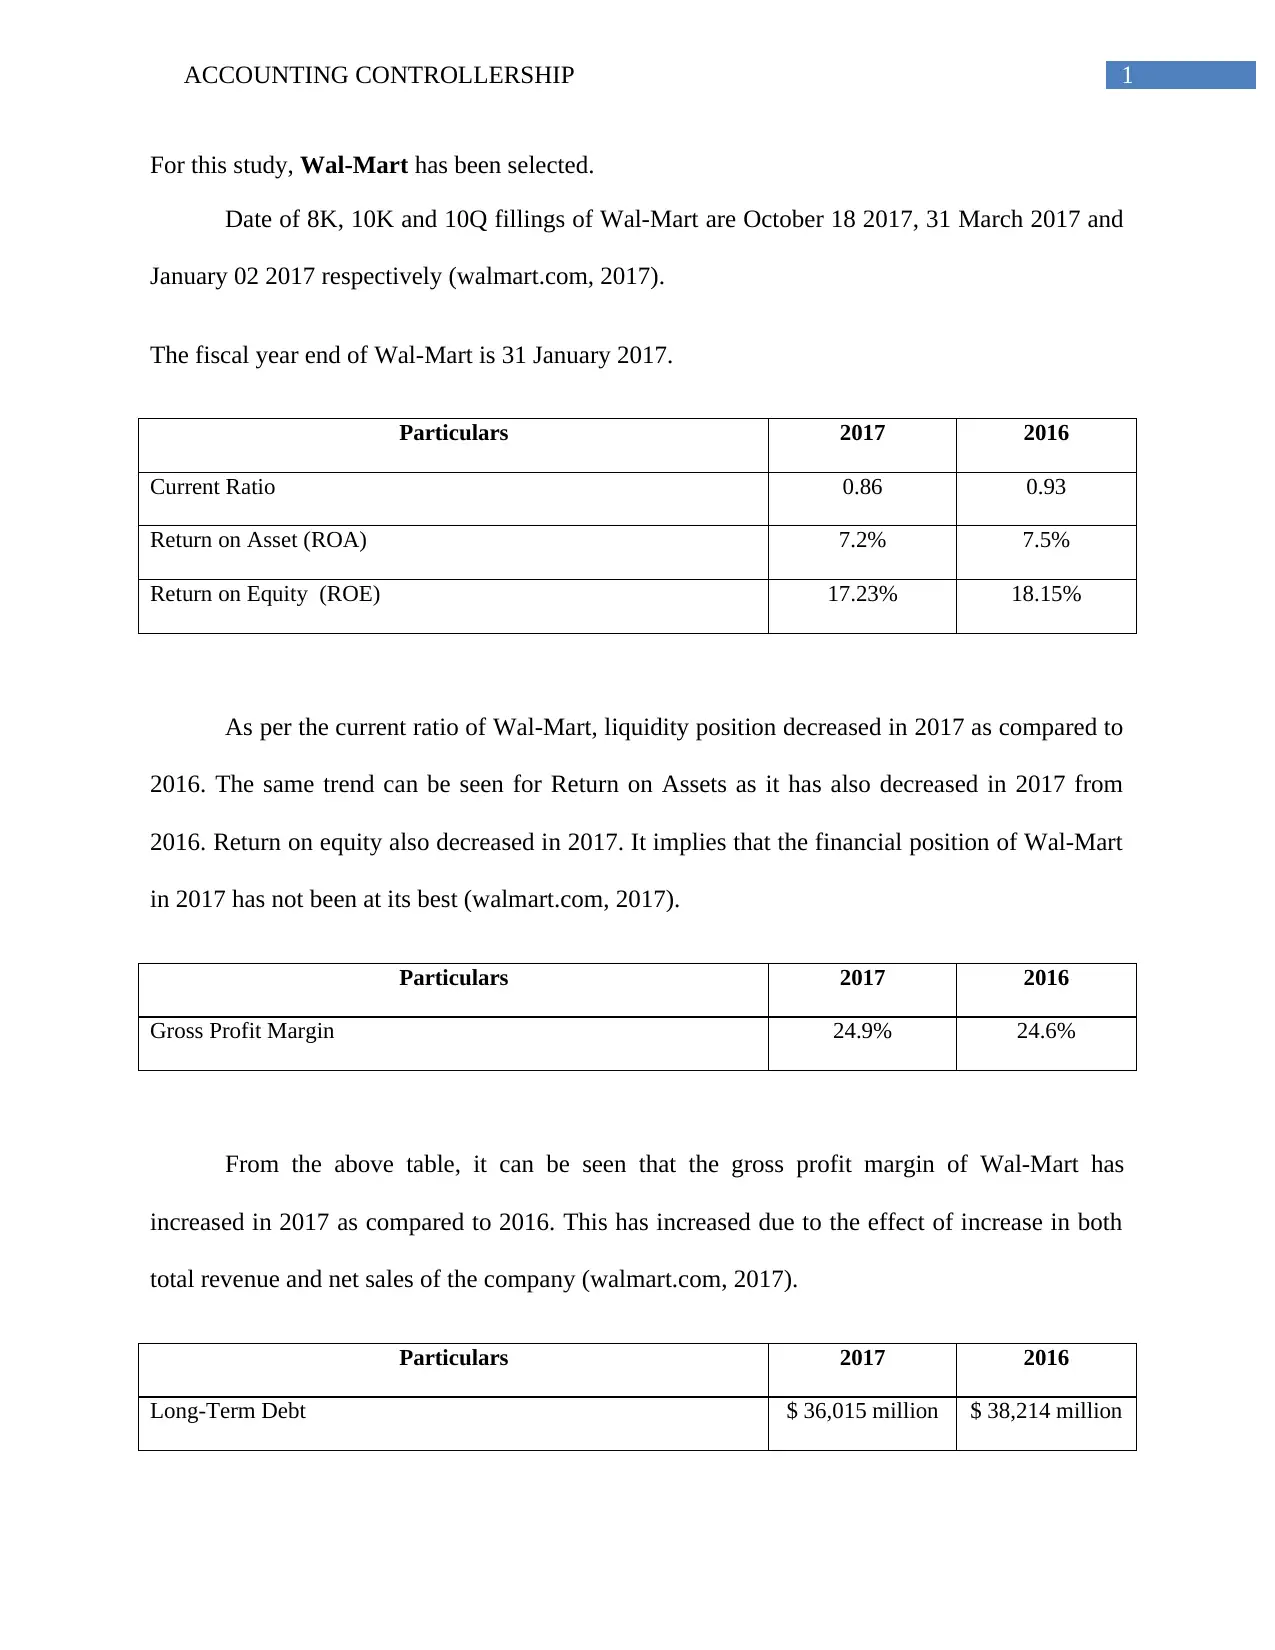
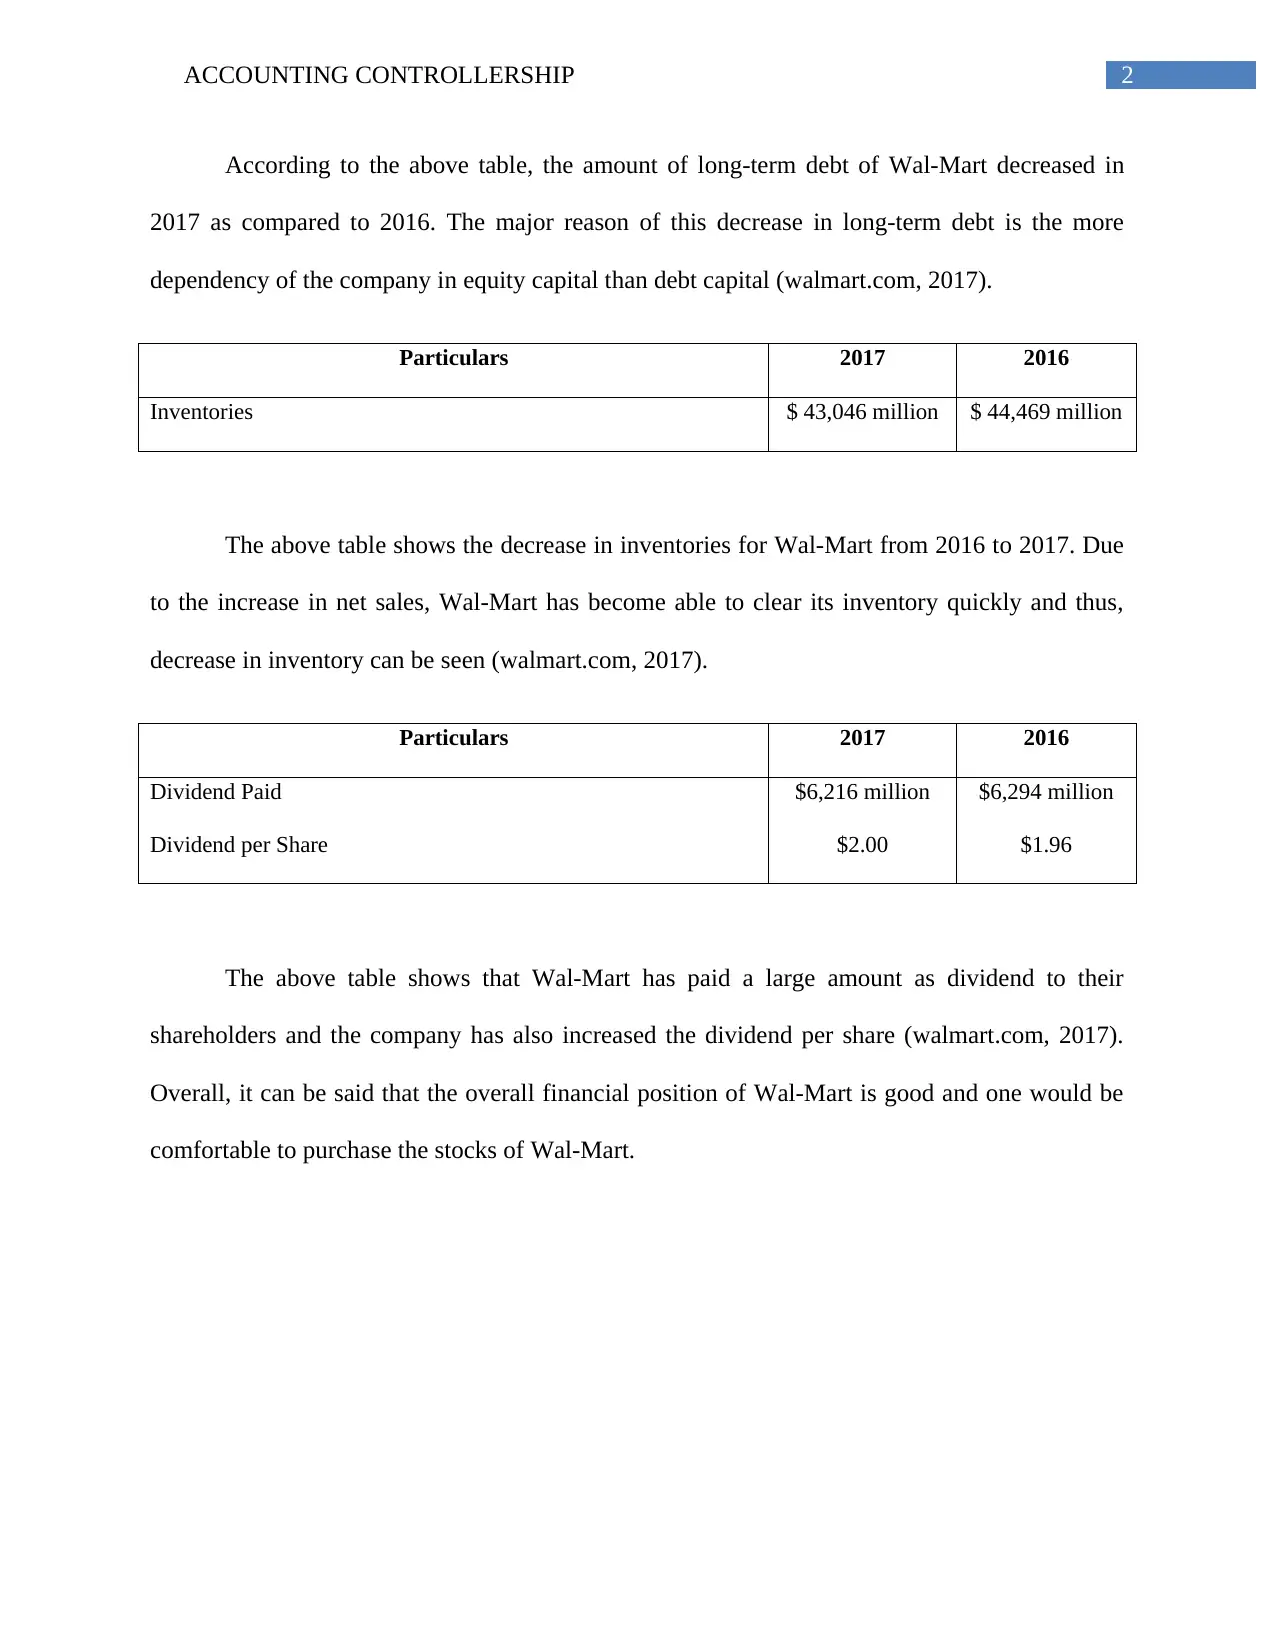
This report provides a financial analysis of Walmart, examining key financial metrics from 2016 to 2017. The analysis includes the evaluation of the current ratio, return on assets (ROA), return on equity (ROE), gross profit margin, long-term debt, inventories, and dividends paid. The report highlights trends such as a decrease in liquidity, ROA, and ROE in 2017, while the gross profit margin increased. It also notes a decrease in long-term debt and inventories, alongside an increase in dividend payments. The report concludes that Walmart's overall financial position is sound, making it a potentially attractive investment. The analysis is based on data from Walmart's 8K, 10K, and 10Q filings and annual reports.
1 out of 4
Related Documents


Your All-in-One AI-Powered Toolkit for Academic Success.
+13062052269
info@desklib.com
Available 24*7 on WhatsApp / Email
![[object Object]](/_next/static/media/star-bottom.7253800d.svg)
Copyright © 2020–2026 A2Z Services. All Rights Reserved. Developed and managed by ZUCOL.