Financial Decision Making: Analysis of Genting Singapore Plc
34 Pages5604 Words411 Views
Added on 2023-06-06
About This Document
This article provides a financial analysis of Genting Singapore Plc, including horizontal and vertical analysis, profitability ratios, and economic conditions of the hospitality and entertainment industry in Singapore. The article also includes non-financial parameters for Genting Singapore Plc and a review of its corporate governance compliance.
Financial Decision Making: Analysis of Genting Singapore Plc
Added on 2023-06-06
ShareRelated Documents
Financial Decision Making 1
Financial Decision Making
Author
Course Title
Professor
City
Date
Financial Decision Making
Author
Course Title
Professor
City
Date
Financial Decision Making 2
Table of Contents
SECTION A...............................................................................................................................3
Introduction................................................................................................................................3
Horizontal Analysis and Vertical Analysis................................................................................3
Economic Condition of the Hospitality and Entertainment Industry in Singapore...................7
PROFITABILITY......................................................................................................................8
Gross profit ratio....................................................................................................................8
Figure 1: Graph of gross profit ratio Net Margin...................................................................9
Return on assets....................................................................................................................10
Return on Equity..................................................................................................................11
DIVIDEND RATIOS...............................................................................................................12
Dividend Yield ratio.............................................................................................................12
Figure 5: Dividend Yield Dividend Payout ratio.................................................................13
Figure 5: dividend payout Price earnings ratio....................................................................14
Figure 7: P/E ratio Earnings per share.................................................................................15
STABILITY AND LIQUIDITY RATIOS...............................................................................16
Debt to Equity ratio..............................................................................................................16
Figure 9: Debt/equity ratio Interest coverage ratio..............................................................17
Current ratio.........................................................................................................................18
Figure 11: Current ratio Quick ratio.....................................................................................19
EFFICIENCY Ratios...............................................................................................................20
Asset Turnover ratio.............................................................................................................20
Inventory turnover ratio.......................................................................................................21
Debtor’s turnover ratio.........................................................................................................22
Cash Cycle...........................................................................................................................23
Comparative of Genting Singapore with Industry Average.....................................................24
Returns on Investment..........................................................................................................24
Return on Assets..................................................................................................................24
Return on Equity..................................................................................................................25
Risk......................................................................................................................................25
Asset Value per Share as well as Genting Singapore Ltd Market Share Price Compared to
STI............................................................................................................................................26
Non-Financial Parameters for Genting Singapore plc.............................................................26
Section B..................................................................................................................................27
Genting Singapore Ltd Corporate Governance Compliance...............................................27
Impact of Proposed Policies on Company’s Brand and Reputation....................................28
Financial Decision Making 3
Review of corporate governance..........................................................................................28
Directors and their role.....................................................................................................28
Non-Executive Directors and Their Role.........................................................................28
Conclusion................................................................................................................................29
REFERENCES.........................................................................................................................31
Financial Decision Making 4
Financial Decision Making
SECTION A
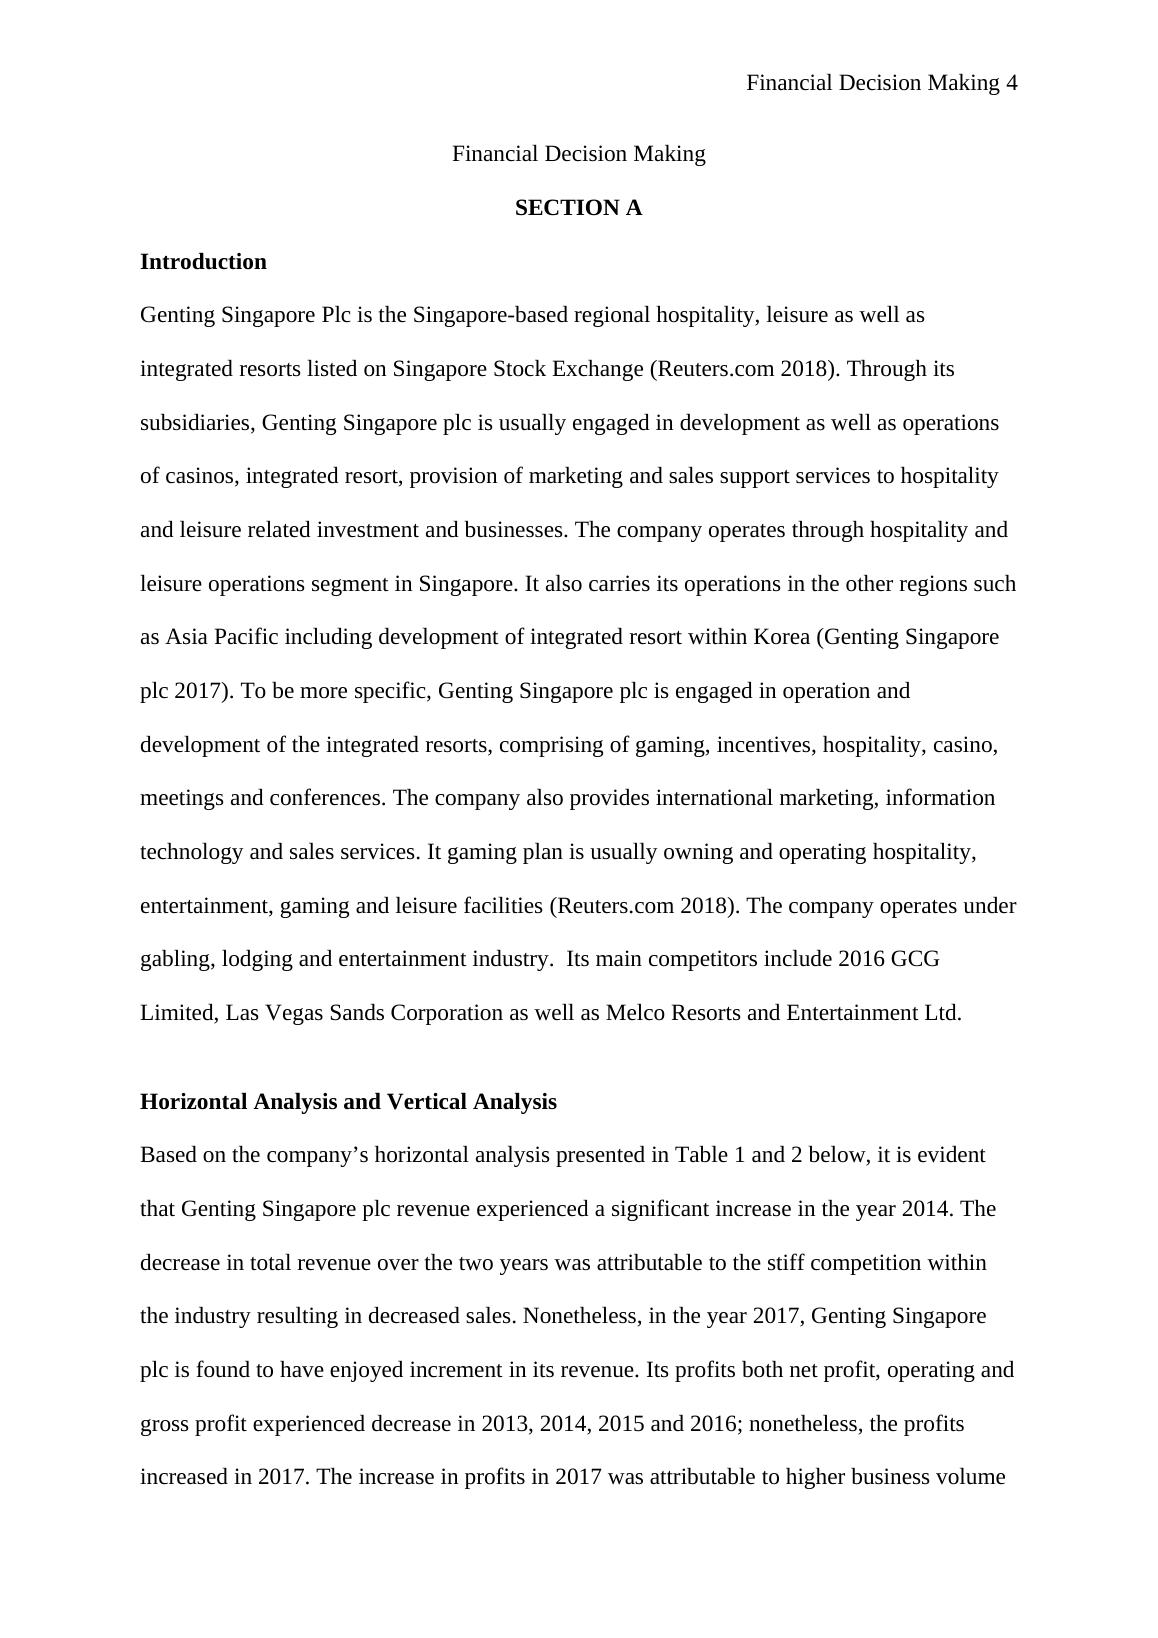
Introduction
Genting Singapore Plc is the Singapore-based regional hospitality, leisure as well as
integrated resorts listed on Singapore Stock Exchange (Reuters.com 2018). Through its
subsidiaries, Genting Singapore plc is usually engaged in development as well as operations
of casinos, integrated resort, provision of marketing and sales support services to hospitality
and leisure related investment and businesses. The company operates through hospitality and
leisure operations segment in Singapore. It also carries its operations in the other regions such
as Asia Pacific including development of integrated resort within Korea (Genting Singapore
plc 2017). To be more specific, Genting Singapore plc is engaged in operation and
development of the integrated resorts, comprising of gaming, incentives, hospitality, casino,
meetings and conferences. The company also provides international marketing, information
technology and sales services. It gaming plan is usually owning and operating hospitality,
entertainment, gaming and leisure facilities (Reuters.com 2018). The company operates under
gabling, lodging and entertainment industry. Its main competitors include 2016 GCG
Limited, Las Vegas Sands Corporation as well as Melco Resorts and Entertainment Ltd.
Horizontal Analysis and Vertical Analysis
Based on the company’s horizontal analysis presented in Table 1 and 2 below, it is evident
that Genting Singapore plc revenue experienced a significant increase in the year 2014. The
decrease in total revenue over the two years was attributable to the stiff competition within
the industry resulting in decreased sales. Nonetheless, in the year 2017, Genting Singapore
plc is found to have enjoyed increment in its revenue. Its profits both net profit, operating and
gross profit experienced decrease in 2013, 2014, 2015 and 2016; nonetheless, the profits
increased in 2017. The increase in profits in 2017 was attributable to higher business volume
Financial Decision Making
SECTION A
Introduction
Genting Singapore Plc is the Singapore-based regional hospitality, leisure as well as
integrated resorts listed on Singapore Stock Exchange (Reuters.com 2018). Through its
subsidiaries, Genting Singapore plc is usually engaged in development as well as operations
of casinos, integrated resort, provision of marketing and sales support services to hospitality
and leisure related investment and businesses. The company operates through hospitality and
leisure operations segment in Singapore. It also carries its operations in the other regions such
as Asia Pacific including development of integrated resort within Korea (Genting Singapore
plc 2017). To be more specific, Genting Singapore plc is engaged in operation and
development of the integrated resorts, comprising of gaming, incentives, hospitality, casino,
meetings and conferences. The company also provides international marketing, information
technology and sales services. It gaming plan is usually owning and operating hospitality,
entertainment, gaming and leisure facilities (Reuters.com 2018). The company operates under
gabling, lodging and entertainment industry. Its main competitors include 2016 GCG
Limited, Las Vegas Sands Corporation as well as Melco Resorts and Entertainment Ltd.
Horizontal Analysis and Vertical Analysis
Based on the company’s horizontal analysis presented in Table 1 and 2 below, it is evident
that Genting Singapore plc revenue experienced a significant increase in the year 2014. The
decrease in total revenue over the two years was attributable to the stiff competition within
the industry resulting in decreased sales. Nonetheless, in the year 2017, Genting Singapore
plc is found to have enjoyed increment in its revenue. Its profits both net profit, operating and
gross profit experienced decrease in 2013, 2014, 2015 and 2016; nonetheless, the profits
increased in 2017. The increase in profits in 2017 was attributable to higher business volume
Financial Decision Making 5
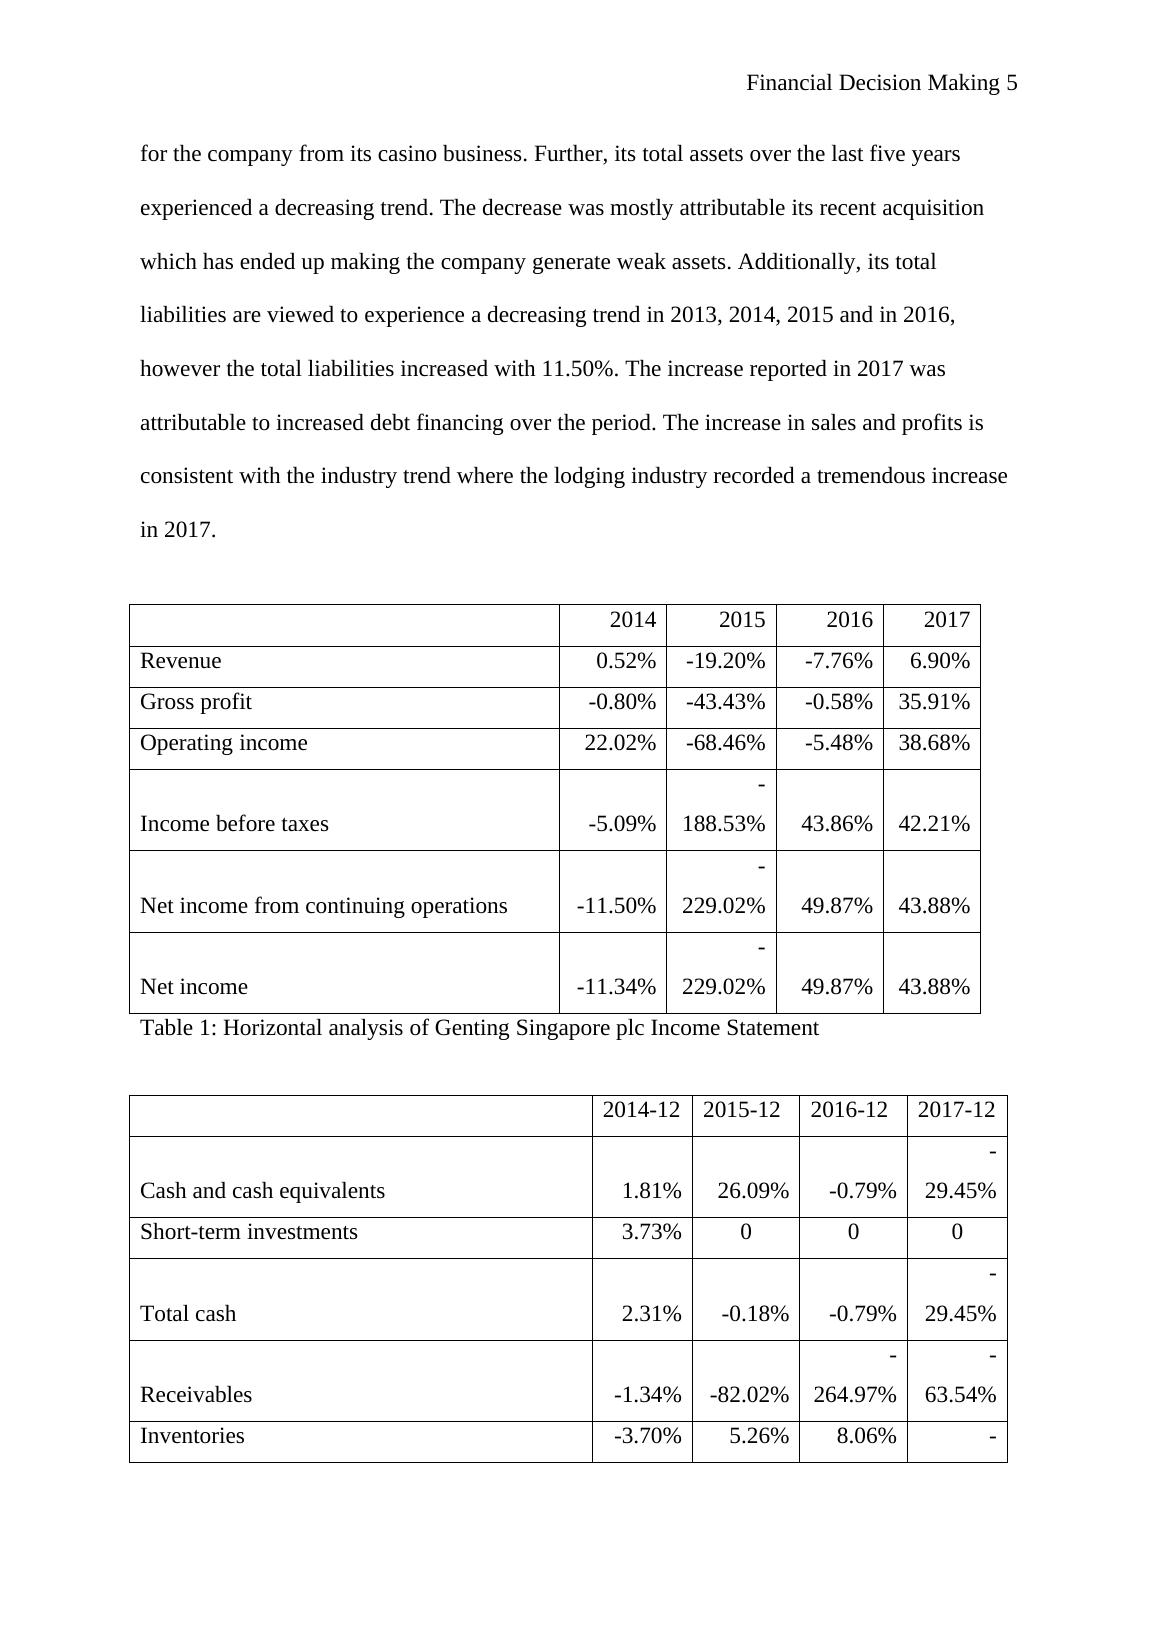
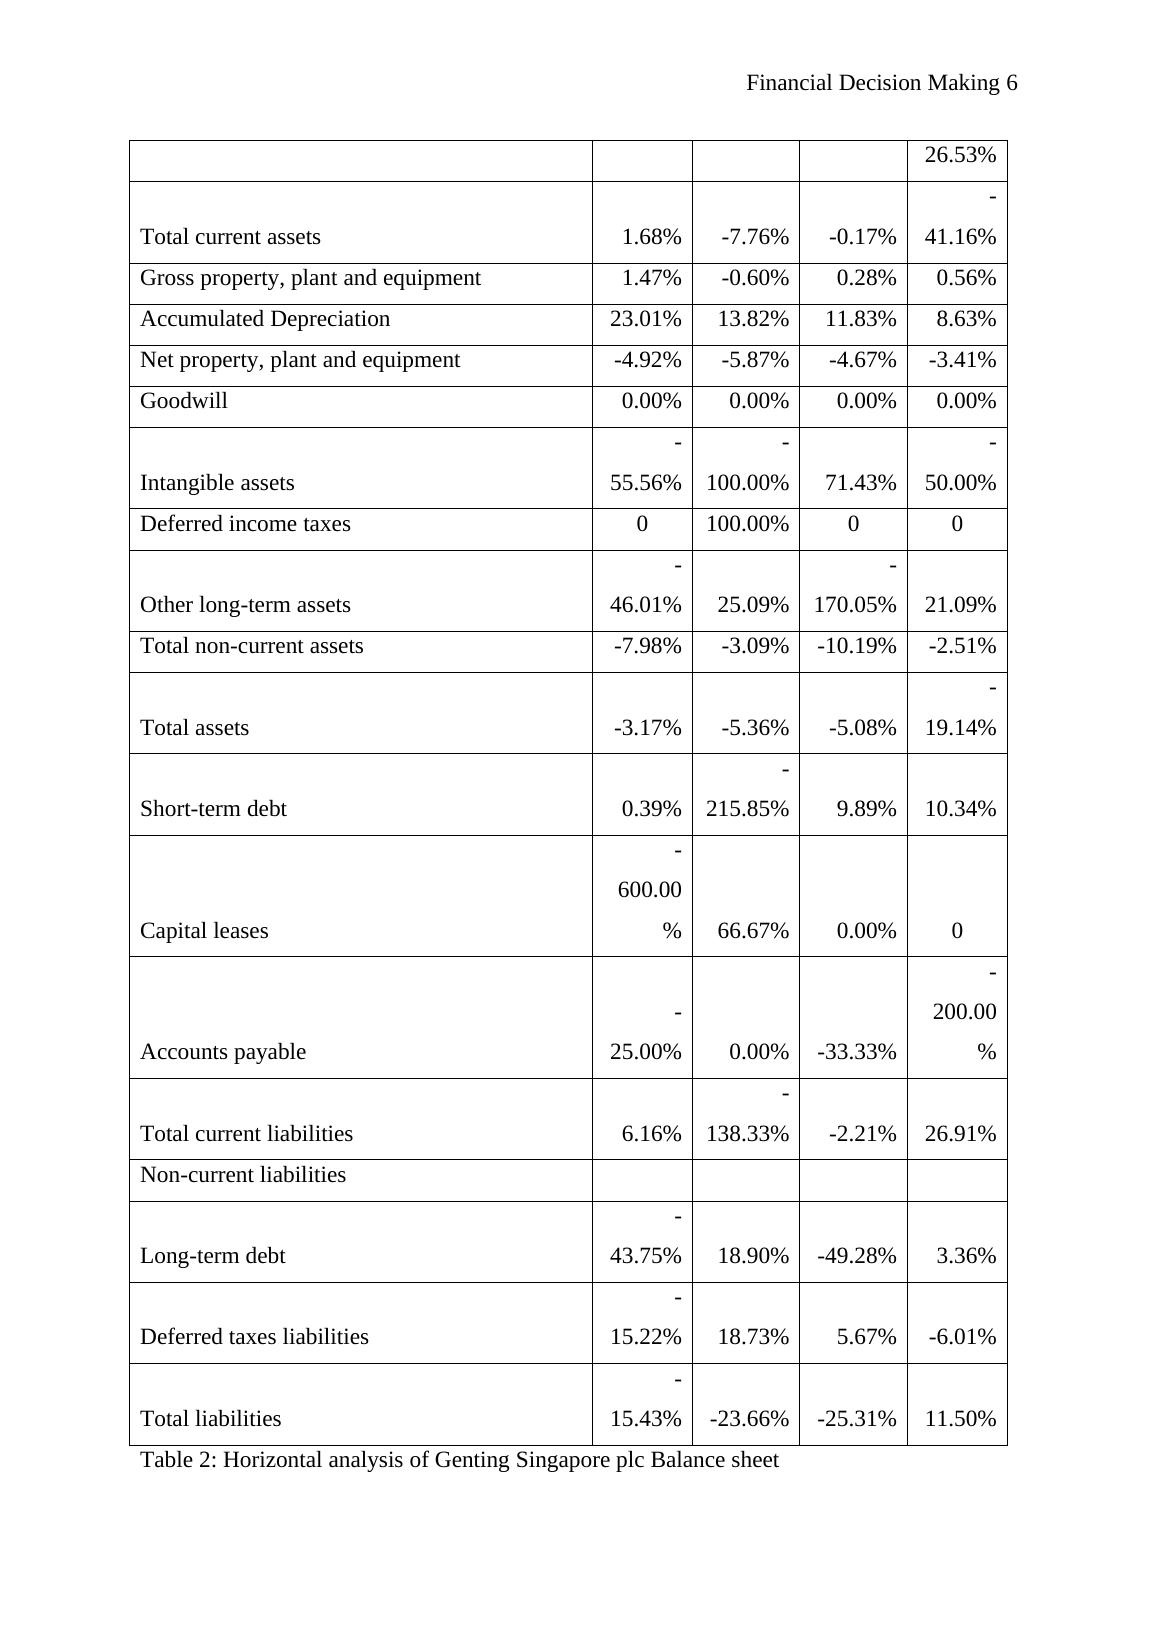
for the company from its casino business. Further, its total assets over the last five years
experienced a decreasing trend. The decrease was mostly attributable its recent acquisition
which has ended up making the company generate weak assets. Additionally, its total
liabilities are viewed to experience a decreasing trend in 2013, 2014, 2015 and in 2016,
however the total liabilities increased with 11.50%. The increase reported in 2017 was
attributable to increased debt financing over the period. The increase in sales and profits is
consistent with the industry trend where the lodging industry recorded a tremendous increase
in 2017.
2014 2015 2016 2017
Revenue 0.52% -19.20% -7.76% 6.90%
Gross profit -0.80% -43.43% -0.58% 35.91%
Operating income 22.02% -68.46% -5.48% 38.68%
Income before taxes -5.09%
-
188.53% 43.86% 42.21%
Net income from continuing operations -11.50%
-
229.02% 49.87% 43.88%
Net income -11.34%
-
229.02% 49.87% 43.88%
Table 1: Horizontal analysis of Genting Singapore plc Income Statement
2014-12 2015-12 2016-12 2017-12
Cash and cash equivalents 1.81% 26.09% -0.79%
-
29.45%
Short-term investments 3.73% 0 0 0
Total cash 2.31% -0.18% -0.79%
-
29.45%
Receivables -1.34% -82.02%
-
264.97%
-
63.54%
Inventories -3.70% 5.26% 8.06% -
Financial Decision Making 6
26.53%
Total current assets 1.68% -7.76% -0.17%
-
41.16%
Gross property, plant and equipment 1.47% -0.60% 0.28% 0.56%
Accumulated Depreciation 23.01% 13.82% 11.83% 8.63%
Net property, plant and equipment -4.92% -5.87% -4.67% -3.41%
Goodwill 0.00% 0.00% 0.00% 0.00%
Intangible assets
-
55.56%
-
100.00% 71.43%
-
50.00%
Deferred income taxes 0 100.00% 0 0
Other long-term assets
-
46.01% 25.09%
-
170.05% 21.09%
Total non-current assets -7.98% -3.09% -10.19% -2.51%
Total assets -3.17% -5.36% -5.08%
-
19.14%
Short-term debt 0.39%
-
215.85% 9.89% 10.34%
Capital leases
-
600.00
% 66.67% 0.00% 0
Accounts payable
-
25.00% 0.00% -33.33%
-
200.00
%
Total current liabilities 6.16%
-
138.33% -2.21% 26.91%
Non-current liabilities
Long-term debt
-
43.75% 18.90% -49.28% 3.36%
Deferred taxes liabilities
-
15.22% 18.73% 5.67% -6.01%
Total liabilities
-
15.43% -23.66% -25.31% 11.50%
Table 2: Horizontal analysis of Genting Singapore plc Balance sheet
Financial Decision Making 7
2013-12 2014-12 2015-12 2016-12 2017-12
Cash and cash equivalents 27.77% 29.17% 41.59% 43.36% 39.91%
Short-term investments 9.68% 10.37% 0.00% 0.00% 0.00%
Total cash 37.44% 39.54% 41.59% 43.36% 39.91%
Receivables 8.08% 8.23% 4.76% 1.37% 1.00%
Inventories 0.43% 0.43% 0.47% 0.54% 0.51%
Total current assets 47.41% 49.76% 48.65% 51.03% 43.07%
Gross property, plant and
equipment 56.75% 59.42% 62.23% 65.58% 78.57%
Net property, plant and equipment 46.62% 45.84% 45.62% 45.80% 52.76%
Goodwill 0.63% 0.65% 0.69% 0.73% 0.86%
Intangible assets 0.43% 0.28% 0.15% 0.55% 0.44%
Deferred income taxes 0.00% 0.00% 0.02% 0.00% 0.00%
Total assets
100.00
% 100.00%
100.00
% 100.00%
100.00
%
Current liabilities 0.00% 0.00% 0.00% 0.00%
Short-term debt 3.95% 4.09% 1.36% 1.59% 2.11%
Capital leases 0.05% 0.01% 0.02% 0.03% 0.00%
Accounts payable 0.04% 0.03% 0.03% 0.03% 0.01%
Taxes payable 1.19% 1.43% 0.57% 0.82% 2.08%
Other current liabilities 5.85% 6.61% 3.39% 3.06% 4.81%
Total current liabilities 11.07% 12.17% 5.38% 5.53% 9.01%
Long-term debt 13.02% 9.34% 12.14% 8.54% 10.53%
Deferred taxes liabilities 2.03% 1.82% 2.35% 2.62% 2.95%
Deferred revenues 0.08% 0.06% 0.05% 0.03% 0.02%
Other long-term liabilities 0.02% 0.03% 0.01% 0.01% 0.01%
Total non-current liabilities 15.14% 11.26% 14.58% 11.21% 13.52%
Total liabilities 26.21% 23.43% 19.96% 16.74% 22.54%
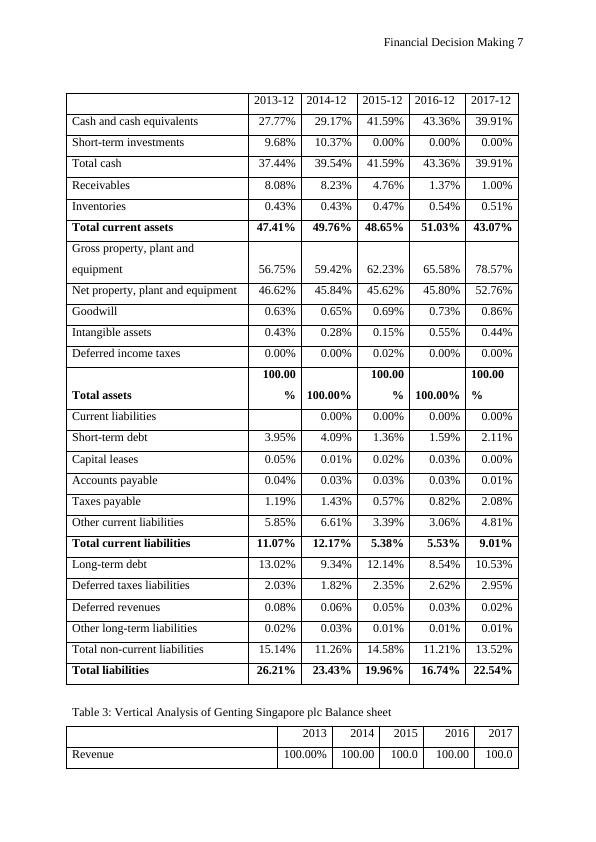
Table 3: Vertical Analysis of Genting Singapore plc Balance sheet
2013 2014 2015 2016 2017
Revenue 100.00% 100.00 100.0 100.00 100.0
2013-12 2014-12 2015-12 2016-12 2017-12
Cash and cash equivalents 27.77% 29.17% 41.59% 43.36% 39.91%
Short-term investments 9.68% 10.37% 0.00% 0.00% 0.00%
Total cash 37.44% 39.54% 41.59% 43.36% 39.91%
Receivables 8.08% 8.23% 4.76% 1.37% 1.00%
Inventories 0.43% 0.43% 0.47% 0.54% 0.51%
Total current assets 47.41% 49.76% 48.65% 51.03% 43.07%
Gross property, plant and
equipment 56.75% 59.42% 62.23% 65.58% 78.57%
Net property, plant and equipment 46.62% 45.84% 45.62% 45.80% 52.76%
Goodwill 0.63% 0.65% 0.69% 0.73% 0.86%
Intangible assets 0.43% 0.28% 0.15% 0.55% 0.44%
Deferred income taxes 0.00% 0.00% 0.02% 0.00% 0.00%
Total assets
100.00
% 100.00%
100.00
% 100.00%
100.00
%
Current liabilities 0.00% 0.00% 0.00% 0.00%
Short-term debt 3.95% 4.09% 1.36% 1.59% 2.11%
Capital leases 0.05% 0.01% 0.02% 0.03% 0.00%
Accounts payable 0.04% 0.03% 0.03% 0.03% 0.01%
Taxes payable 1.19% 1.43% 0.57% 0.82% 2.08%
Other current liabilities 5.85% 6.61% 3.39% 3.06% 4.81%
Total current liabilities 11.07% 12.17% 5.38% 5.53% 9.01%
Long-term debt 13.02% 9.34% 12.14% 8.54% 10.53%
Deferred taxes liabilities 2.03% 1.82% 2.35% 2.62% 2.95%
Deferred revenues 0.08% 0.06% 0.05% 0.03% 0.02%
Other long-term liabilities 0.02% 0.03% 0.01% 0.01% 0.01%
Total non-current liabilities 15.14% 11.26% 14.58% 11.21% 13.52%
Total liabilities 26.21% 23.43% 19.96% 16.74% 22.54%
Table 3: Vertical Analysis of Genting Singapore plc Balance sheet
2013 2014 2015 2016 2017
Revenue 100.00% 100.00 100.0 100.00 100.0
Financial Decision Making 8
% 0% % 0%
Cost of revenue 64.81%
65.30
%
71.14
% 69.08%
55.08
%
Gross profit 35.19%
34.73
%
28.86
% 30.92%
44.92
%
Operating income 26.62%
33.96
%
24.03
% 24.55%
37.28
%
Income before taxes 29.72%
28.13
%
11.62
% 22.31%
35.94
%
Net income from continuing operations 24.87%
22.19
% 8.04% 17.28%
28.67
%
Net income 24.83%
22.19
% 8.04% 17.28%
28.67
%
Net income available to common
shareholders 24.83%
22.19
% 8.04% 17.28%
28.67
%
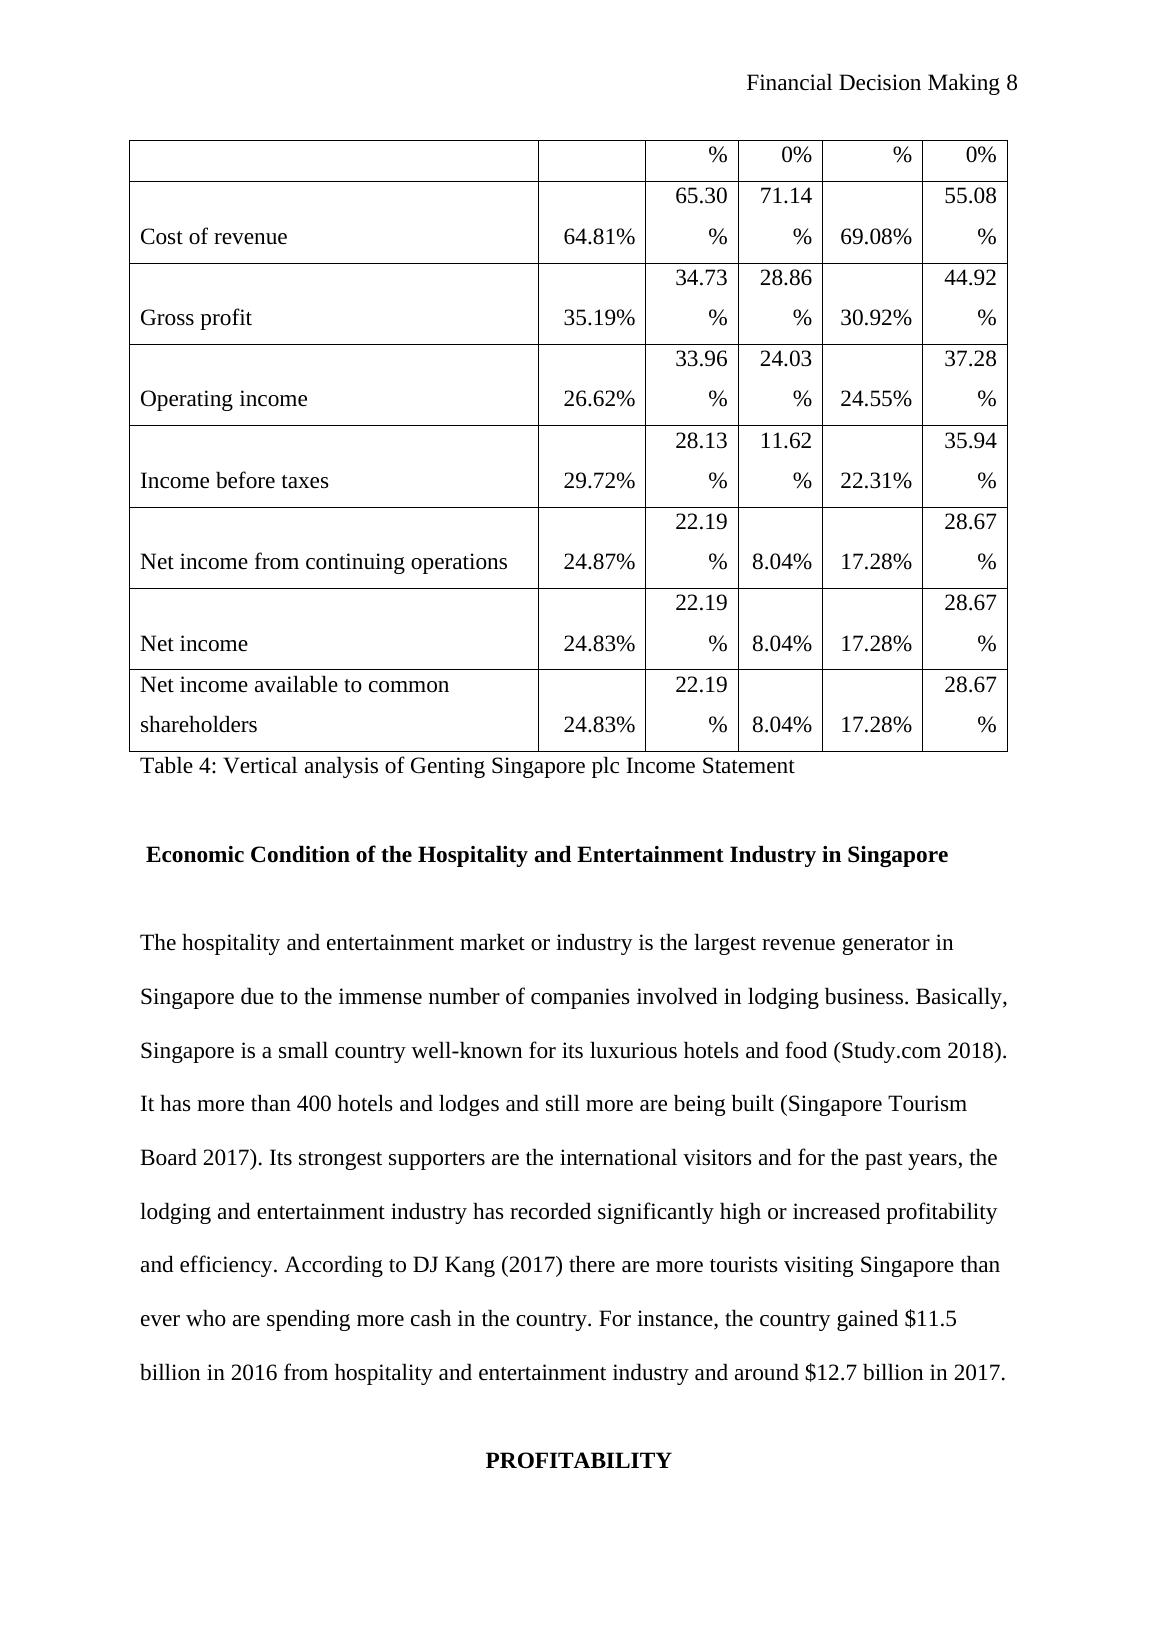
Table 4: Vertical analysis of Genting Singapore plc Income Statement
Economic Condition of the Hospitality and Entertainment Industry in Singapore
The hospitality and entertainment market or industry is the largest revenue generator in
Singapore due to the immense number of companies involved in lodging business. Basically,
Singapore is a small country well-known for its luxurious hotels and food (Study.com 2018).
It has more than 400 hotels and lodges and still more are being built (Singapore Tourism
Board 2017). Its strongest supporters are the international visitors and for the past years, the
lodging and entertainment industry has recorded significantly high or increased profitability
and efficiency. According to DJ Kang (2017) there are more tourists visiting Singapore than
ever who are spending more cash in the country. For instance, the country gained $11.5
billion in 2016 from hospitality and entertainment industry and around $12.7 billion in 2017.
PROFITABILITY
% 0% % 0%
Cost of revenue 64.81%
65.30
%
71.14
% 69.08%
55.08
%
Gross profit 35.19%
34.73
%
28.86
% 30.92%
44.92
%
Operating income 26.62%
33.96
%
24.03
% 24.55%
37.28
%
Income before taxes 29.72%
28.13
%
11.62
% 22.31%
35.94
%
Net income from continuing operations 24.87%
22.19
% 8.04% 17.28%
28.67
%
Net income 24.83%
22.19
% 8.04% 17.28%
28.67
%
Net income available to common
shareholders 24.83%
22.19
% 8.04% 17.28%
28.67
%
Table 4: Vertical analysis of Genting Singapore plc Income Statement
Economic Condition of the Hospitality and Entertainment Industry in Singapore
The hospitality and entertainment market or industry is the largest revenue generator in
Singapore due to the immense number of companies involved in lodging business. Basically,
Singapore is a small country well-known for its luxurious hotels and food (Study.com 2018).
It has more than 400 hotels and lodges and still more are being built (Singapore Tourism
Board 2017). Its strongest supporters are the international visitors and for the past years, the
lodging and entertainment industry has recorded significantly high or increased profitability
and efficiency. According to DJ Kang (2017) there are more tourists visiting Singapore than
ever who are spending more cash in the country. For instance, the country gained $11.5
billion in 2016 from hospitality and entertainment industry and around $12.7 billion in 2017.
PROFITABILITY
End of preview
Want to access all the pages? Upload your documents or become a member.
Related Documents
Business Organization Analysislg...
|83
|13746
|326
(DOC) Complete Strategic Finance Assignmentlg...
|46
|10766
|192
Financial Analysis of Crown Resorts Limited and Comparison with Skycity Entertainment Grouplg...
|13
|2716
|267
Accounting Essentials For Decision Makinglg...
|18
|2875
|14
Ratio Analysis of Tesco Plc for 2018-2019lg...
|15
|3290
|447
Financial and Non-Financial Analysis of JB Hi Filg...
|4
|1137
|375