Financial Analysis Report of Wesfarmers Limited
VerifiedAdded on 2022/10/19
|13
|2404
|372
AI Summary
This report provides a financial analysis of Wesfarmers Limited, an Australian conglomerate company. It includes an overview of the ownership structure, graphical representation of share price analysis, scenario analysis, and recommendations. The report is prepared by experts at Desklib and is useful for students and professionals studying finance and accounting.
Contribute Materials
Your contribution can guide someone’s learning journey. Share your
documents today.
Running head:FINANCIAL ANALYSIS
Financial Analysis
Name of the Student:
Name of the University:
Author’s Note:
Financial Analysis
Name of the Student:
Name of the University:
Author’s Note:
Secure Best Marks with AI Grader
Need help grading? Try our AI Grader for instant feedback on your assignments.
1ACCOUNTING FINANCIAL ANALYSIS REPORT
Table of Contents
Introduction......................................................................................................................................2
Discussion........................................................................................................................................2
Ownership Structure of Company...............................................................................................2
Graphical Representation.............................................................................................................4
Share Price Analysis of Wesfarmers...........................................................................................5
Scenario Analysis........................................................................................................................6
Recommendations............................................................................................................................8
References......................................................................................................................................10
Appendix........................................................................................................................................12
2ACCOUNTING FINANCIAL ANALYSIS REPORT
Introduction
The companies that have been selected for the purpose of analysis is the Wesfarmers
Limited and IDP Education Limited. The company is trading as a Public Limited Company
whereby the company is traded in the Australian Stock Exchange with its trading symbol as
“WES”. Wesfarmers is an Australian based Conglomerate Company that is headquartered in the
Perth, Australian Region with the various set of business operations that can be well observed in
the Retail, Industrial, Chemicals, Fertilizers, Coal Mining and various safety products that is
offered by company (Annual Report, 2019).
Discussion
Ownership Structure of Company
The ownership structure of the company can be well distributed in the form of public and
private limited ownership whereby the general public holds around 75.90% stake in the company
and the others are held by the private owners of the company. The size of retail investors has
been particularly very high in the company and the same can play a collective role in influencing
the policies and actions taken by the company (Alcamo J. H., 2017). The company operates in
the form of a Public Limited Company whereby the company is primarily handled with the help
of the CEO of the company who takes important managerial decision about the company.
Wesfarmers Chairman is Michael Chaney and on the other hand, the Managing Director is Rob
Scott. The management roles and positions held by each of the senior management employee in
the organization is well defined and organized whereby each of the task performed by the
financial operation is handled by the Chief Financial Officer, Operations by the CEO and the
3ACCOUNTING FINANCIAL ANALYSIS REPORT
Managing Director of the company. The major shareholders of the company is the HSBC
Custody Nominees (Australia) Limited that is holding about 23% of the issued share capital. On
the other companies that have significant stake in the organization are as follows:
Blackrock Group (Blackrock Incorporation) having around 5%;
The Vanguard Group Incorporation having around 5%.
Based on the above data it can be well seen that the company shareholding pattern is not a
single family based company rather that it can be classified as a non-family company
(Clarkson-Ledward, 2018). However, it is crucial to note that other key shareholders of the
company having significant shareholding position in the company are as follows:
J P Morgan Nominees Australia Limited holding around 15%
Citicorp Nominees Pty Limited holding around 5.31%
While doing the financial analysis of the company it was also found that any of the
following company does not have significant position or stake in the company and neither in the
form of corporate firm’s governance. The key board of directors, Managing Director and
Chairman that the company has are as follows:
Michael Chaney AO: Chairman
Jennifer Westacott AO: Director
Rob Scott: Managing Director
The Right Honorable Bill English Knzm: Director
Wayne Osborn Director
Paul Bassat Director
Tony Howarth
Secure Best Marks with AI Grader
Need help grading? Try our AI Grader for instant feedback on your assignments.
4ACCOUNTING FINANCIAL ANALYSIS REPORT
Vanessa Wallace Director
Diane Smith-Gander Director
James Graham Am Director
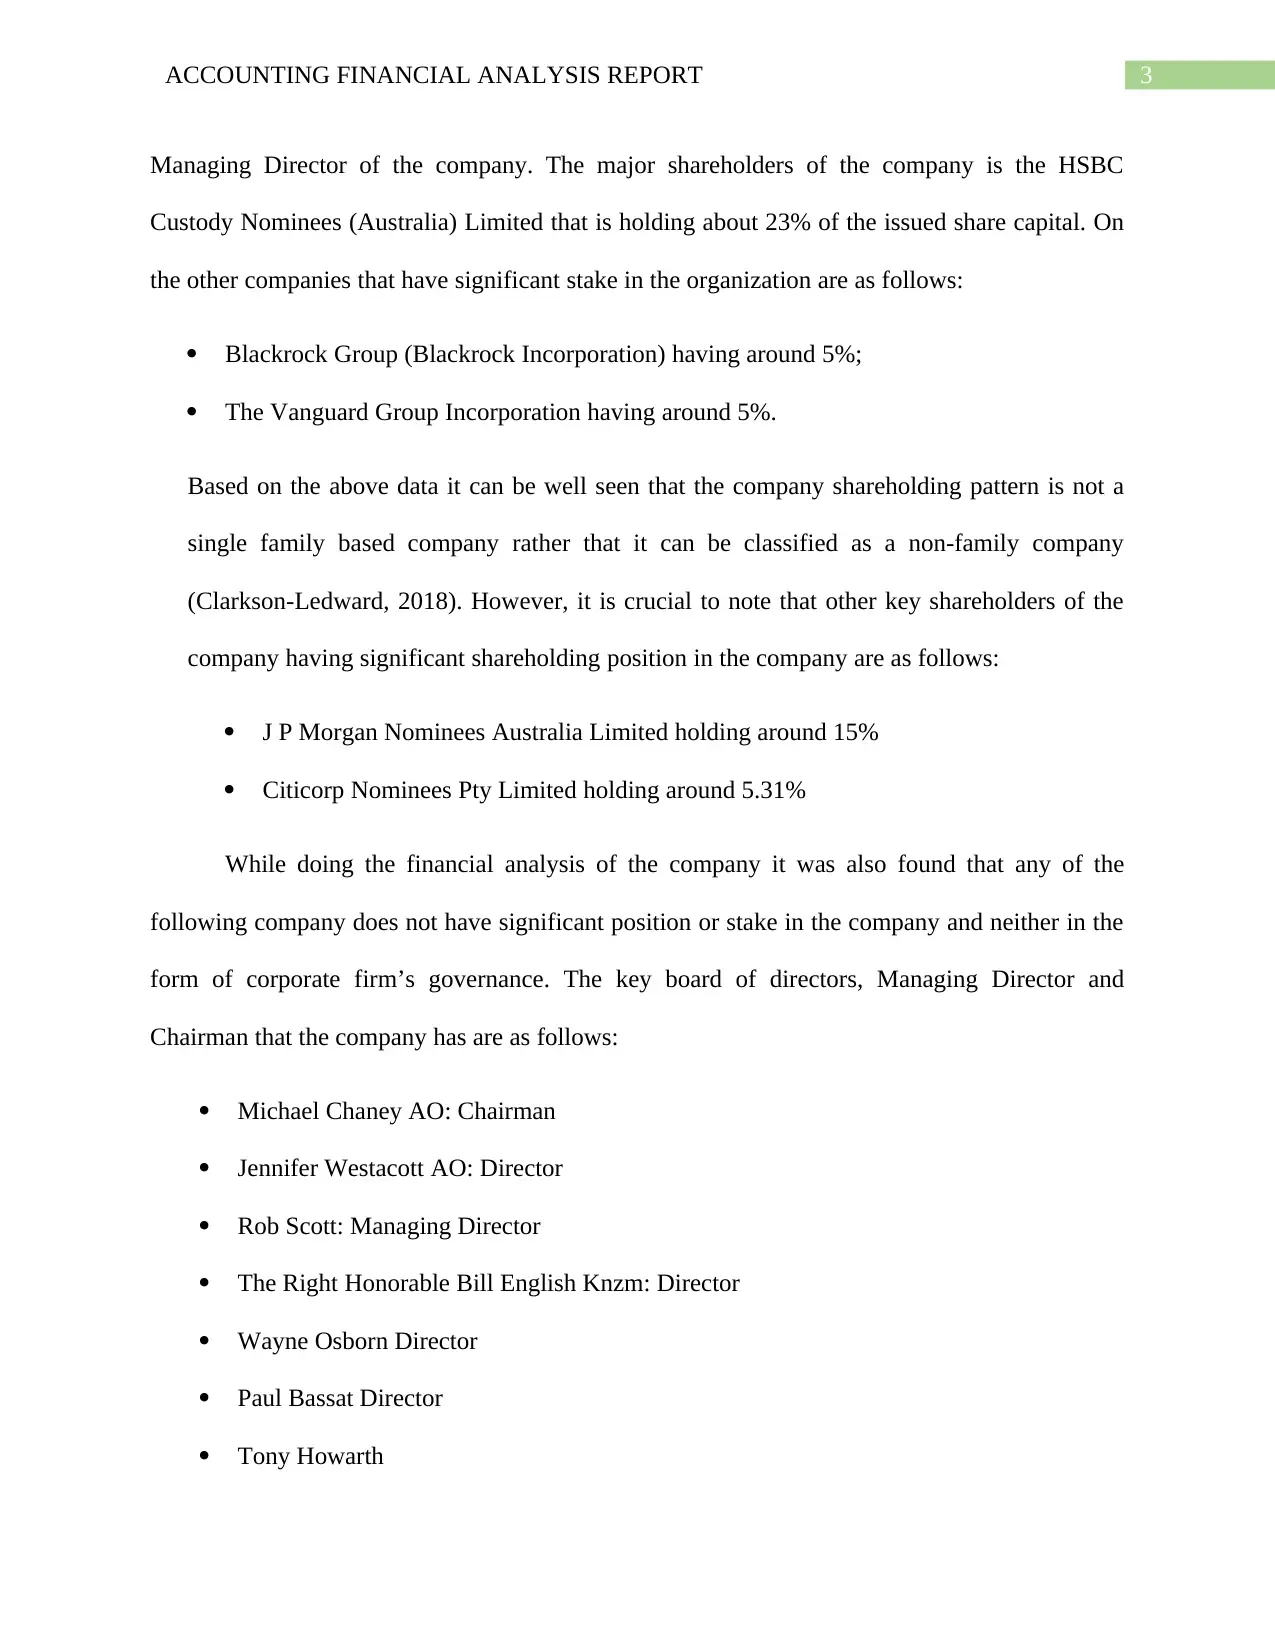
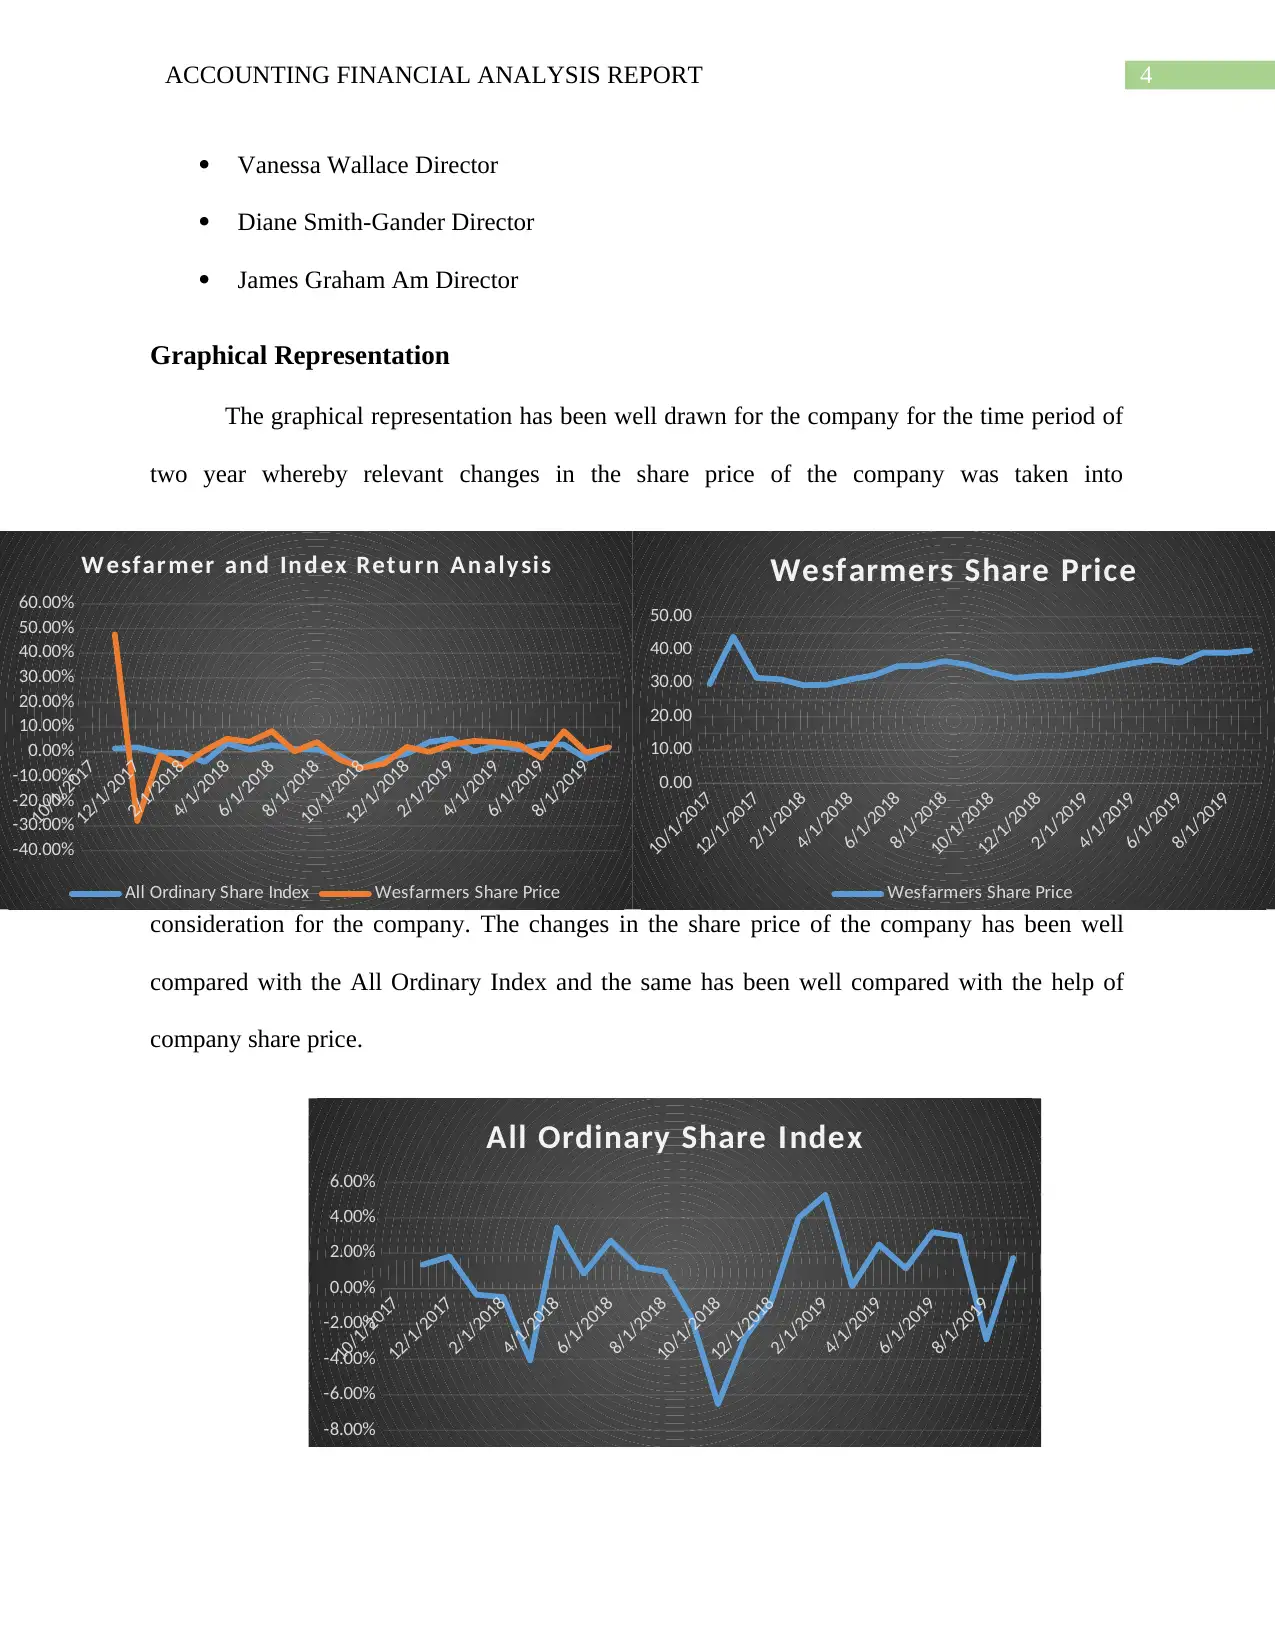
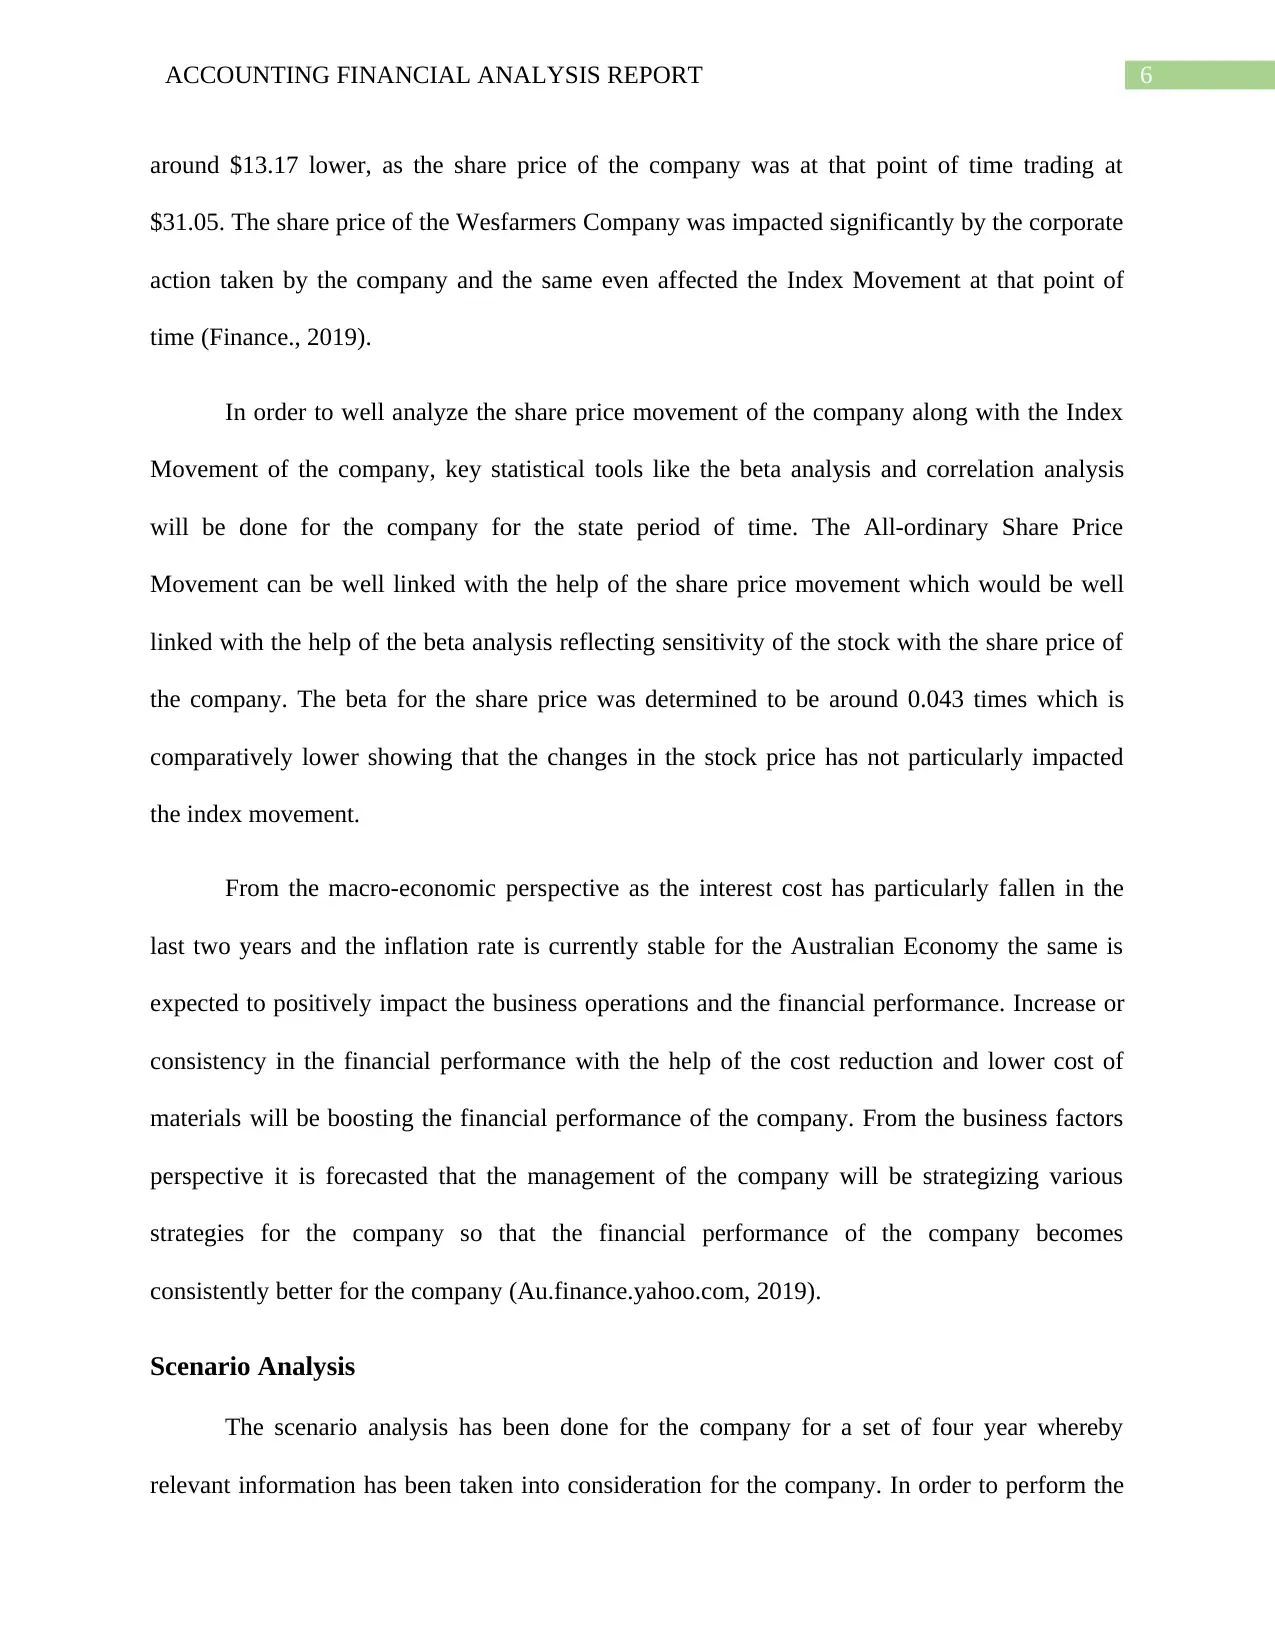
Graphical Representation
The graphical representation has been well drawn for the company for the time period of
two year whereby relevant changes in the share price of the company was taken into
consideration for the company. The changes in the share price of the company has been well
compared with the All Ordinary Index and the same has been well compared with the help of
company share price.
10/1/2017
12/1/2017
2/1/2018
4/1/2018
6/1/2018
8/1/2018
10/1/2018
12/1/2018
2/1/2019
4/1/2019
6/1/2019
8/1/2019
-8.00%
-6.00%
-4.00%
-2.00%
0.00%
2.00%
4.00%
6.00%
All Ordinary Share Index
10/1/2017
12/1/2017
2/1/2018
4/1/2018
6/1/2018
8/1/2018
10/1/2018
12/1/2018
2/1/2019
4/1/2019
6/1/2019
8/1/2019
-40.00%
-30.00%
-20.00%
-10.00%
0.00%
10.00%
20.00%
30.00%
40.00%
50.00%
60.00%
W esfar mer an d In d ex Ret u rn An aly sis
All Ordinary Share Index Wesfarmers Share Price
10/1/2017
12/1/2017
2/1/2018
4/1/2018
6/1/2018
8/1/2018
10/1/2018
12/1/2018
2/1/2019
4/1/2019
6/1/2019
8/1/2019
0.00
10.00
20.00
30.00
40.00
50.00
Wesfarmers Share Price
Wesfarmers Share Price
Vanessa Wallace Director
Diane Smith-Gander Director
James Graham Am Director
Graphical Representation
The graphical representation has been well drawn for the company for the time period of
two year whereby relevant changes in the share price of the company was taken into
consideration for the company. The changes in the share price of the company has been well
compared with the All Ordinary Index and the same has been well compared with the help of
company share price.
10/1/2017
12/1/2017
2/1/2018
4/1/2018
6/1/2018
8/1/2018
10/1/2018
12/1/2018
2/1/2019
4/1/2019
6/1/2019
8/1/2019
-8.00%
-6.00%
-4.00%
-2.00%
0.00%
2.00%
4.00%
6.00%
All Ordinary Share Index
10/1/2017
12/1/2017
2/1/2018
4/1/2018
6/1/2018
8/1/2018
10/1/2018
12/1/2018
2/1/2019
4/1/2019
6/1/2019
8/1/2019
-40.00%
-30.00%
-20.00%
-10.00%
0.00%
10.00%
20.00%
30.00%
40.00%
50.00%
60.00%
W esfar mer an d In d ex Ret u rn An aly sis
All Ordinary Share Index Wesfarmers Share Price
10/1/2017
12/1/2017
2/1/2018
4/1/2018
6/1/2018
8/1/2018
10/1/2018
12/1/2018
2/1/2019
4/1/2019
6/1/2019
8/1/2019
0.00
10.00
20.00
30.00
40.00
50.00
Wesfarmers Share Price
Wesfarmers Share Price
5ACCOUNTING FINANCIAL ANALYSIS REPORT
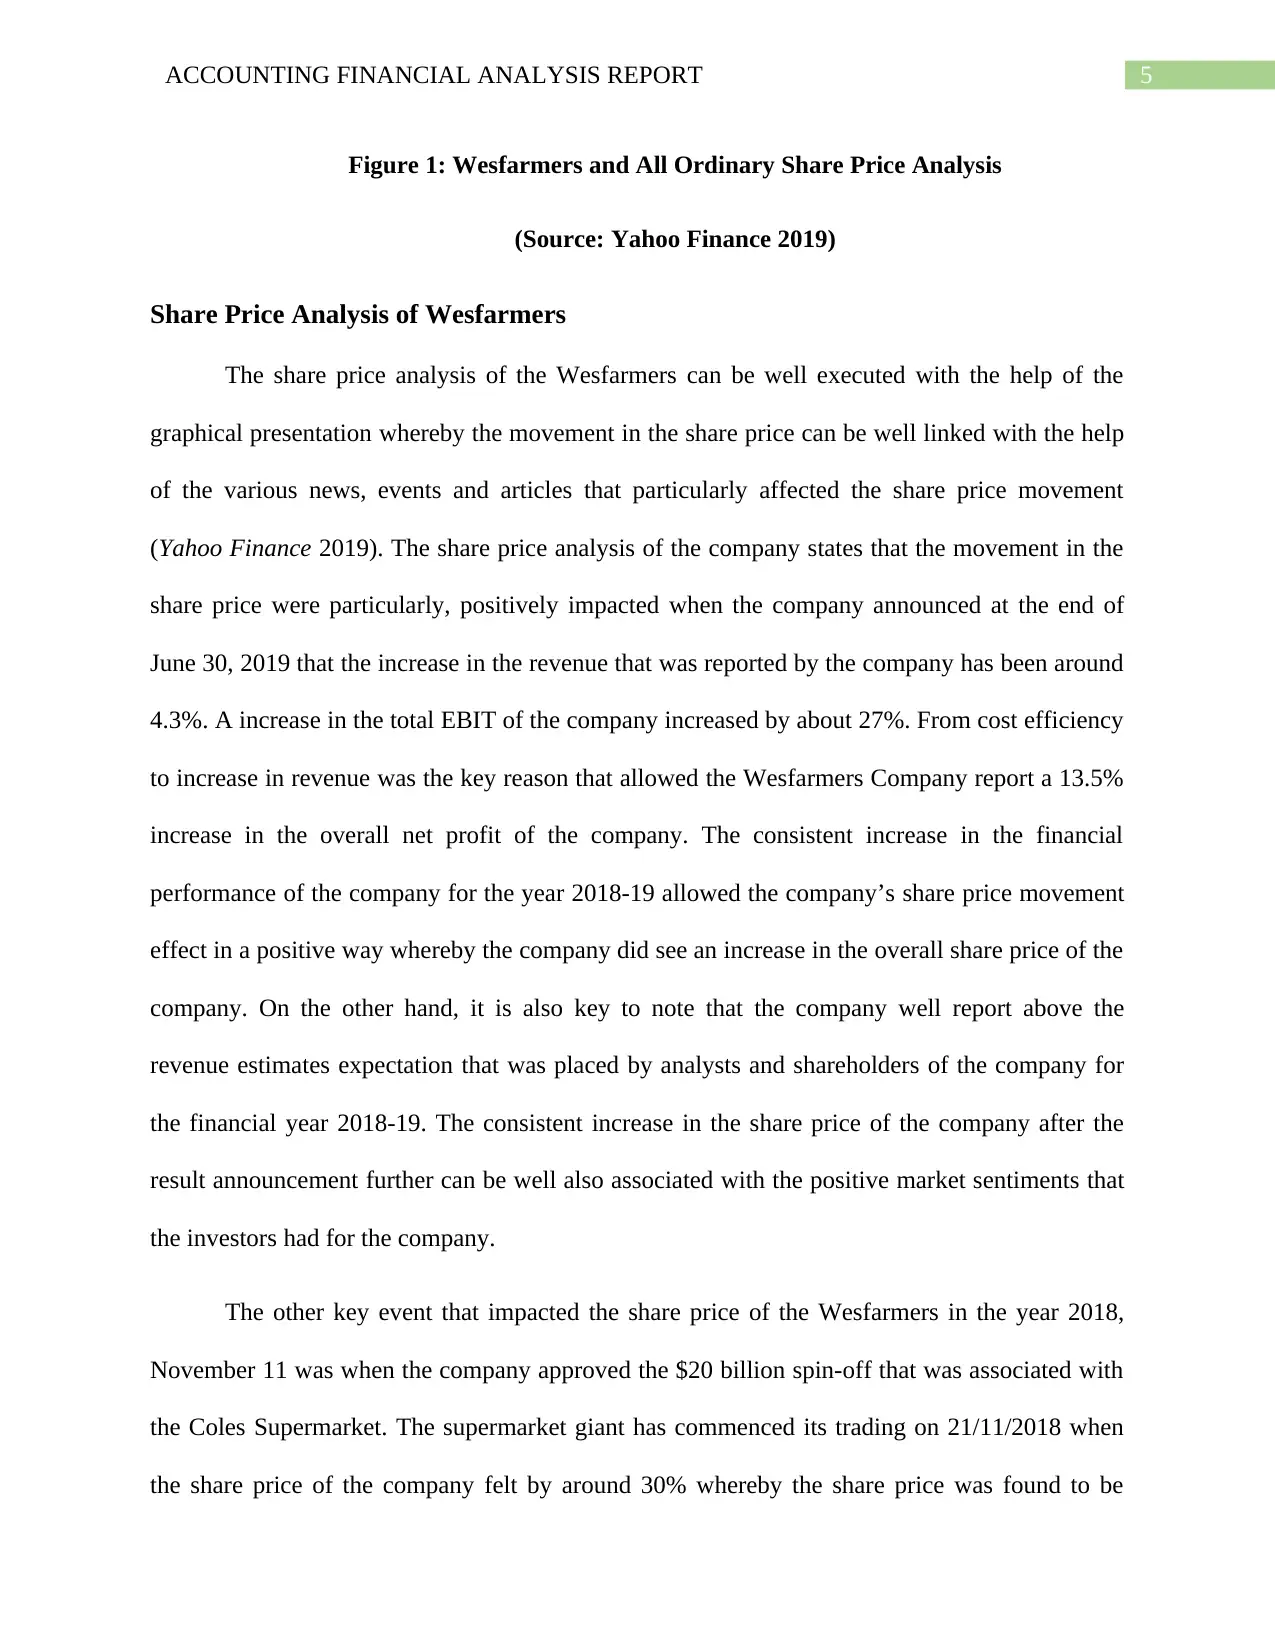
Figure 1: Wesfarmers and All Ordinary Share Price Analysis
(Source: Yahoo Finance 2019)
Share Price Analysis of Wesfarmers
The share price analysis of the Wesfarmers can be well executed with the help of the
graphical presentation whereby the movement in the share price can be well linked with the help
of the various news, events and articles that particularly affected the share price movement
(Yahoo Finance 2019). The share price analysis of the company states that the movement in the
share price were particularly, positively impacted when the company announced at the end of
June 30, 2019 that the increase in the revenue that was reported by the company has been around
4.3%. A increase in the total EBIT of the company increased by about 27%. From cost efficiency
to increase in revenue was the key reason that allowed the Wesfarmers Company report a 13.5%
increase in the overall net profit of the company. The consistent increase in the financial
performance of the company for the year 2018-19 allowed the company’s share price movement
effect in a positive way whereby the company did see an increase in the overall share price of the
company. On the other hand, it is also key to note that the company well report above the
revenue estimates expectation that was placed by analysts and shareholders of the company for
the financial year 2018-19. The consistent increase in the share price of the company after the
result announcement further can be well also associated with the positive market sentiments that
the investors had for the company.
The other key event that impacted the share price of the Wesfarmers in the year 2018,
November 11 was when the company approved the $20 billion spin-off that was associated with
the Coles Supermarket. The supermarket giant has commenced its trading on 21/11/2018 when
the share price of the company felt by around 30% whereby the share price was found to be
6ACCOUNTING FINANCIAL ANALYSIS REPORT
around $13.17 lower, as the share price of the company was at that point of time trading at
$31.05. The share price of the Wesfarmers Company was impacted significantly by the corporate
action taken by the company and the same even affected the Index Movement at that point of
time (Finance., 2019).
In order to well analyze the share price movement of the company along with the Index
Movement of the company, key statistical tools like the beta analysis and correlation analysis
will be done for the company for the state period of time. The All-ordinary Share Price
Movement can be well linked with the help of the share price movement which would be well
linked with the help of the beta analysis reflecting sensitivity of the stock with the share price of
the company. The beta for the share price was determined to be around 0.043 times which is
comparatively lower showing that the changes in the stock price has not particularly impacted
the index movement.
From the macro-economic perspective as the interest cost has particularly fallen in the
last two years and the inflation rate is currently stable for the Australian Economy the same is
expected to positively impact the business operations and the financial performance. Increase or
consistency in the financial performance with the help of the cost reduction and lower cost of
materials will be boosting the financial performance of the company. From the business factors
perspective it is forecasted that the management of the company will be strategizing various
strategies for the company so that the financial performance of the company becomes
consistently better for the company (Au.finance.yahoo.com, 2019).
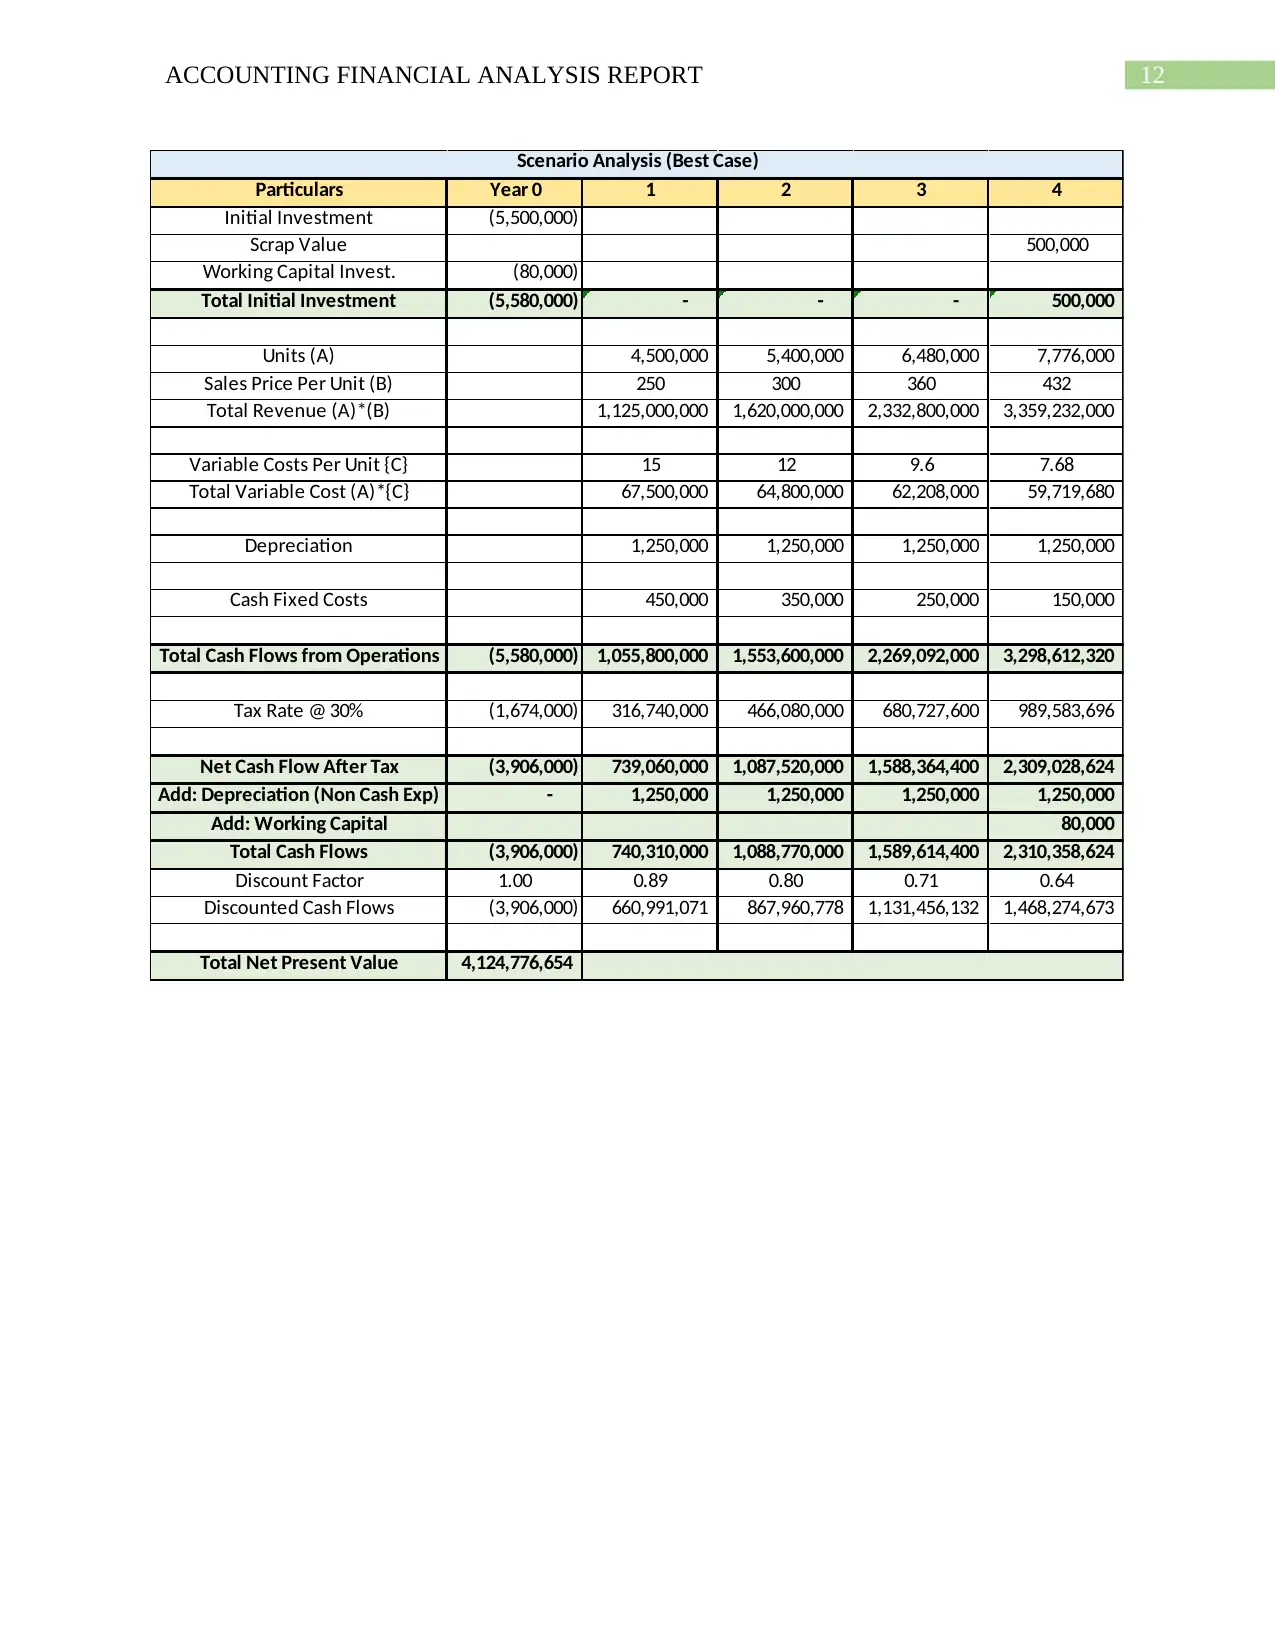
Scenario Analysis
The scenario analysis has been done for the company for a set of four year whereby
relevant information has been taken into consideration for the company. In order to perform the
around $13.17 lower, as the share price of the company was at that point of time trading at
$31.05. The share price of the Wesfarmers Company was impacted significantly by the corporate
action taken by the company and the same even affected the Index Movement at that point of
time (Finance., 2019).
In order to well analyze the share price movement of the company along with the Index
Movement of the company, key statistical tools like the beta analysis and correlation analysis
will be done for the company for the state period of time. The All-ordinary Share Price
Movement can be well linked with the help of the share price movement which would be well
linked with the help of the beta analysis reflecting sensitivity of the stock with the share price of
the company. The beta for the share price was determined to be around 0.043 times which is
comparatively lower showing that the changes in the stock price has not particularly impacted
the index movement.
From the macro-economic perspective as the interest cost has particularly fallen in the
last two years and the inflation rate is currently stable for the Australian Economy the same is
expected to positively impact the business operations and the financial performance. Increase or
consistency in the financial performance with the help of the cost reduction and lower cost of
materials will be boosting the financial performance of the company. From the business factors
perspective it is forecasted that the management of the company will be strategizing various
strategies for the company so that the financial performance of the company becomes
consistently better for the company (Au.finance.yahoo.com, 2019).
Scenario Analysis
The scenario analysis has been done for the company for a set of four year whereby
relevant information has been taken into consideration for the company. In order to perform the
Paraphrase This Document
Need a fresh take? Get an instant paraphrase of this document with our AI Paraphraser
7ACCOUNTING FINANCIAL ANALYSIS REPORT
scenario analysis relevant information would be taken into consideration based on the
investments that would be done by the company and the amount of expenses that the company
will be incurring for the stated point of time (Gao, 2016). The two possible scenario that were
taken into consideration was the best case and worst case scenario that can possibly occur in the
due course of business operations for the company. The key common things that have been well
taken into consideration is the initial investment that is around $5,500,500 and the same would
be invested for a sum of four year time period whereby relevant analysis for the company has
been done. The scarp value that will be associated with the machinery will be around $500,000
and the associated amount of depreciation that the company will be charging on the machinery
will be based on straight line method. The taxation benefit that the company will be getting from
the depreciation expenses that will be treated as a non-cash expenses which has further been
added in the total cash flows generated by the business. The taxation rate that would be applied
for the taxation of cash flows for the company will be around 30% for the company. The annual
cash flows that would be generated from the business will be solely based on the revenue earned
and costs incurred by the company from the operations undertaken.
Best Case Scenario: In the case of best case scenario there will be increase in the revenue of the
company was seen to be on a positive note for the company whereby the sales price of the
company was seen to be increasing by around 20% along with the increase in the sales unit of the
company that was also taken to be increasing by around 20% for the company. The variable
costs for the company that would be directly attributed with the amount of units produced will be
seen decreasing by around 20%. The increase in the variable costs would be reflecting the low
cost of raw materials that the company might be using for the purpose of business operations for
the company. The fixed costs for the company that amounted to $450,000 is set to decline by
8ACCOUNTING FINANCIAL ANALYSIS REPORT
about $100,000 on an annual basis and the same is expected to boost the net cash flows that is
generated from the business. The discount rate that would be applied for the purpose of
discounting the cash flows of the company will be around 12%. The net present value generated
by the business if the scenario for business turns out to be as decided in best condition then it is
expected an all around $4,124,776,654.
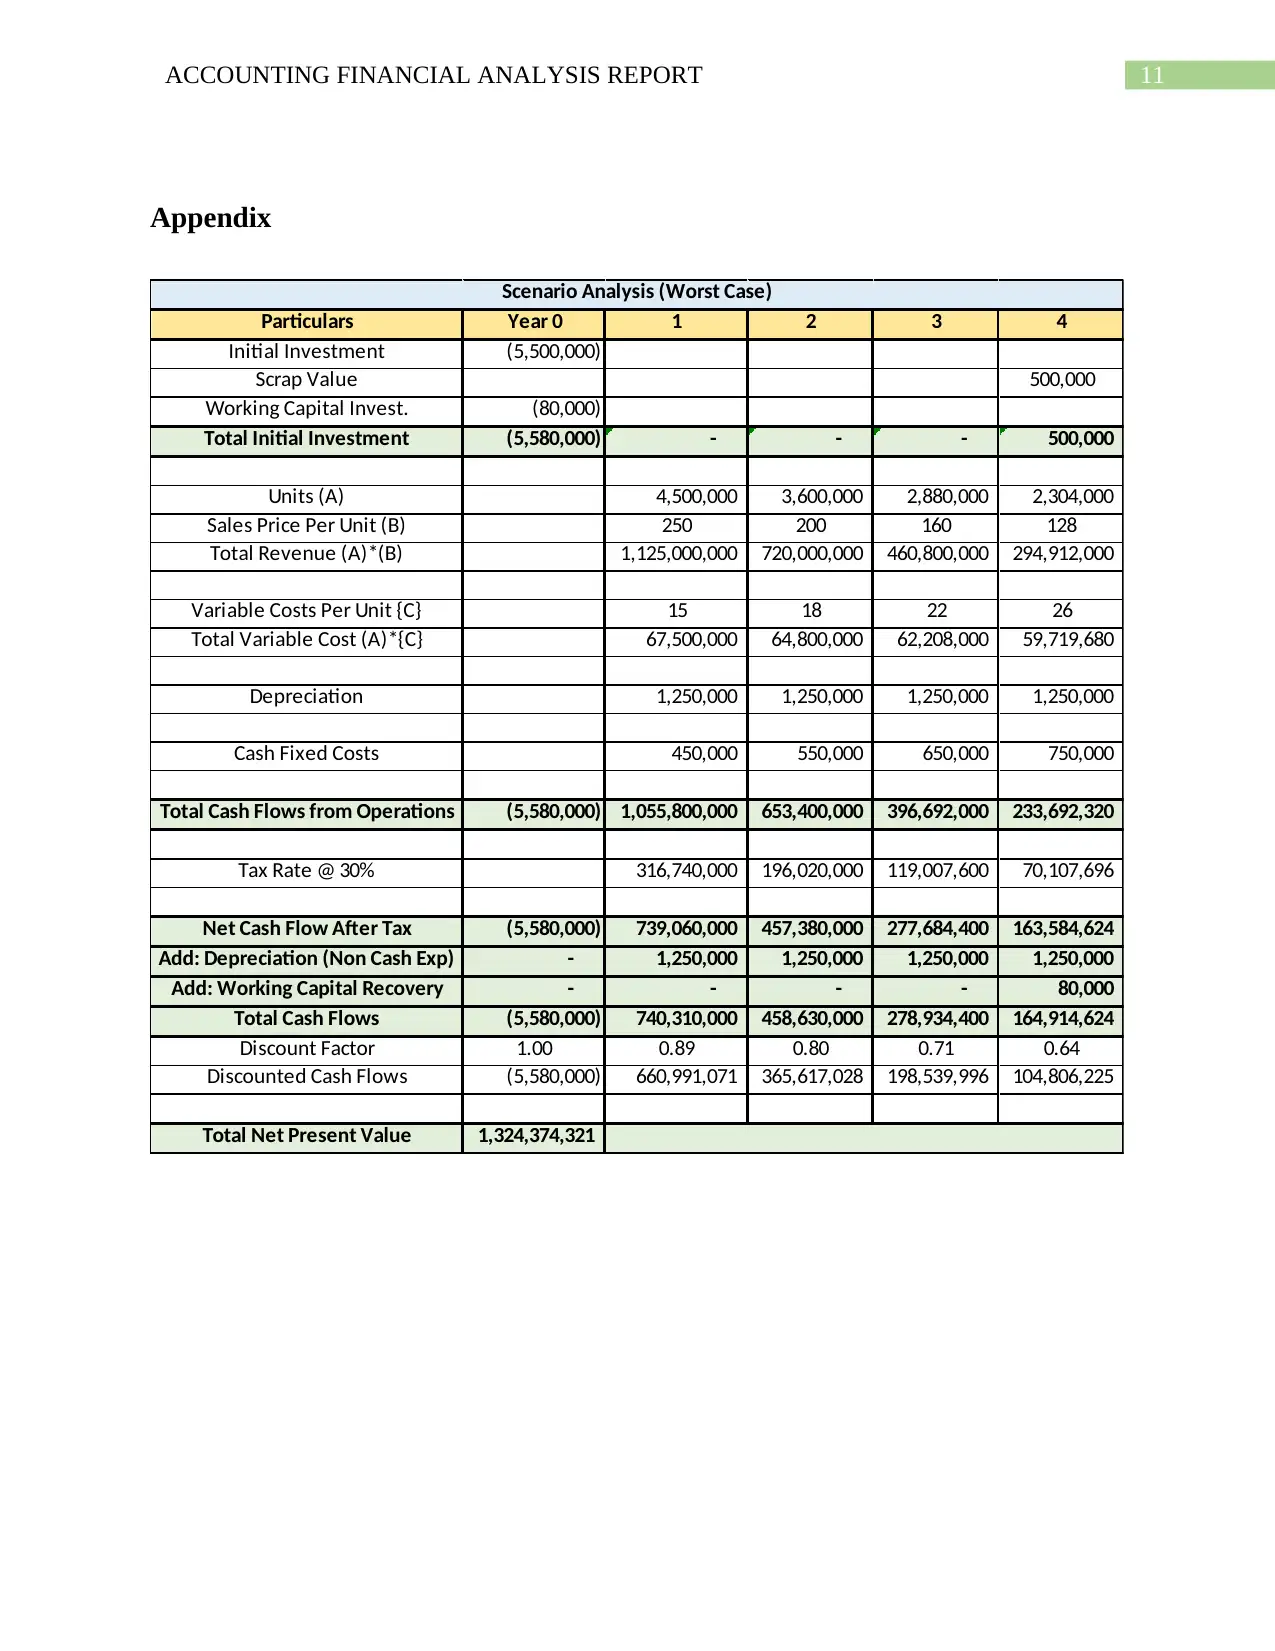
Worst Case Scenario: In the case of worst case scenario the company will can observe an
decrease in the revenue of the company was seen to be on a negative note for the company
whereby the sales price of the company was seen to be decreasing by around 20% along with the
decrease in the sales unit of the company that was also taken to be decrease by around 20% for
the company. The variable costs for the company that would be directly attributed with the
amount of units produced will be seen decreasing by around 20%. The increase in the variable
costs would be reflecting the high cost of raw materials that the company might be using for the
purpose of business operations for the company or the same can also be related to certain macro-
economic factors like inflation. The fixed costs for the company that amounted to $450,000 is set
to increase for the company on an annual basis by about $100,000, which further can disrupt the
overall cash flows that would be generated by the business. The discount rate that would be
applied for the purpose of discounting the cash flows of the company will be around 12%. The
net present value generated by the business if the scenario for business turns out to be as
predicted in worst condition then it is expected to create an wealth of all around $1,324,374,321.
Recommendations
It is recommended that the management of the company can go ahead with the project
investment that has been taken into consideration. The key basis for the recommendation
about $100,000 on an annual basis and the same is expected to boost the net cash flows that is
generated from the business. The discount rate that would be applied for the purpose of
discounting the cash flows of the company will be around 12%. The net present value generated
by the business if the scenario for business turns out to be as decided in best condition then it is
expected an all around $4,124,776,654.
Worst Case Scenario: In the case of worst case scenario the company will can observe an
decrease in the revenue of the company was seen to be on a negative note for the company
whereby the sales price of the company was seen to be decreasing by around 20% along with the
decrease in the sales unit of the company that was also taken to be decrease by around 20% for
the company. The variable costs for the company that would be directly attributed with the
amount of units produced will be seen decreasing by around 20%. The increase in the variable
costs would be reflecting the high cost of raw materials that the company might be using for the
purpose of business operations for the company or the same can also be related to certain macro-
economic factors like inflation. The fixed costs for the company that amounted to $450,000 is set
to increase for the company on an annual basis by about $100,000, which further can disrupt the
overall cash flows that would be generated by the business. The discount rate that would be
applied for the purpose of discounting the cash flows of the company will be around 12%. The
net present value generated by the business if the scenario for business turns out to be as
predicted in worst condition then it is expected to create an wealth of all around $1,324,374,321.
Recommendations
It is recommended that the management of the company can go ahead with the project
investment that has been taken into consideration. The key basis for the recommendation
9ACCOUNTING FINANCIAL ANALYSIS REPORT
presented is the various scenario under which the company’s operation will be performing and is
expected to generate a positive wealth in the form of positive net present value for the company.
The crucial things that have also well supported the investment decision is the lower amount of
fixed cost that is associated with the project and along with that the low amount of initial
investment. However, certain key negative aspects that was found was the high amount of tax
rate that is around 30% that was associated with the company it is recommended that the
company takes debt in the financing structure to further reduce the effective tax rate associated
with the business and the overall profitability of the project investment.
Secure Best Marks with AI Grader
Need help grading? Try our AI Grader for instant feedback on your assignments.
10ACCOUNTING FINANCIAL ANALYSIS REPORT
Bibliography
., Y. F. (2019, September 27). Au.finance.yahoo.com. Retrieved from Yahoo Finance:
https://au.finance.yahoo.com/news/wesfarmers-posts-1-940-million-225044644.html
Alcamo, J. H. (n.d.).
Alcamo, J. H. (2017). World water in 2025. In Global modeling and scenario analysis for the
world commission on water for the 21st century.
Annual Report. (2019, September 27). Retrieved from Wesfarmers.com.au.:
https://www.wesfarmers.com.au/docs/default-source/asx-announcements/2018-annual-
report.pdf?sfvrsn=0
Clarkson-Ledward, R. T. (2018, September 29). Why Wesfarmers Share Price Tumbled 30%. ,
from . Retrieved from Money Morning Australia.: https://www.moneymarket.com
Finance., Y. (2019, September 26). Wesfarmers Share Price. Retrieved from Yahoo Finance:
https://au.finance.yahoo.com/quote/%5EAORD/history?
period1=1506364200&period2=1569436200&interval=1mo&filter=history&frequency=
1mo
Gao, L. B. (2016). Robust global sensitivity analysis under deep uncertainty via scenario
analysis. Environmental modelling & software.
11ACCOUNTING FINANCIAL ANALYSIS REPORT
Appendix
Particulars Year 0 1 2 3 4
Initial Investment (5,500,000)
Scrap Value 500,000
Working Capital Invest. (80,000)
Total Initial Investment (5,580,000) - - - 500,000
Units (A) 4,500,000 3,600,000 2,880,000 2,304,000
Sales Price Per Unit (B) 250 200 160 128
Total Revenue (A)*(B) 1,125,000,000 720,000,000 460,800,000 294,912,000
Variable Costs Per Unit {C} 15 18 22 26
Total Variable Cost (A)*{C} 67,500,000 64,800,000 62,208,000 59,719,680
Depreciation 1,250,000 1,250,000 1,250,000 1,250,000
Cash Fixed Costs 450,000 550,000 650,000 750,000
Total Cash Flows from Operations (5,580,000) 1,055,800,000 653,400,000 396,692,000 233,692,320
Tax Rate @ 30% 316,740,000 196,020,000 119,007,600 70,107,696
Net Cash Flow After Tax (5,580,000) 739,060,000 457,380,000 277,684,400 163,584,624
Add: Depreciation (Non Cash Exp) - 1,250,000 1,250,000 1,250,000 1,250,000
Add: Working Capital Recovery - - - - 80,000
Total Cash Flows (5,580,000) 740,310,000 458,630,000 278,934,400 164,914,624
Discount Factor 1.00 0.89 0.80 0.71 0.64
Discounted Cash Flows (5,580,000) 660,991,071 365,617,028 198,539,996 104,806,225
Total Net Present Value 1,324,374,321
Scenario Analysis (Worst Case)
12ACCOUNTING FINANCIAL ANALYSIS REPORT
Particulars Year 0 1 2 3 4
Initial Investment (5,500,000)
Scrap Value 500,000
Working Capital Invest. (80,000)
Total Initial Investment (5,580,000) - - - 500,000
Units (A) 4,500,000 5,400,000 6,480,000 7,776,000
Sales Price Per Unit (B) 250 300 360 432
Total Revenue (A)*(B) 1,125,000,000 1,620,000,000 2,332,800,000 3,359,232,000
Variable Costs Per Unit {C} 15 12 9.6 7.68
Total Variable Cost (A)*{C} 67,500,000 64,800,000 62,208,000 59,719,680
Depreciation 1,250,000 1,250,000 1,250,000 1,250,000
Cash Fixed Costs 450,000 350,000 250,000 150,000
Total Cash Flows from Operations (5,580,000) 1,055,800,000 1,553,600,000 2,269,092,000 3,298,612,320
Tax Rate @ 30% (1,674,000) 316,740,000 466,080,000 680,727,600 989,583,696
Net Cash Flow After Tax (3,906,000) 739,060,000 1,087,520,000 1,588,364,400 2,309,028,624
Add: Depreciation (Non Cash Exp) - 1,250,000 1,250,000 1,250,000 1,250,000
Add: Working Capital 80,000
Total Cash Flows (3,906,000) 740,310,000 1,088,770,000 1,589,614,400 2,310,358,624
Discount Factor 1.00 0.89 0.80 0.71 0.64
Discounted Cash Flows (3,906,000) 660,991,071 867,960,778 1,131,456,132 1,468,274,673
Total Net Present Value 4,124,776,654
Scenario Analysis (Best Case)
1 out of 13
Related Documents


Your All-in-One AI-Powered Toolkit for Academic Success.
+13062052269
info@desklib.com
Available 24*7 on WhatsApp / Email
![[object Object]](/_next/static/media/star-bottom.7253800d.svg)
Unlock your academic potential
© 2024 | Zucol Services PVT LTD | All rights reserved.