Accounting Fundamentals in Business Management - Desklib
VerifiedAdded on 2023/06/18
|12
|2312
|292
AI Summary
This report covers the accounting fundamentals present in business management. It includes financial statements, balance sheets, and ratio analysis. The report explains why financial statement balances are always equal and interprets the ratio analysis. The subject is Accounting Fundamentals and Business Management, and the course code and college/university are not mentioned.
Contribute Materials
Your contribution can guide someone’s learning journey. Share your
documents today.

Business management
Secure Best Marks with AI Grader
Need help grading? Try our AI Grader for instant feedback on your assignments.
Table of Contents
INTRODUCTION...........................................................................................................................3
MAIN BODY...................................................................................................................................4
CONCLUSION..............................................................................................................................10
REFERENCES................................................................................................................................1
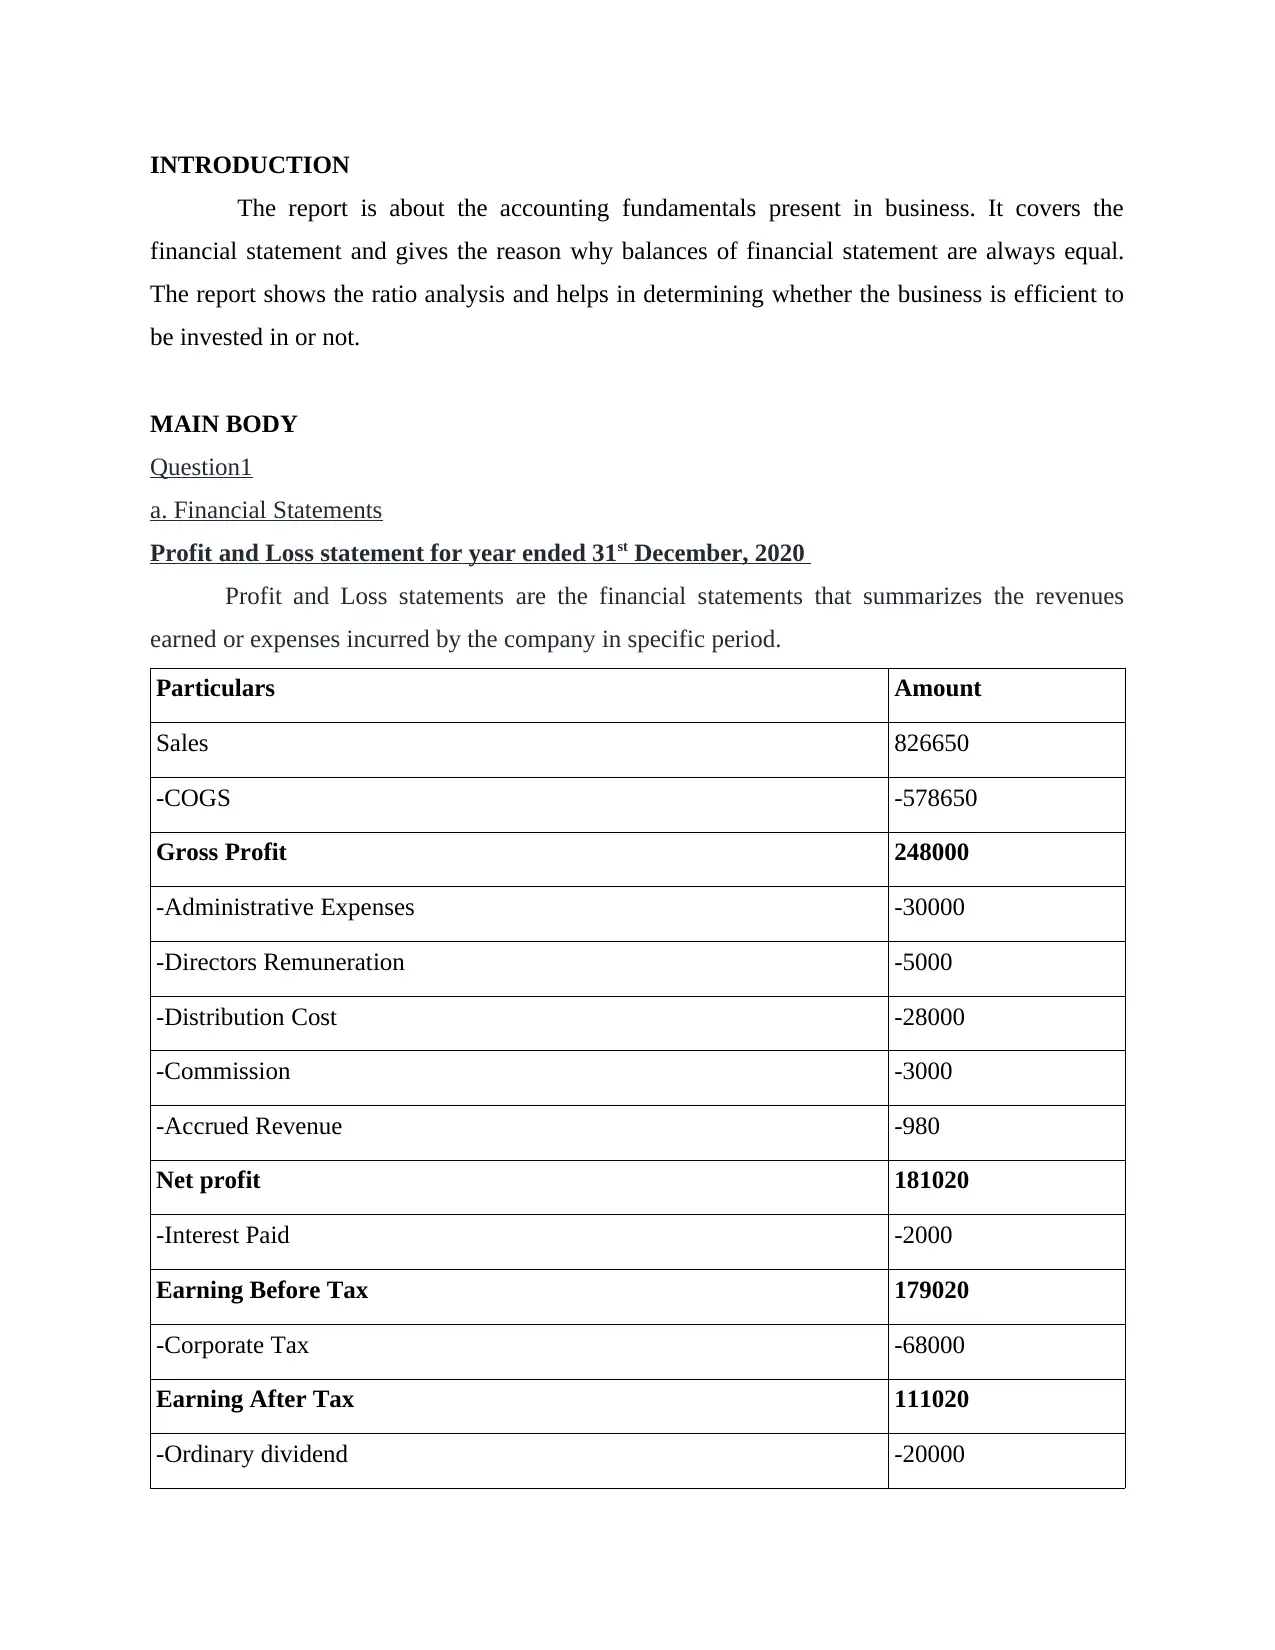
INTRODUCTION
The report is about the accounting fundamentals present in business. It covers the
financial statement and gives the reason why balances of financial statement are always equal.
The report shows the ratio analysis and helps in determining whether the business is efficient to
be invested in or not.
MAIN BODY
Question1
a. Financial Statements
Profit and Loss statement for year ended 31st December, 2020
Profit and Loss statements are the financial statements that summarizes the revenues
earned or expenses incurred by the company in specific period.
Particulars Amount
Sales 826650
-COGS -578650
Gross Profit 248000
-Administrative Expenses -30000
-Directors Remuneration -5000
-Distribution Cost -28000
-Commission -3000
-Accrued Revenue -980
Net profit 181020
-Interest Paid -2000
Earning Before Tax 179020
-Corporate Tax -68000
Earning After Tax 111020
-Ordinary dividend -20000
-Preference dividend -30000
Retained Profits 61020
Retained Profits at 1st January 2020 132000
Retained Earnings 193020
Balance Sheet of Kedison PLC as on 31st December 2020
Balance sheet determines the assets and liabilities and shareholder fund availability in a
company at specific point,
Particulars Amount
Assets:
Fixed Asset:
Plant and Equipments 632730
Current Asset:
Debtors 170125
Inventories 330600
Cash & Bank 12900
-Commission (3000) 9900
Total Assets 1144335
Liabilities:
Equity and Liability:
Shares 610000
4% Debentures 100000
Retained Earnings 193020
Secure Best Marks with AI Grader
Need help grading? Try our AI Grader for instant feedback on your assignments.
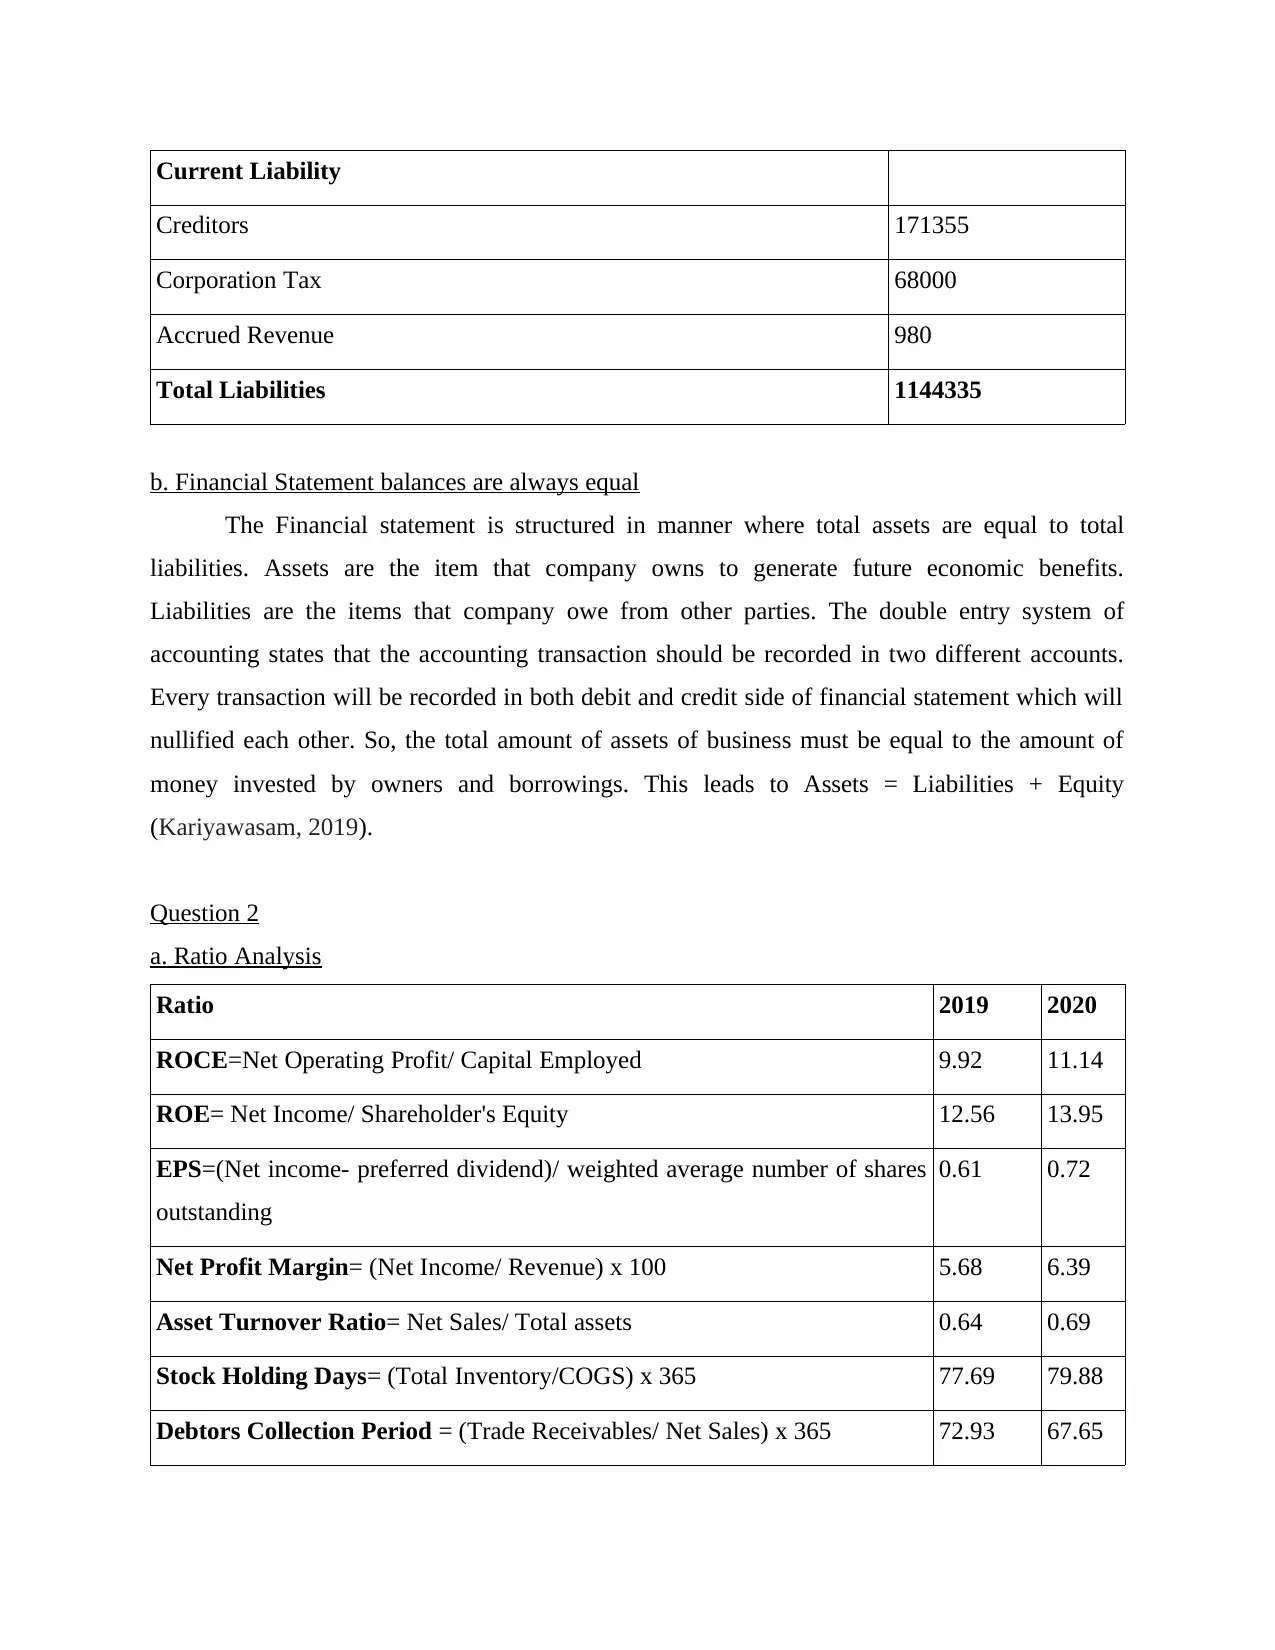
Current Liability
Creditors 171355
Corporation Tax 68000
Accrued Revenue 980
Total Liabilities 1144335
b. Financial Statement balances are always equal
The Financial statement is structured in manner where total assets are equal to total
liabilities. Assets are the item that company owns to generate future economic benefits.
Liabilities are the items that company owe from other parties. The double entry system of
accounting states that the accounting transaction should be recorded in two different accounts.
Every transaction will be recorded in both debit and credit side of financial statement which will
nullified each other. So, the total amount of assets of business must be equal to the amount of
money invested by owners and borrowings. This leads to Assets = Liabilities + Equity
(Kariyawasam, 2019).
Question 2
a. Ratio Analysis
Ratio 2019 2020
ROCE=Net Operating Profit/ Capital Employed 9.92 11.14
ROE= Net Income/ Shareholder's Equity 12.56 13.95
EPS=(Net income- preferred dividend)/ weighted average number of shares
outstanding
0.61 0.72
Net Profit Margin= (Net Income/ Revenue) x 100 5.68 6.39
Asset Turnover Ratio= Net Sales/ Total assets 0.64 0.69
Stock Holding Days= (Total Inventory/COGS) x 365 77.69 79.88
Debtors Collection Period = (Trade Receivables/ Net Sales) x 365 72.93 67.65
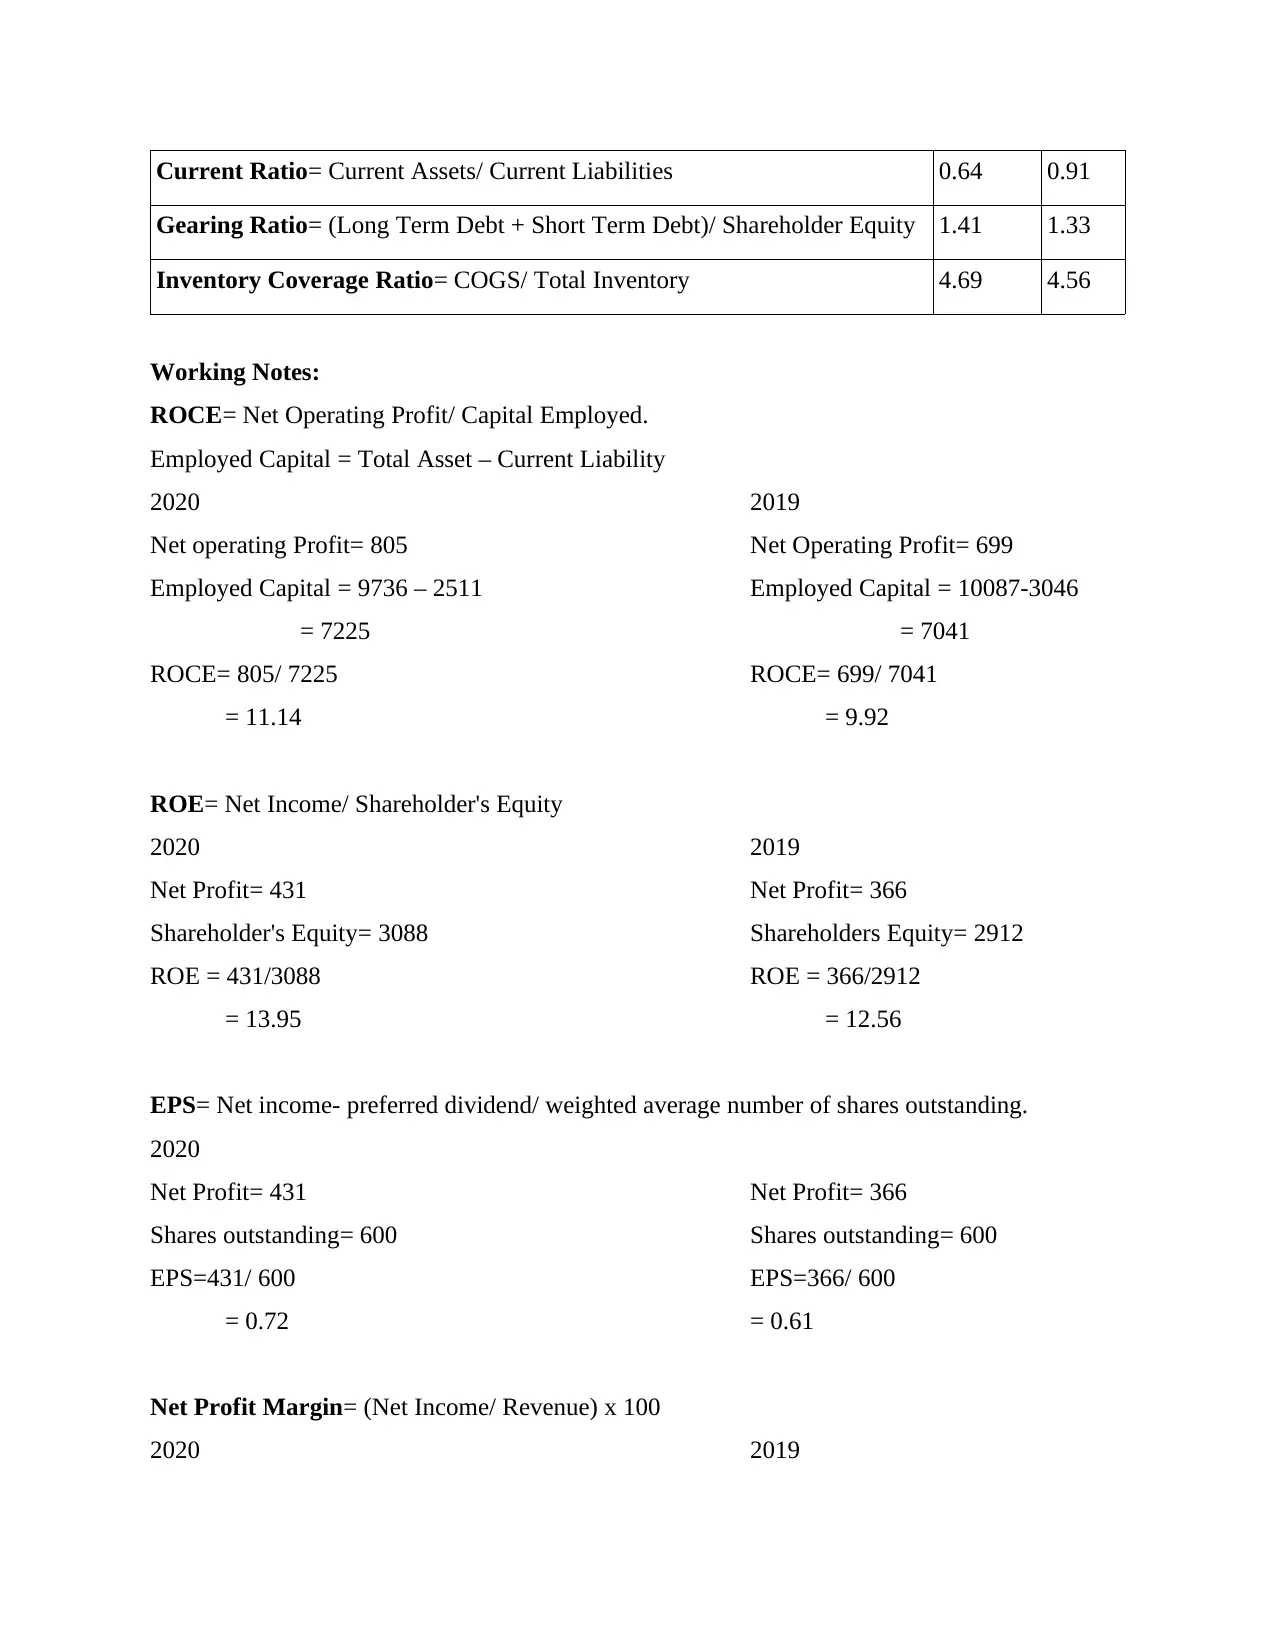
Current Ratio= Current Assets/ Current Liabilities 0.64 0.91
Gearing Ratio= (Long Term Debt + Short Term Debt)/ Shareholder Equity 1.41 1.33
Inventory Coverage Ratio= COGS/ Total Inventory 4.69 4.56
Working Notes:
ROCE= Net Operating Profit/ Capital Employed.
Employed Capital = Total Asset – Current Liability
2020 2019
Net operating Profit= 805 Net Operating Profit= 699
Employed Capital = 9736 – 2511 Employed Capital = 10087-3046
= 7225 = 7041
ROCE= 805/ 7225 ROCE= 699/ 7041
= 11.14 = 9.92
ROE= Net Income/ Shareholder's Equity
2020 2019
Net Profit= 431 Net Profit= 366
Shareholder's Equity= 3088 Shareholders Equity= 2912
ROE = 431/3088 ROE = 366/2912
= 13.95 = 12.56
EPS= Net income- preferred dividend/ weighted average number of shares outstanding.
2020
Net Profit= 431 Net Profit= 366
Shares outstanding= 600 Shares outstanding= 600
EPS=431/ 600 EPS=366/ 600
= 0.72 = 0.61
Net Profit Margin= (Net Income/ Revenue) x 100
2020 2019
Net Profit= 431 Net Profit= 366
Revenue= 6738 Revenue= 6441
Net Profit Margin= (431/6738) x 100 Net Profit Margin= (366/6441) x 100
= 6.39 = 5.68
Asset Turnover Ratio= Net Sales/ Total assets
2020 2019
Net Sales= 6738 Net Sales= 6441
Total Assets= 9736 Total Asset= 10087
ATR= 6738/9736 ATR= 6441/10087
= 0.69 = 0.64
Stock Holding Days= (Total Inventory/COGS) x 365
2020 2019
Total Inventory= 708 Total Inventory= 659
COGS = 3235 COGS= 3096
Stock holding days= (708/3235) x 365 Stock Holding Days= (659/3096) x 365
= 79.88 = 77.69
Debtors Collection Period = (Trade Receivables/ Net Sales) x 365
2020 2019
Net Sales= 6738 Net Sales= 6441
Trade Receivables= 1249 Trade Receivables= 1287
DCP=(1249/6738) x 365 DCP=(1287/6441) x 365
= 67.65 = 72.93
Current Ratio= Current Assets/ Current Liabilities
2020 2019
Current Assets= 2303 Current Assets= 2355
Current Liabilities= 2511 Current Liabilities= 3046
CR= 2303/2511 CR= 2355/3046
Paraphrase This Document
Need a fresh take? Get an instant paraphrase of this document with our AI Paraphraser
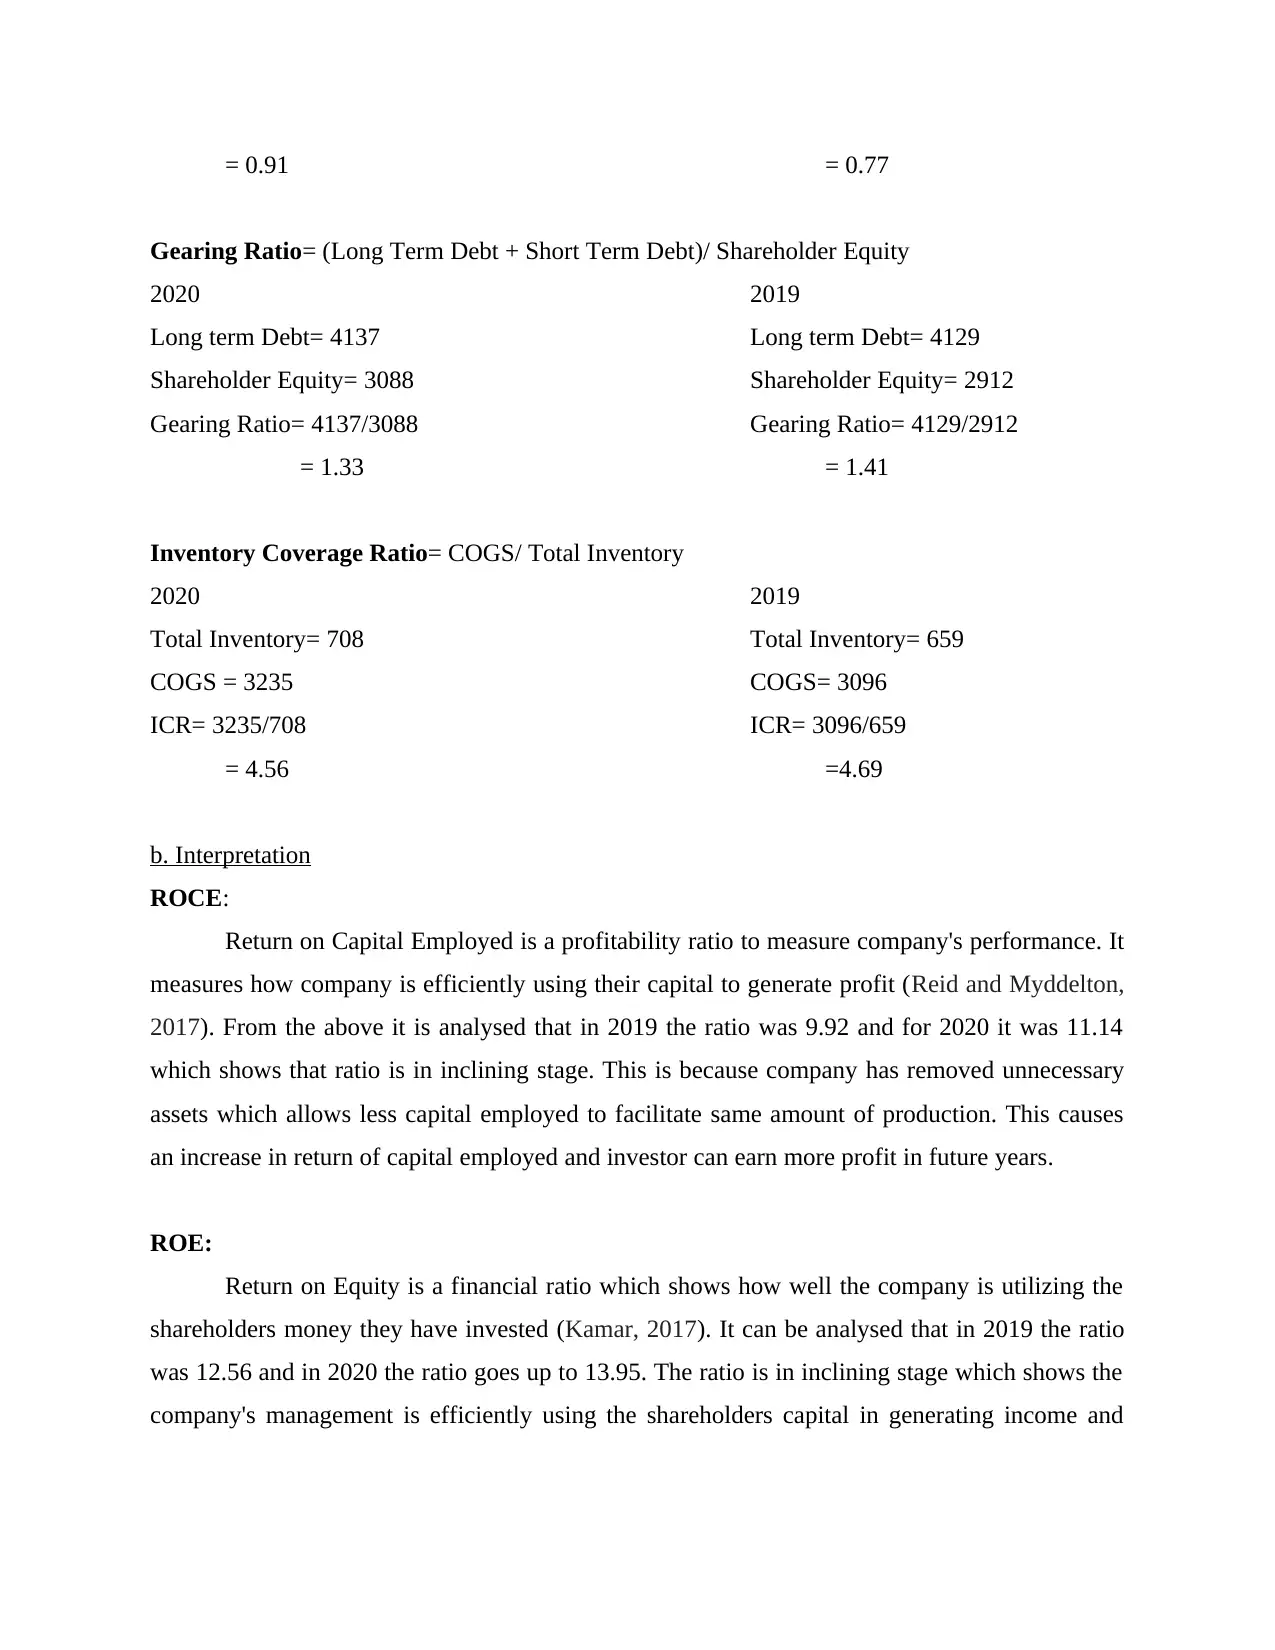
= 0.91 = 0.77
Gearing Ratio= (Long Term Debt + Short Term Debt)/ Shareholder Equity
2020 2019
Long term Debt= 4137 Long term Debt= 4129
Shareholder Equity= 3088 Shareholder Equity= 2912
Gearing Ratio= 4137/3088 Gearing Ratio= 4129/2912
= 1.33 = 1.41
Inventory Coverage Ratio= COGS/ Total Inventory
2020 2019
Total Inventory= 708 Total Inventory= 659
COGS = 3235 COGS= 3096
ICR= 3235/708 ICR= 3096/659
= 4.56 =4.69
b. Interpretation
ROCE:
Return on Capital Employed is a profitability ratio to measure company's performance. It
measures how company is efficiently using their capital to generate profit (Reid and Myddelton,
2017). From the above it is analysed that in 2019 the ratio was 9.92 and for 2020 it was 11.14
which shows that ratio is in inclining stage. This is because company has removed unnecessary
assets which allows less capital employed to facilitate same amount of production. This causes
an increase in return of capital employed and investor can earn more profit in future years.
ROE:
Return on Equity is a financial ratio which shows how well the company is utilizing the
shareholders money they have invested (Kamar, 2017). It can be analysed that in 2019 the ratio
was 12.56 and in 2020 the ratio goes up to 13.95. The ratio is in inclining stage which shows the
company's management is efficiently using the shareholders capital in generating income and
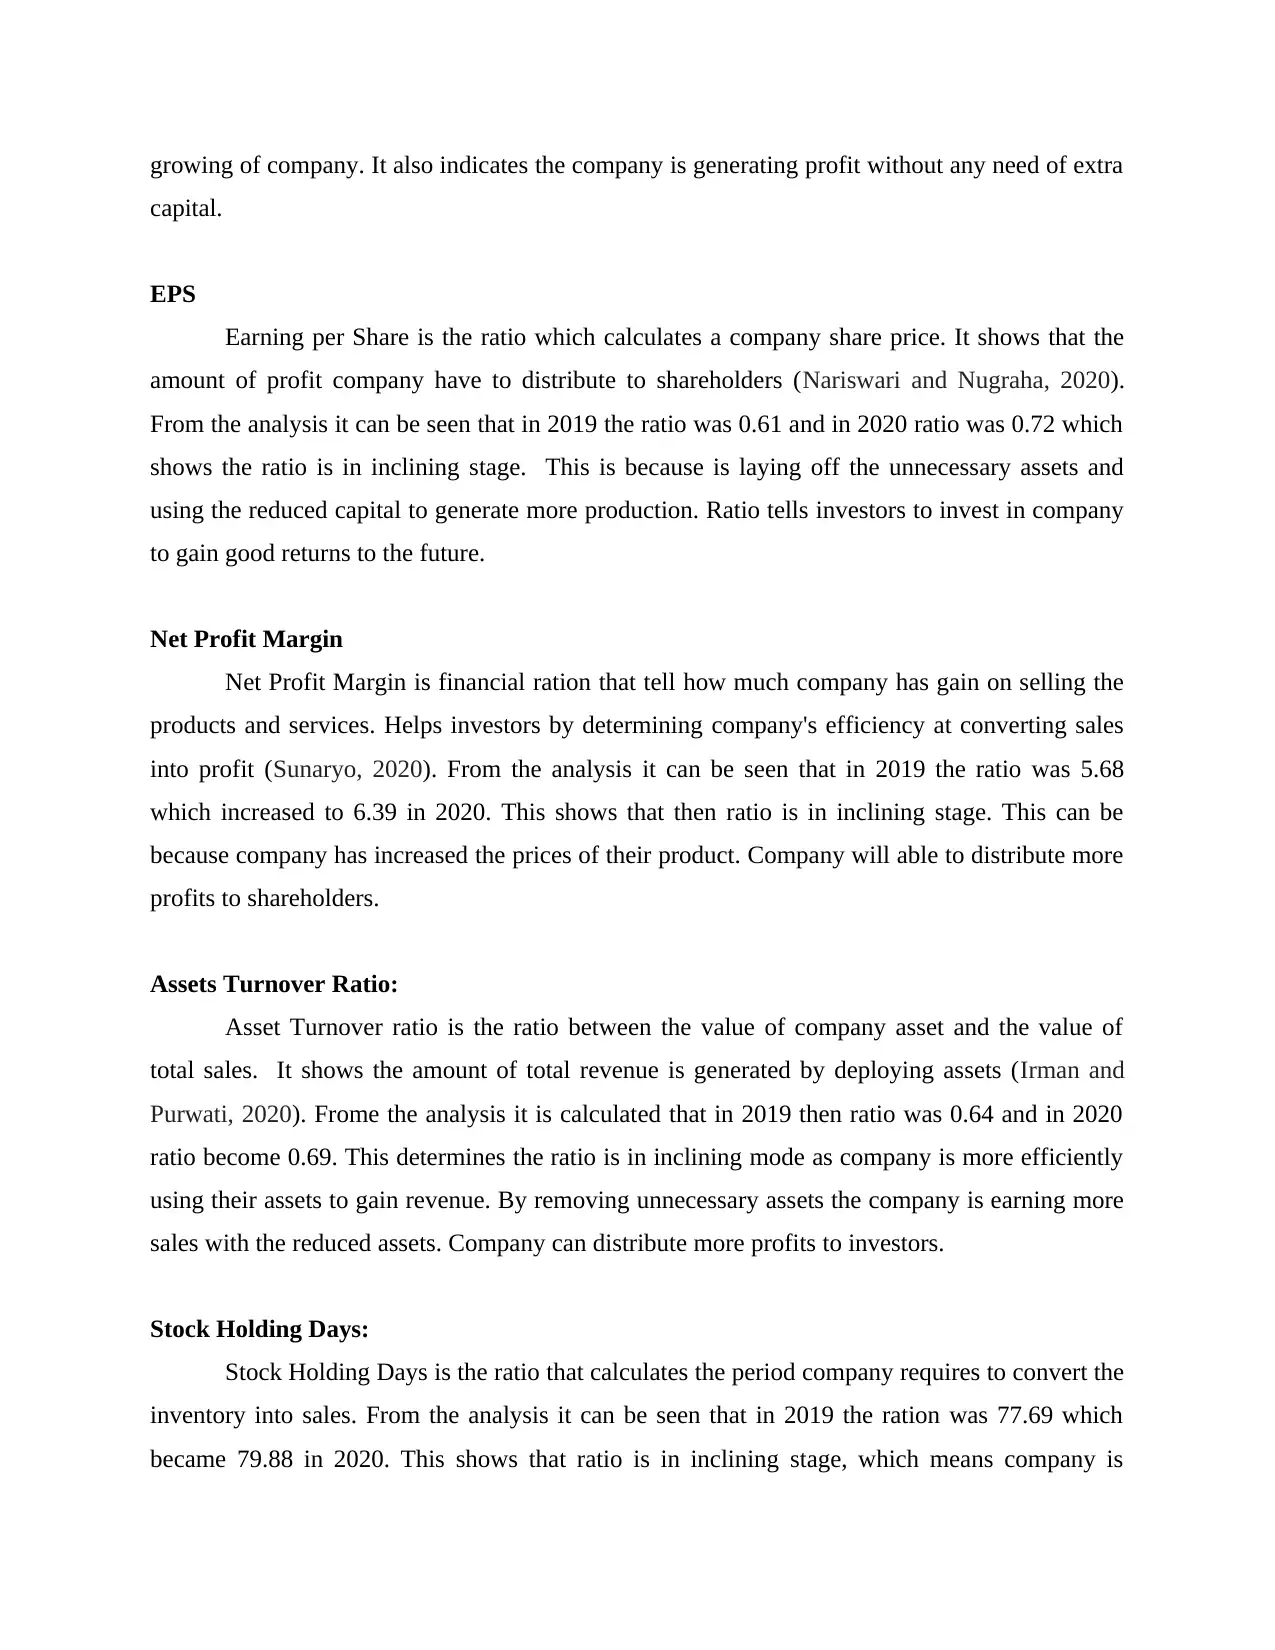
growing of company. It also indicates the company is generating profit without any need of extra
capital.
EPS
Earning per Share is the ratio which calculates a company share price. It shows that the
amount of profit company have to distribute to shareholders (Nariswari and Nugraha, 2020).
From the analysis it can be seen that in 2019 the ratio was 0.61 and in 2020 ratio was 0.72 which
shows the ratio is in inclining stage. This is because is laying off the unnecessary assets and
using the reduced capital to generate more production. Ratio tells investors to invest in company
to gain good returns to the future.
Net Profit Margin
Net Profit Margin is financial ration that tell how much company has gain on selling the
products and services. Helps investors by determining company's efficiency at converting sales
into profit (Sunaryo, 2020). From the analysis it can be seen that in 2019 the ratio was 5.68
which increased to 6.39 in 2020. This shows that then ratio is in inclining stage. This can be
because company has increased the prices of their product. Company will able to distribute more
profits to shareholders.
Assets Turnover Ratio:
Asset Turnover ratio is the ratio between the value of company asset and the value of
total sales. It shows the amount of total revenue is generated by deploying assets (Irman and
Purwati, 2020). Frome the analysis it is calculated that in 2019 then ratio was 0.64 and in 2020
ratio become 0.69. This determines the ratio is in inclining mode as company is more efficiently
using their assets to gain revenue. By removing unnecessary assets the company is earning more
sales with the reduced assets. Company can distribute more profits to investors.
Stock Holding Days:
Stock Holding Days is the ratio that calculates the period company requires to convert the
inventory into sales. From the analysis it can be seen that in 2019 the ration was 77.69 which
became 79.88 in 2020. This shows that ratio is in inclining stage, which means company is
purchasing too many stuffs. Having too much idle inventory can eventually become obsolete
which will negatively impact cash flow.
Debtors Collection Period
Debtors Collection Period shows the number of days company takes to convert the debts
taken by customer into cash (Podile, Sivasree and Rani, 2020). From the analysis it can be seen
that in 2019 the ration was 72.93 which became 67.65 in 2020. This shows the ratio is in
declining stage which means the company efficiency of converting the debts into cash is rising.
This will result in more cash availability to do business operations and earn more profit.
Current Ratio:
The current ratio is financial ratio which determines company's efficiency to meet their
short term obligations (Rochim and Ghoniyah, 2017). The analysis shows that the ratio in 2019
was 0.64 which became 0.93 in 2020. This shows that the ratio is in inclining stage which is
because there have been delayed in payments by customers and company makes more purchase
of stocks, which results in increase of assets. Thais is a good thing for investor in knowing
company's efficiency to pay their debts.
Gearing Ratio
Gearing ratio are the financial ratio that gives the idea of company's existing equity to
pay of their debts (Wahyuni, Ayem and Suyanto, 2017). From the analysis it can be seen that the
ratio in 2019 was 1.41 which became 1.33 in 2020. This shows that the ratio is declining stage
company is having less debt as compared to equity. The company is selling of their stick easily
which increases the generation of cash to pay debts faster.
Inventory Coverage Ratio:
Inventory Turnover ratio is the efficiency ratio that is used to measurer how efficiently
company is managing its inventory (Amanda, 2019). From the above analysis it can be seen that
in 2019 the ratio was 4.69 which became 4.56 in 2020. This shows that the ratio is in inclining
stage which means that company's sales are increasing, which leads to more profit. This results
in more distribution of profits among investors.
Secure Best Marks with AI Grader
Need help grading? Try our AI Grader for instant feedback on your assignments.
CONCLUSION
From the above report it is concluded that analysis of financial statement is very
important to determine the performance and position of the company. Likewise, from task 2 it is
also concluded that the all ratio are increasing. Hence, Chocco PLC performance is rising which
makes a good company for investors to invest in.
REFERENCES
Books and journals
Amanda, R.I., 2019. The Impact of Cash Turnover, Receivable Turnover, Inventory Turnover,
Current Ratio and Debt to Equity Ratio on Profitability. Journal of research in
management. 2(2).
Irman, M. and Purwati, A.A., 2020. Analysis On The Influence Of Current Ratio, Debt to Equity
Ratio and Total Asset Turnover Toward Return On Assets On The Otomotive and
Component Company That Has Been Registered In Indonesia Stock Exchange Within
2011-2017. International Journal of Economics Development Research (IJEDR). 1(1).
pp.36-44.
Kamar, K., 2017. Analysis of the effect of return on equity (ROE) and debt to equity ratio (DER)
on stock price on cement industry listed in Indonesia stock exchange (IDX) in the year
of 2011-2015. IOSR Journal of Business and Management. 19(05). pp.66-76.
Kariyawasam, H.N., 2019. Analysing the Impact of Financial Ratios on a Company’s Financial
Performance. International Journal of Management Excellence. 13(1). pp.1898-1903.
Nariswari, T.N. and Nugraha, N.M., 2020. Profit Growth: Impact of Net Profit Margin, Gross
Profit Margin and Total Assests Turnover. International Journal of Finance & Banking
Studies (2147-4486). 9(4). pp.87-96.
Podile, V., Sivasree, C.H.V. and Rani, K.S., 2020. Receivables Management in Micro and Small
Enterprises. Journal of Critical Reviews. 7(18). pp.722-726.
Reid, W. and Myddelton, D.R., 2017. Gearing. In The Meaning of Company Accounts. (pp. 164-
166). Routledge.
Rochim, R. and Ghoniyah, N., 2017. Analysis On The Effect of Current Ratio, Cashflow From
Operation to Debt, Firm Size and Return on Equity on Stock Return. International
Journal of Islamic Business Ethics. 2(3). pp.41-51.
Sunaryo, D., 2020. The Effect of Net Profit Margin, Return on Asset, Return on Equity on Share
Prices in The Southeast Asian Metal Industry. International Journal of Science,
Technology & Management. 1(3). pp.198-208.
Wahyuni, T., Ayem, S. and Suyanto, S., 2017. Pengaruh Quick Ratio, Debt To Equity Ratio,
Inventory Turnover Dan Net Profit Margin Terhadap Pertumbuhan Laba Pada
Perusahaan Manufaktur Yang Terdaftar Di Bursa Efek Indonesia Tahun 2011–
2015. Jurnal Akuntansi Dewantara. 1(2). pp.12-21.
1
1 out of 12
Related Documents


Your All-in-One AI-Powered Toolkit for Academic Success.
+13062052269
info@desklib.com
Available 24*7 on WhatsApp / Email
![[object Object]](/_next/static/media/star-bottom.7253800d.svg)
Unlock your academic potential
© 2024 | Zucol Services PVT LTD | All rights reserved.