Activity Based Costing and Traditional Based Costing
VerifiedAdded on 2023/03/23
|15
|2758
|96
AI Summary
This document discusses the differences between Activity Based Costing and Traditional Based Costing methods and their impact on cost allocation. It also explores the reasons behind changes in production costs and how the cost of products can be overstated.
Contribute Materials
Your contribution can guide someone’s learning journey. Share your
documents today.
ACTIVITY BASED COSTING AND TRADITIONAL
BASED COSTING
BASED COSTING
Secure Best Marks with AI Grader
Need help grading? Try our AI Grader for instant feedback on your assignments.
Answer 1,2,3&4
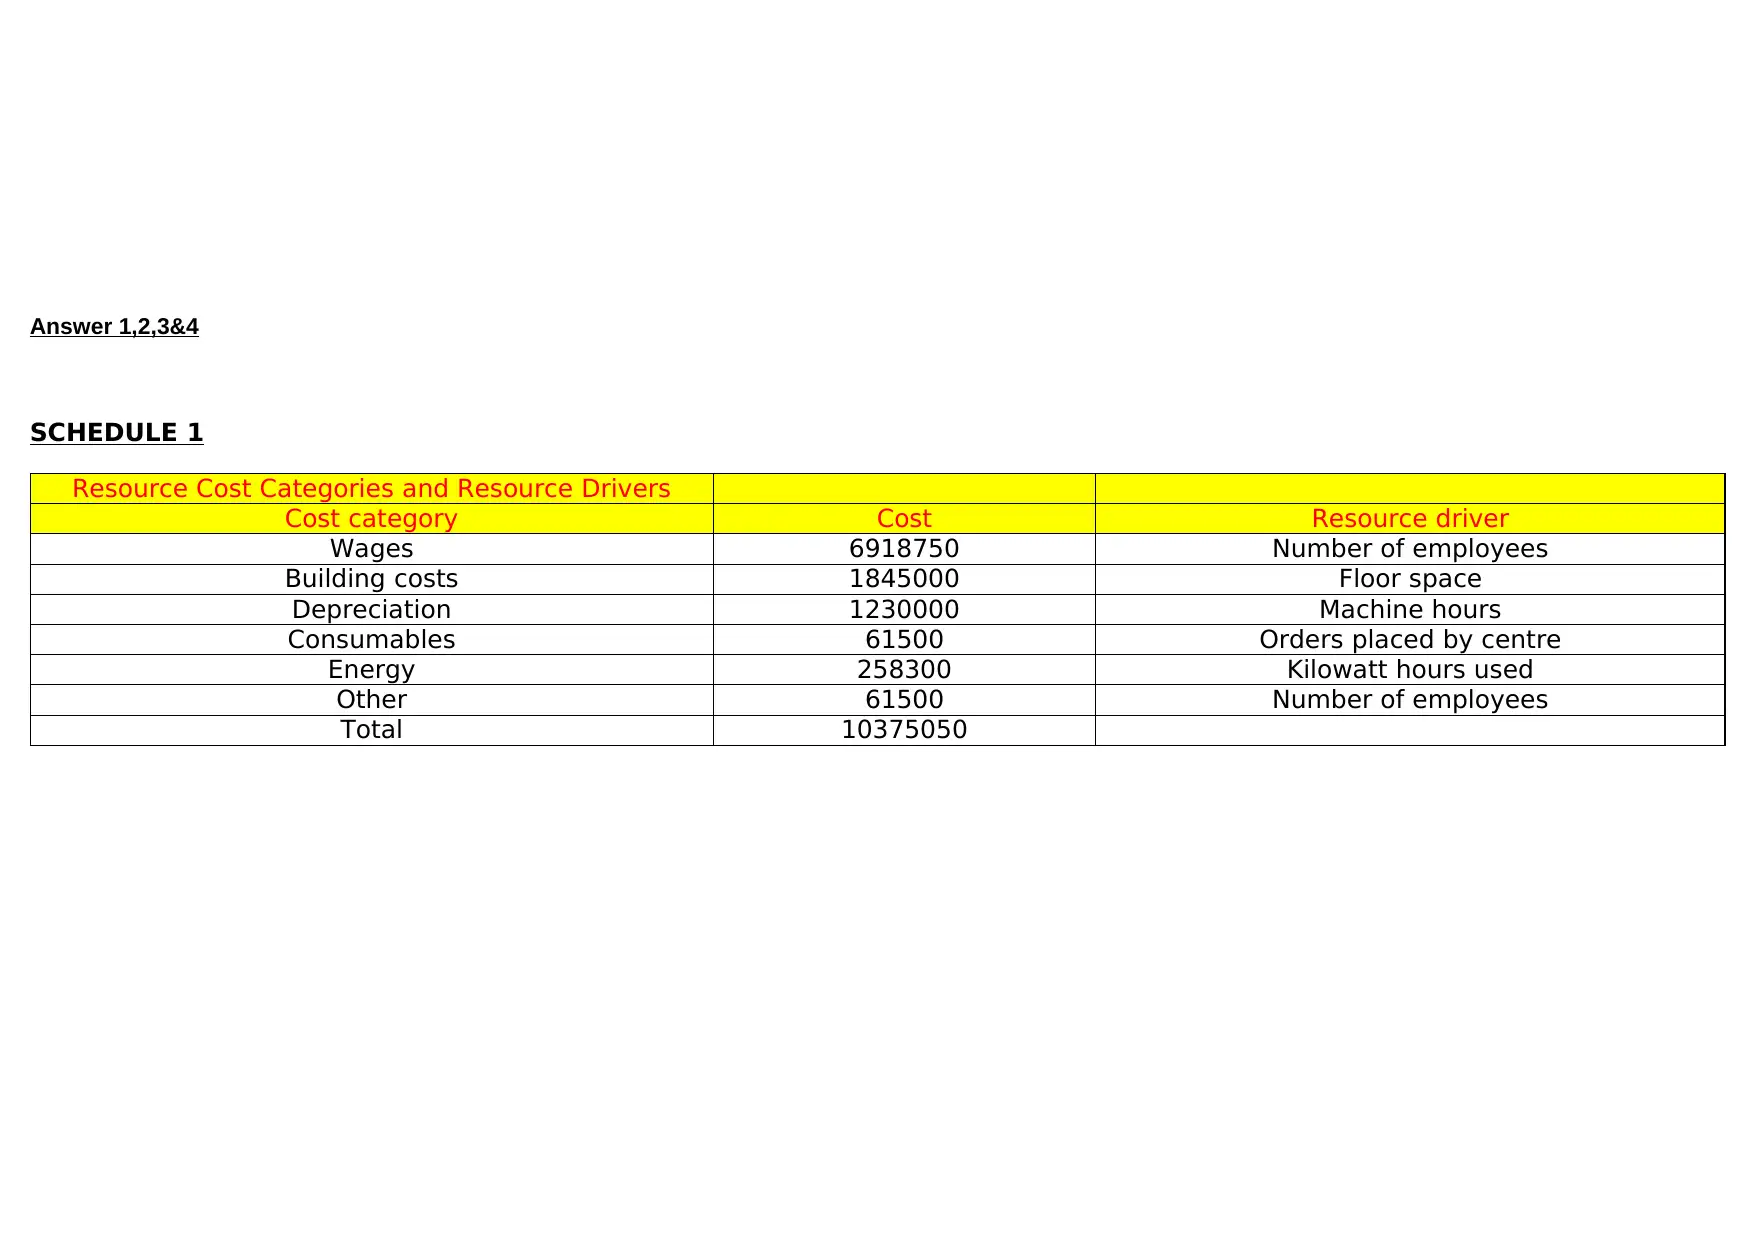
SCHEDULE 1
Resource Cost Categories and Resource Drivers
Cost category Cost Resource driver
Wages 6918750 Number of employees
Building costs 1845000 Floor space
Depreciation 1230000 Machine hours
Consumables 61500 Orders placed by centre
Energy 258300 Kilowatt hours used
Other 61500 Number of employees
Total 10375050
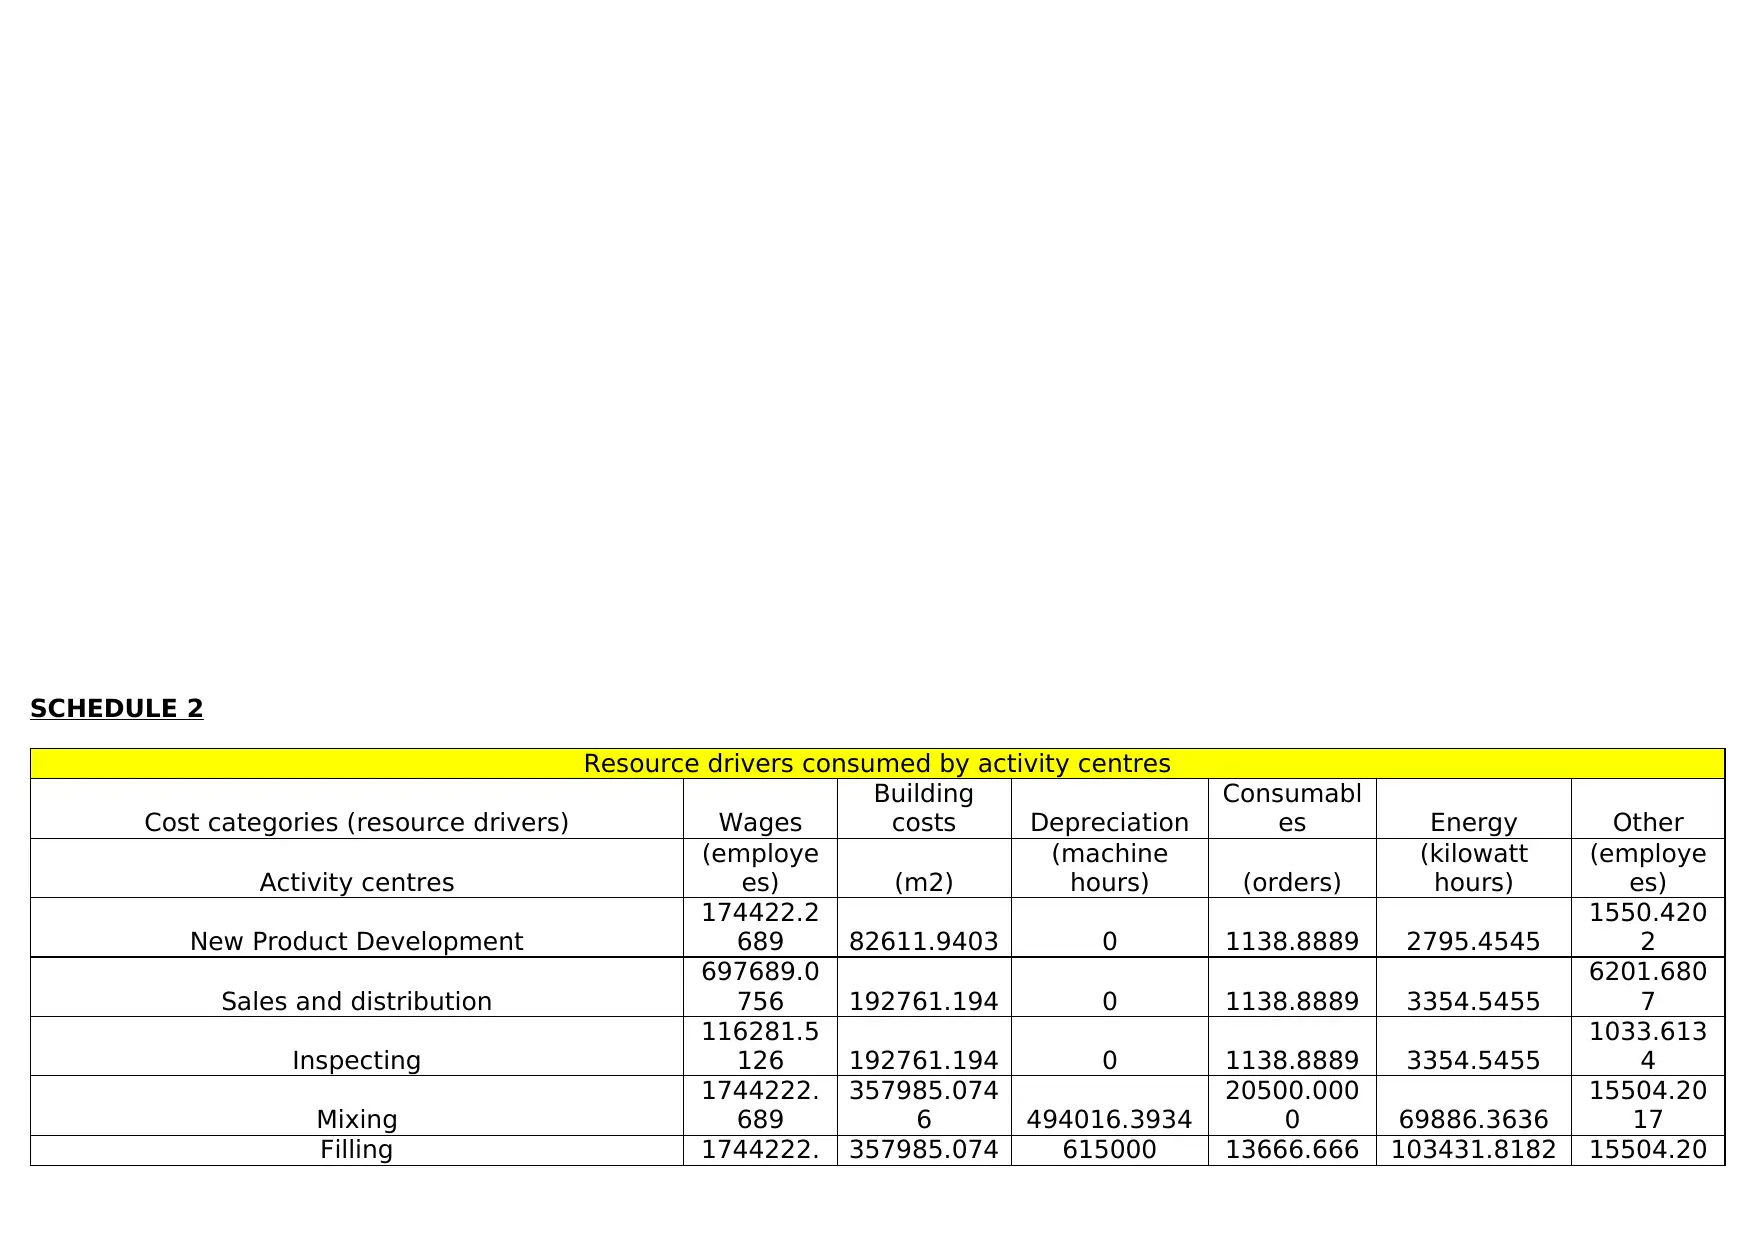
SCHEDULE 2
Resource drivers consumed by activity centres
Cost categories (resource drivers) Wages
Building
costs Depreciation
Consumabl
es Energy Other
Activity centres
(employe
es) (m2)
(machine
hours) (orders)
(kilowatt
hours)
(employe
es)
New Product Development
174422.2
689 82611.9403 0 1138.8889 2795.4545
1550.420
2
Sales and distribution
697689.0
756 192761.194 0 1138.8889 3354.5455
6201.680
7
Inspecting
116281.5
126 192761.194 0 1138.8889 3354.5455
1033.613
4
Mixing
1744222.
689
357985.074
6 494016.3934
20500.000
0 69886.3636
15504.20
17
Filling 1744222. 357985.074 615000 13666.666 103431.8182 15504.20
689 6 7 17
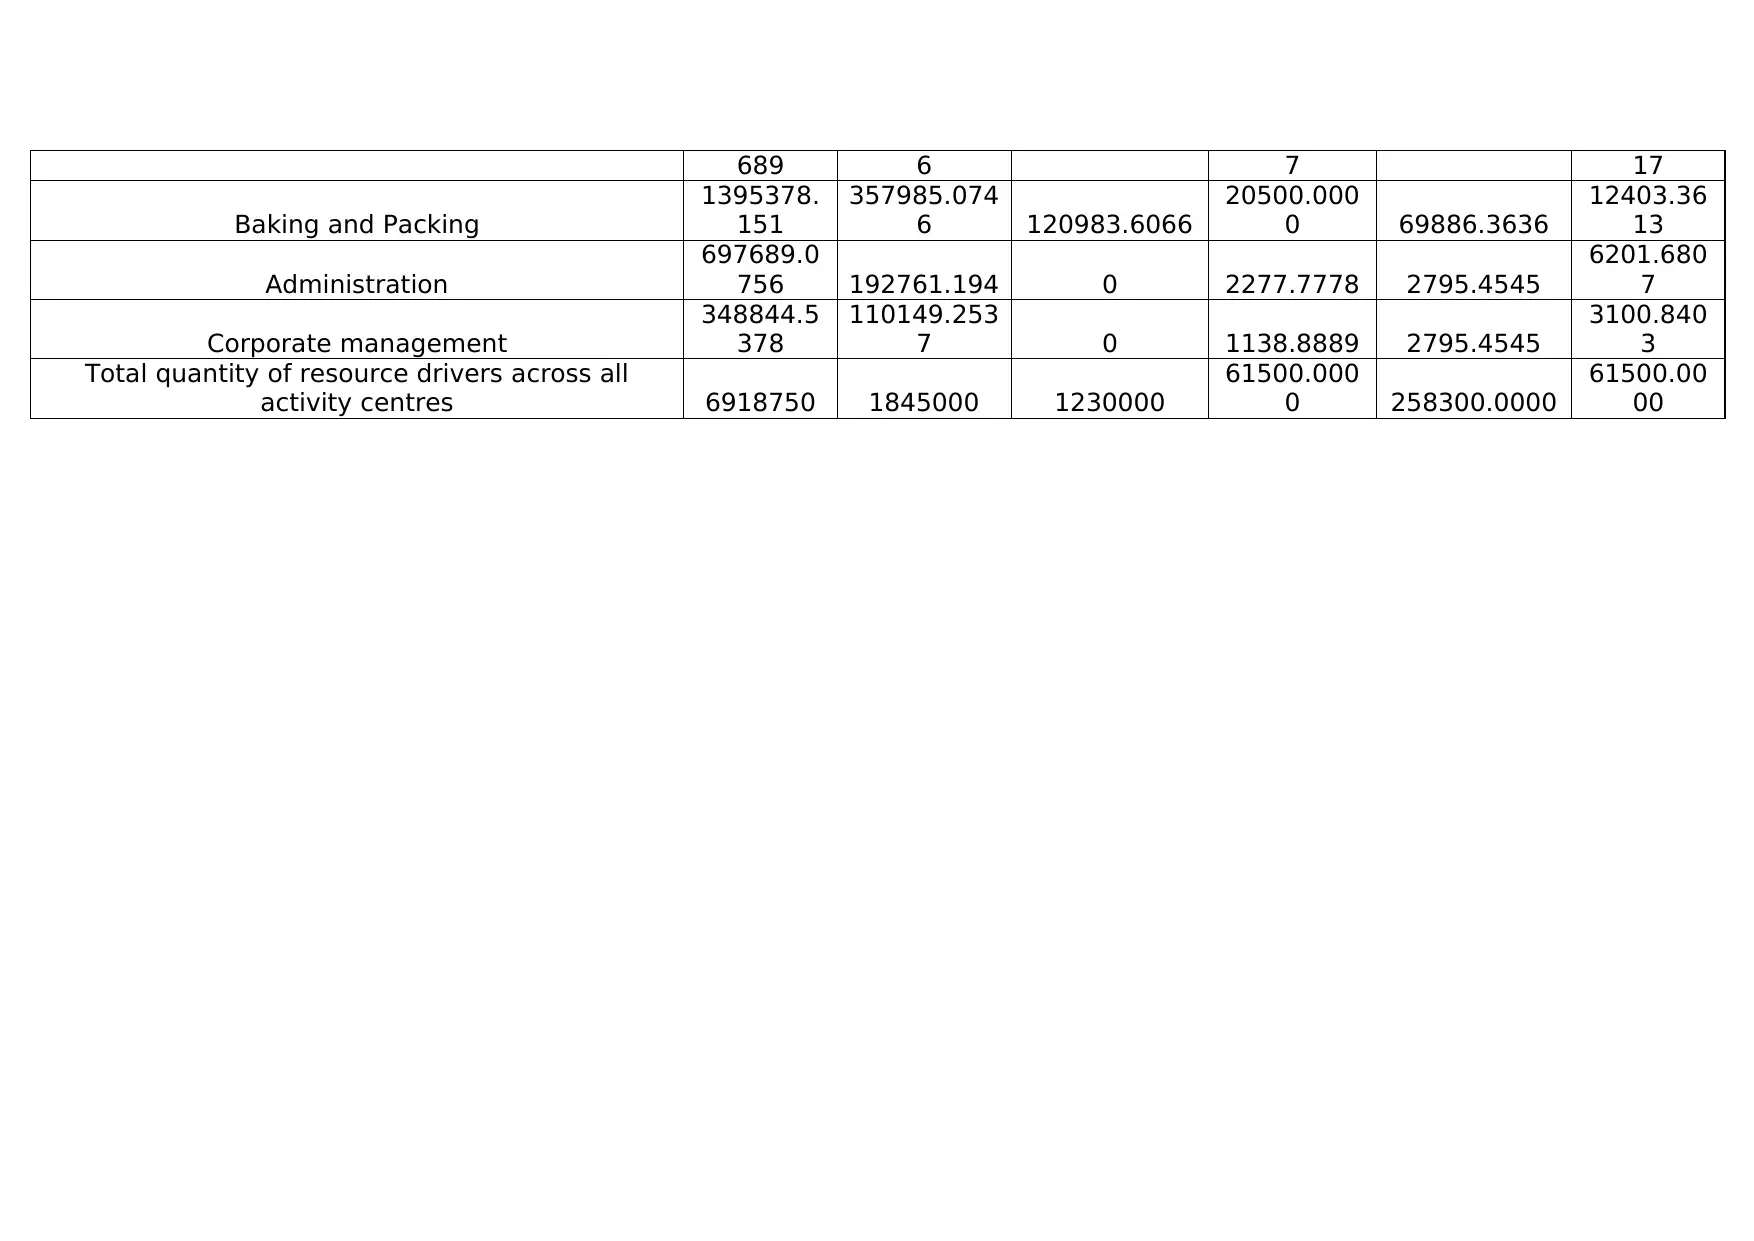
Baking and Packing
1395378.
151
357985.074
6 120983.6066
20500.000
0 69886.3636
12403.36
13
Administration
697689.0
756 192761.194 0 2277.7778 2795.4545
6201.680
7
Corporate management
348844.5
378
110149.253
7 0 1138.8889 2795.4545
3100.840
3
Total quantity of resource drivers across all
activity centres 6918750 1845000 1230000
61500.000
0 258300.0000
61500.00
00
Secure Best Marks with AI Grader
Need help grading? Try our AI Grader for instant feedback on your assignments.
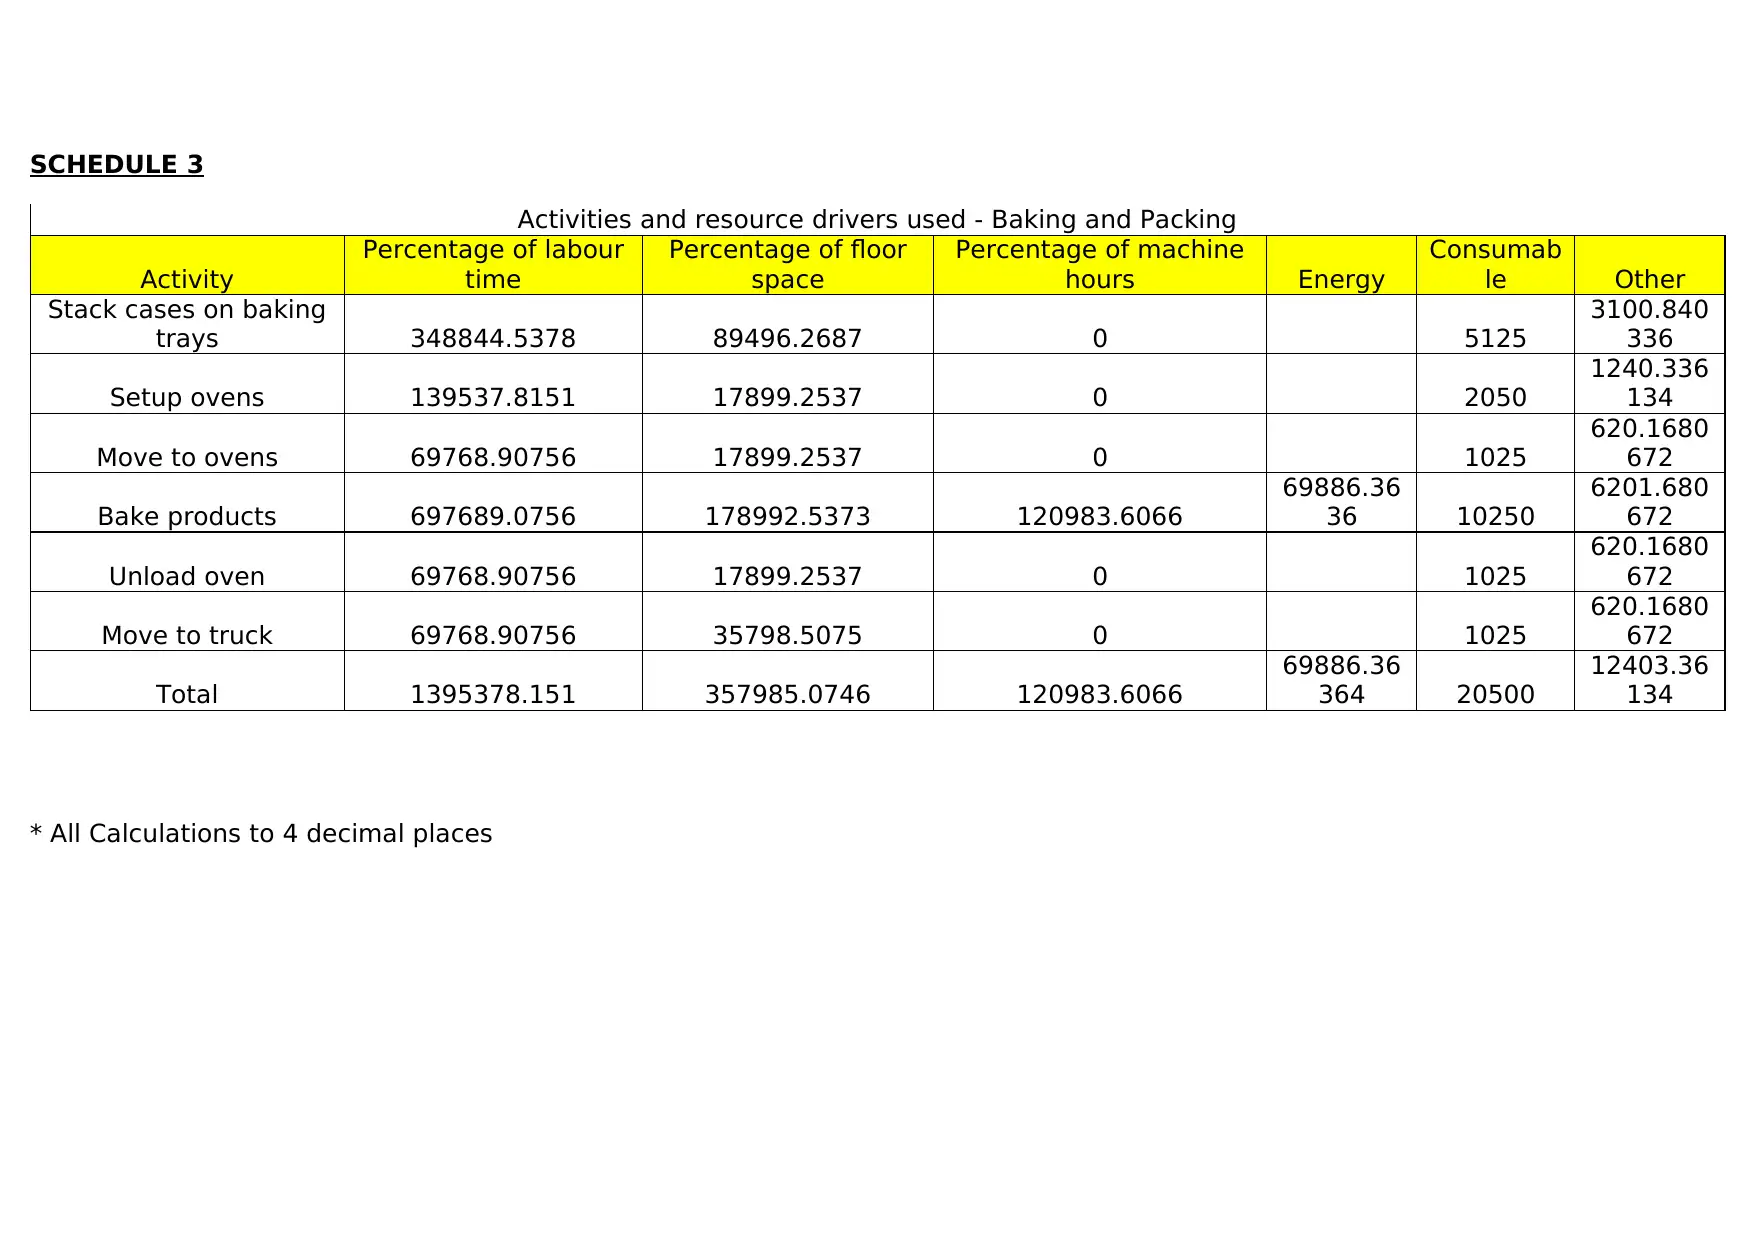
SCHEDULE 3
Activities and resource drivers used - Baking and Packing
Activity
Percentage of labour
time
Percentage of floor
space
Percentage of machine
hours Energy
Consumab
le Other
Stack cases on baking
trays 348844.5378 89496.2687 0 5125
3100.840
336
Setup ovens 139537.8151 17899.2537 0 2050
1240.336
134
Move to ovens 69768.90756 17899.2537 0 1025
620.1680
672
Bake products 697689.0756 178992.5373 120983.6066
69886.36
36 10250
6201.680
672
Unload oven 69768.90756 17899.2537 0 1025
620.1680
672
Move to truck 69768.90756 35798.5075 0 1025
620.1680
672
Total 1395378.151 357985.0746 120983.6066
69886.36
364 20500
12403.36
134
* All Calculations to 4 decimal places
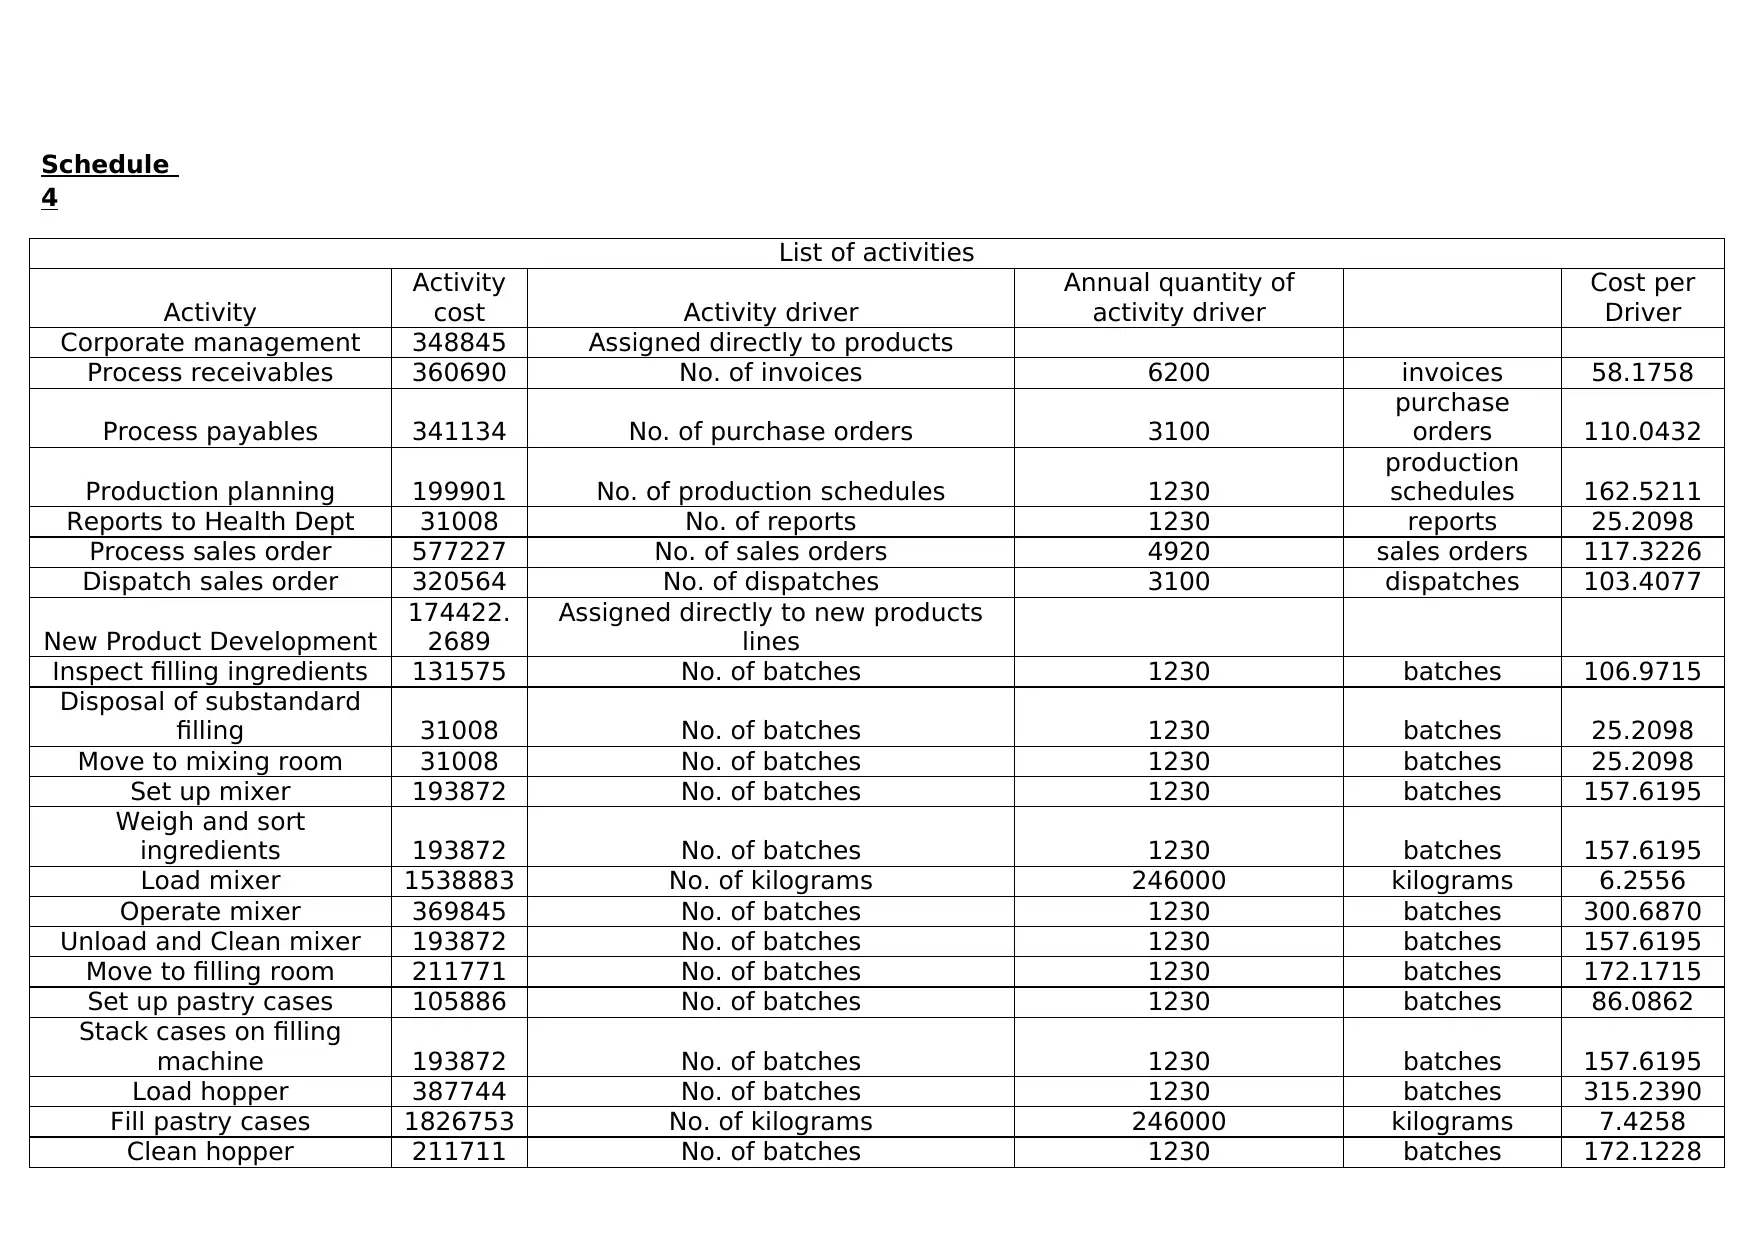
Schedule
4
List of activities
Activity
Activity
cost Activity driver
Annual quantity of
activity driver
Cost per
Driver
Corporate management 348845 Assigned directly to products
Process receivables 360690 No. of invoices 6200 invoices 58.1758
Process payables 341134 No. of purchase orders 3100
purchase
orders 110.0432
Production planning 199901 No. of production schedules 1230
production
schedules 162.5211
Reports to Health Dept 31008 No. of reports 1230 reports 25.2098
Process sales order 577227 No. of sales orders 4920 sales orders 117.3226
Dispatch sales order 320564 No. of dispatches 3100 dispatches 103.4077
New Product Development
174422.
2689
Assigned directly to new products
lines
Inspect filling ingredients 131575 No. of batches 1230 batches 106.9715
Disposal of substandard
filling 31008 No. of batches 1230 batches 25.2098
Move to mixing room 31008 No. of batches 1230 batches 25.2098
Set up mixer 193872 No. of batches 1230 batches 157.6195
Weigh and sort
ingredients 193872 No. of batches 1230 batches 157.6195
Load mixer 1538883 No. of kilograms 246000 kilograms 6.2556
Operate mixer 369845 No. of batches 1230 batches 300.6870
Unload and Clean mixer 193872 No. of batches 1230 batches 157.6195
Move to filling room 211771 No. of batches 1230 batches 172.1715
Set up pastry cases 105886 No. of batches 1230 batches 86.0862
Stack cases on filling
machine 193872 No. of batches 1230 batches 157.6195
Load hopper 387744 No. of batches 1230 batches 315.2390
Fill pastry cases 1826753 No. of kilograms 246000 kilograms 7.4258
Clean hopper 211711 No. of batches 1230 batches 172.1228
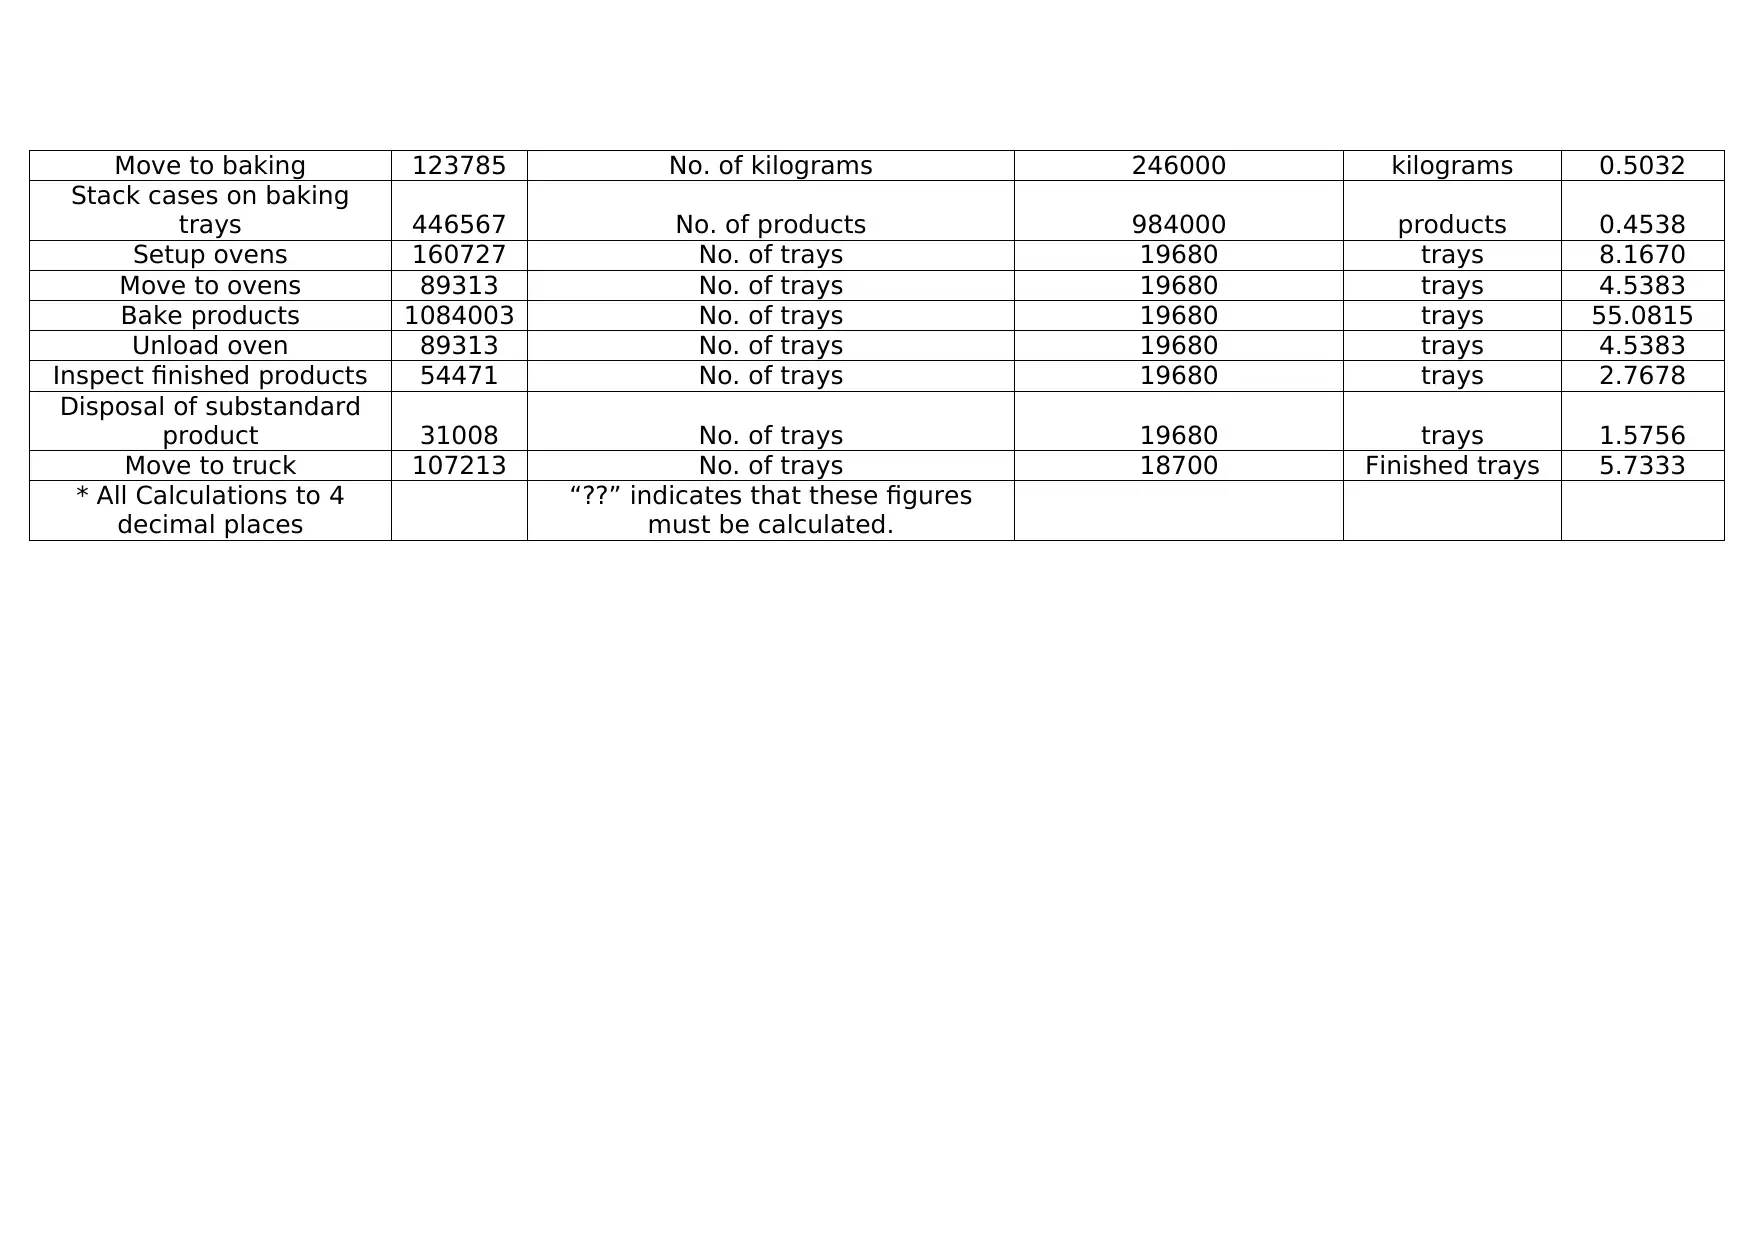
Move to baking 123785 No. of kilograms 246000 kilograms 0.5032
Stack cases on baking
trays 446567 No. of products 984000 products 0.4538
Setup ovens 160727 No. of trays 19680 trays 8.1670
Move to ovens 89313 No. of trays 19680 trays 4.5383
Bake products 1084003 No. of trays 19680 trays 55.0815
Unload oven 89313 No. of trays 19680 trays 4.5383
Inspect finished products 54471 No. of trays 19680 trays 2.7678
Disposal of substandard
product 31008 No. of trays 19680 trays 1.5756
Move to truck 107213 No. of trays 18700 Finished trays 5.7333
* All Calculations to 4
decimal places
“??” indicates that these figures
must be calculated.
Paraphrase This Document
Need a fresh take? Get an instant paraphrase of this document with our AI Paraphraser
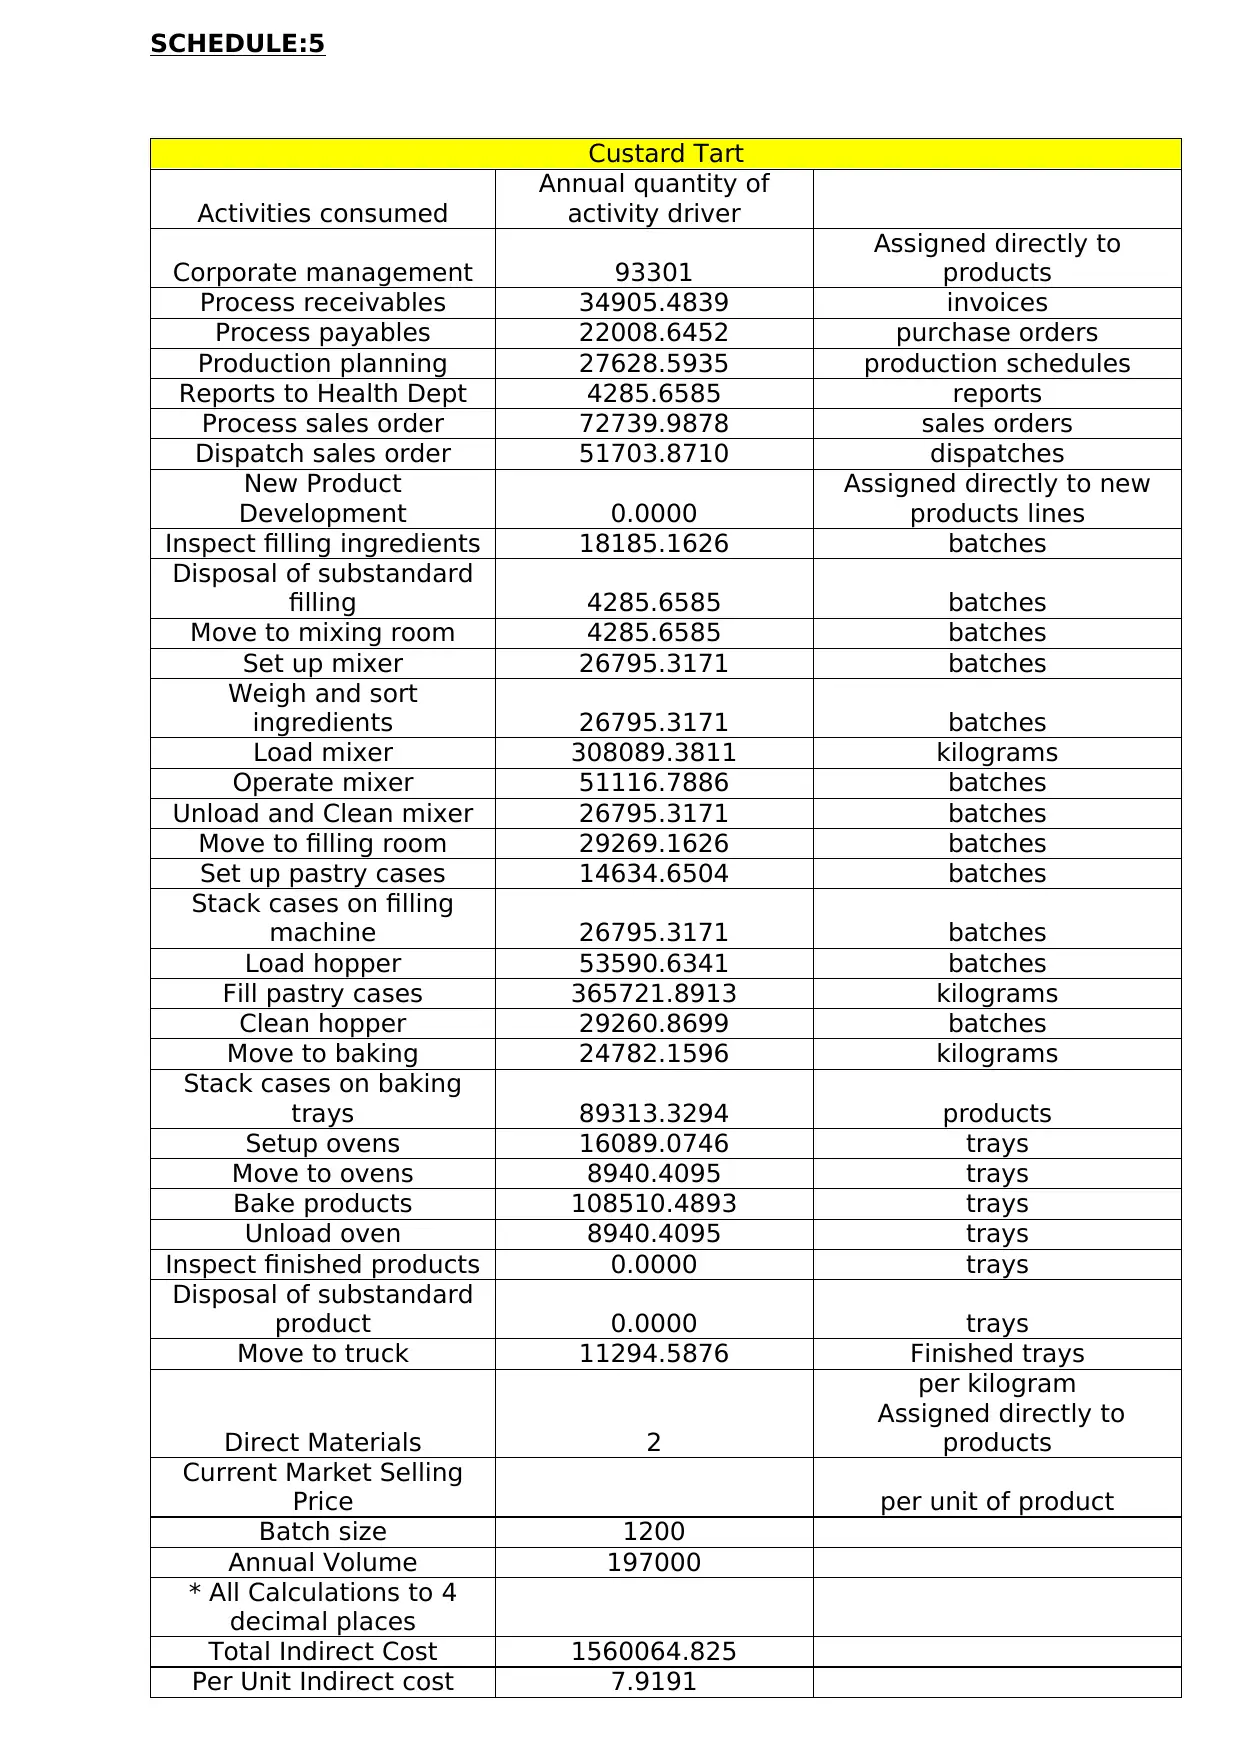
SCHEDULE:5
Custard Tart
Activities consumed
Annual quantity of
activity driver
Corporate management 93301
Assigned directly to
products
Process receivables 34905.4839 invoices
Process payables 22008.6452 purchase orders
Production planning 27628.5935 production schedules
Reports to Health Dept 4285.6585 reports
Process sales order 72739.9878 sales orders
Dispatch sales order 51703.8710 dispatches
New Product
Development 0.0000
Assigned directly to new
products lines
Inspect filling ingredients 18185.1626 batches
Disposal of substandard
filling 4285.6585 batches
Move to mixing room 4285.6585 batches
Set up mixer 26795.3171 batches
Weigh and sort
ingredients 26795.3171 batches
Load mixer 308089.3811 kilograms
Operate mixer 51116.7886 batches
Unload and Clean mixer 26795.3171 batches
Move to filling room 29269.1626 batches
Set up pastry cases 14634.6504 batches
Stack cases on filling
machine 26795.3171 batches
Load hopper 53590.6341 batches
Fill pastry cases 365721.8913 kilograms
Clean hopper 29260.8699 batches
Move to baking 24782.1596 kilograms
Stack cases on baking
trays 89313.3294 products
Setup ovens 16089.0746 trays
Move to ovens 8940.4095 trays
Bake products 108510.4893 trays
Unload oven 8940.4095 trays
Inspect finished products 0.0000 trays
Disposal of substandard
product 0.0000 trays
Move to truck 11294.5876 Finished trays
Direct Materials 2
per kilogram
Assigned directly to
products
Current Market Selling
Price per unit of product
Batch size 1200
Annual Volume 197000
* All Calculations to 4
decimal places
Total Indirect Cost 1560064.825
Per Unit Indirect cost 7.9191
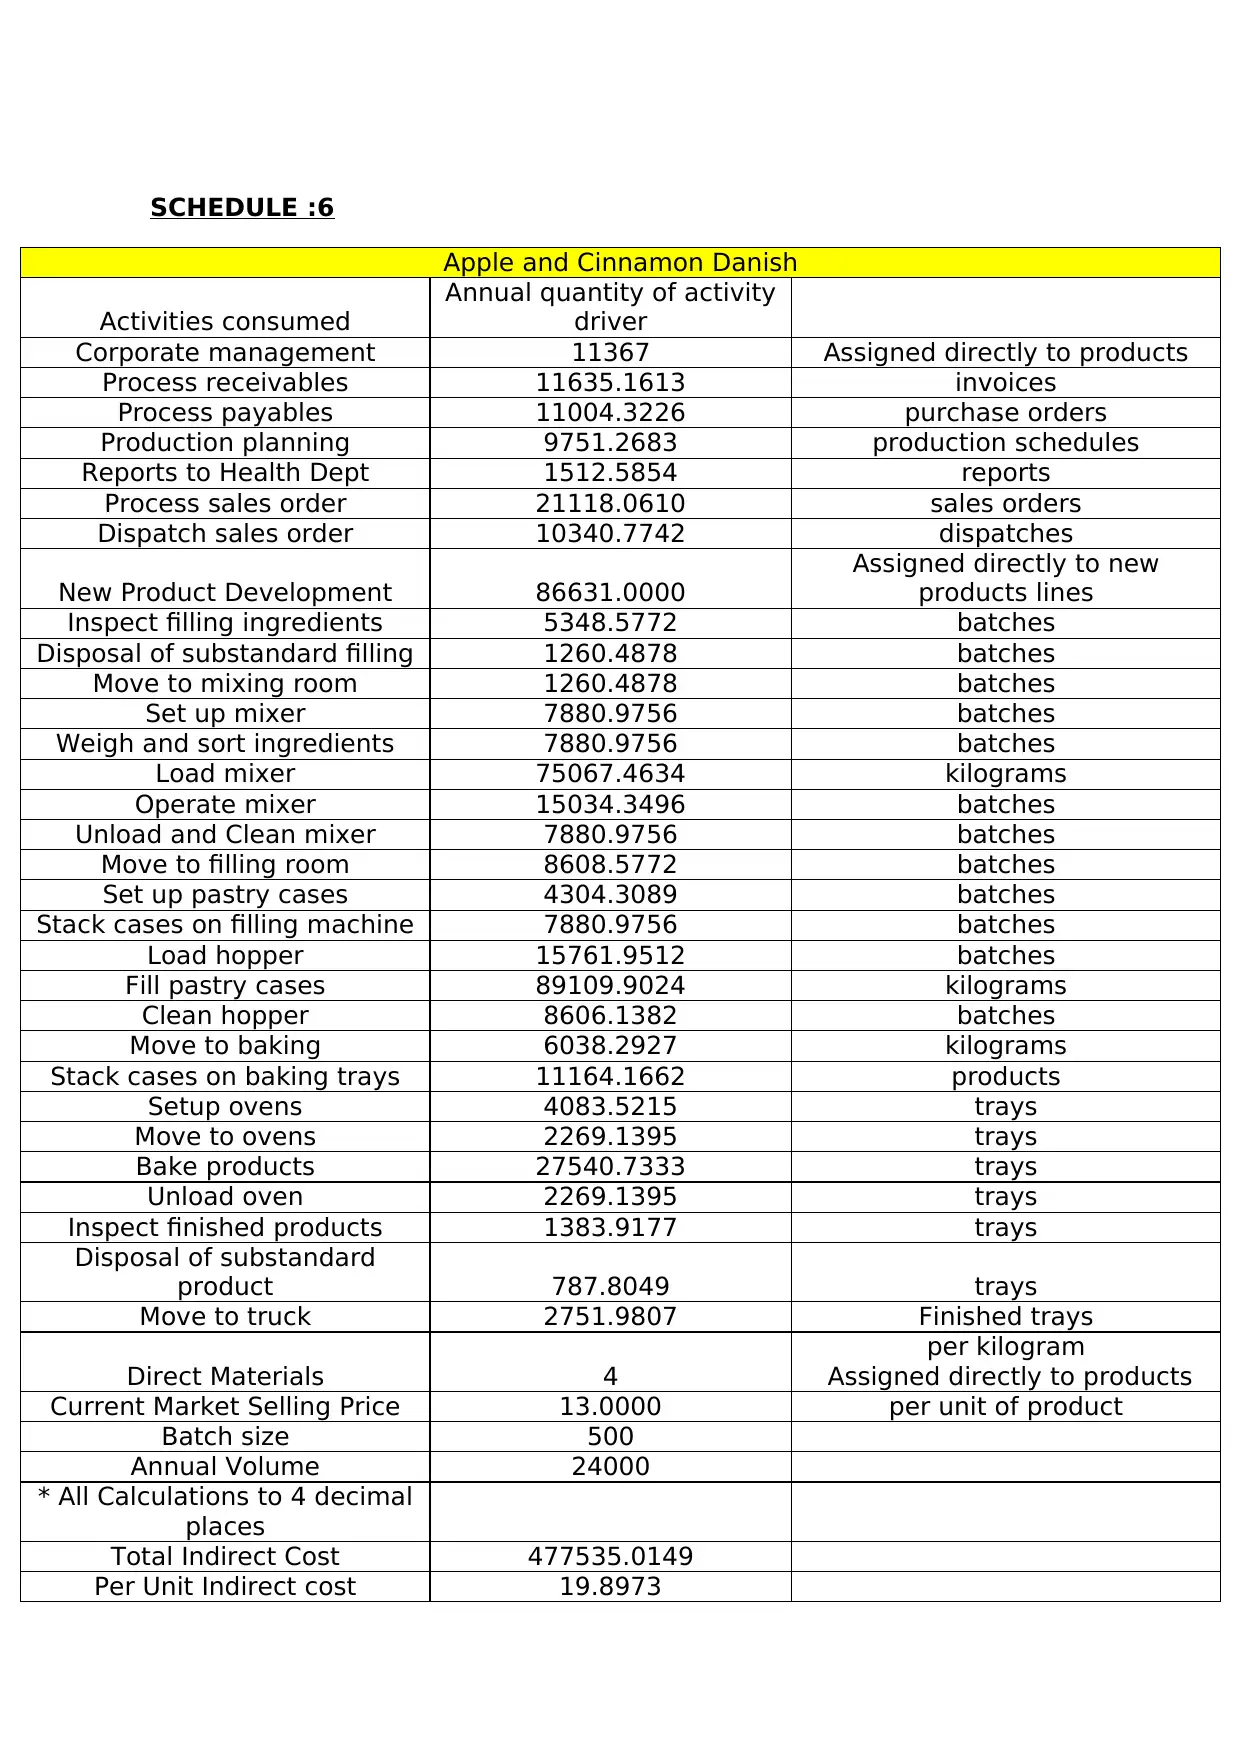
SCHEDULE :6
Apple and Cinnamon Danish
Activities consumed
Annual quantity of activity
driver
Corporate management 11367 Assigned directly to products
Process receivables 11635.1613 invoices
Process payables 11004.3226 purchase orders
Production planning 9751.2683 production schedules
Reports to Health Dept 1512.5854 reports
Process sales order 21118.0610 sales orders
Dispatch sales order 10340.7742 dispatches
New Product Development 86631.0000
Assigned directly to new
products lines
Inspect filling ingredients 5348.5772 batches
Disposal of substandard filling 1260.4878 batches
Move to mixing room 1260.4878 batches
Set up mixer 7880.9756 batches
Weigh and sort ingredients 7880.9756 batches
Load mixer 75067.4634 kilograms
Operate mixer 15034.3496 batches
Unload and Clean mixer 7880.9756 batches
Move to filling room 8608.5772 batches
Set up pastry cases 4304.3089 batches
Stack cases on filling machine 7880.9756 batches
Load hopper 15761.9512 batches
Fill pastry cases 89109.9024 kilograms
Clean hopper 8606.1382 batches
Move to baking 6038.2927 kilograms
Stack cases on baking trays 11164.1662 products
Setup ovens 4083.5215 trays
Move to ovens 2269.1395 trays
Bake products 27540.7333 trays
Unload oven 2269.1395 trays
Inspect finished products 1383.9177 trays
Disposal of substandard
product 787.8049 trays
Move to truck 2751.9807 Finished trays
Direct Materials 4
per kilogram
Assigned directly to products
Current Market Selling Price 13.0000 per unit of product
Batch size 500
Annual Volume 24000
* All Calculations to 4 decimal
places
Total Indirect Cost 477535.0149
Per Unit Indirect cost 19.8973
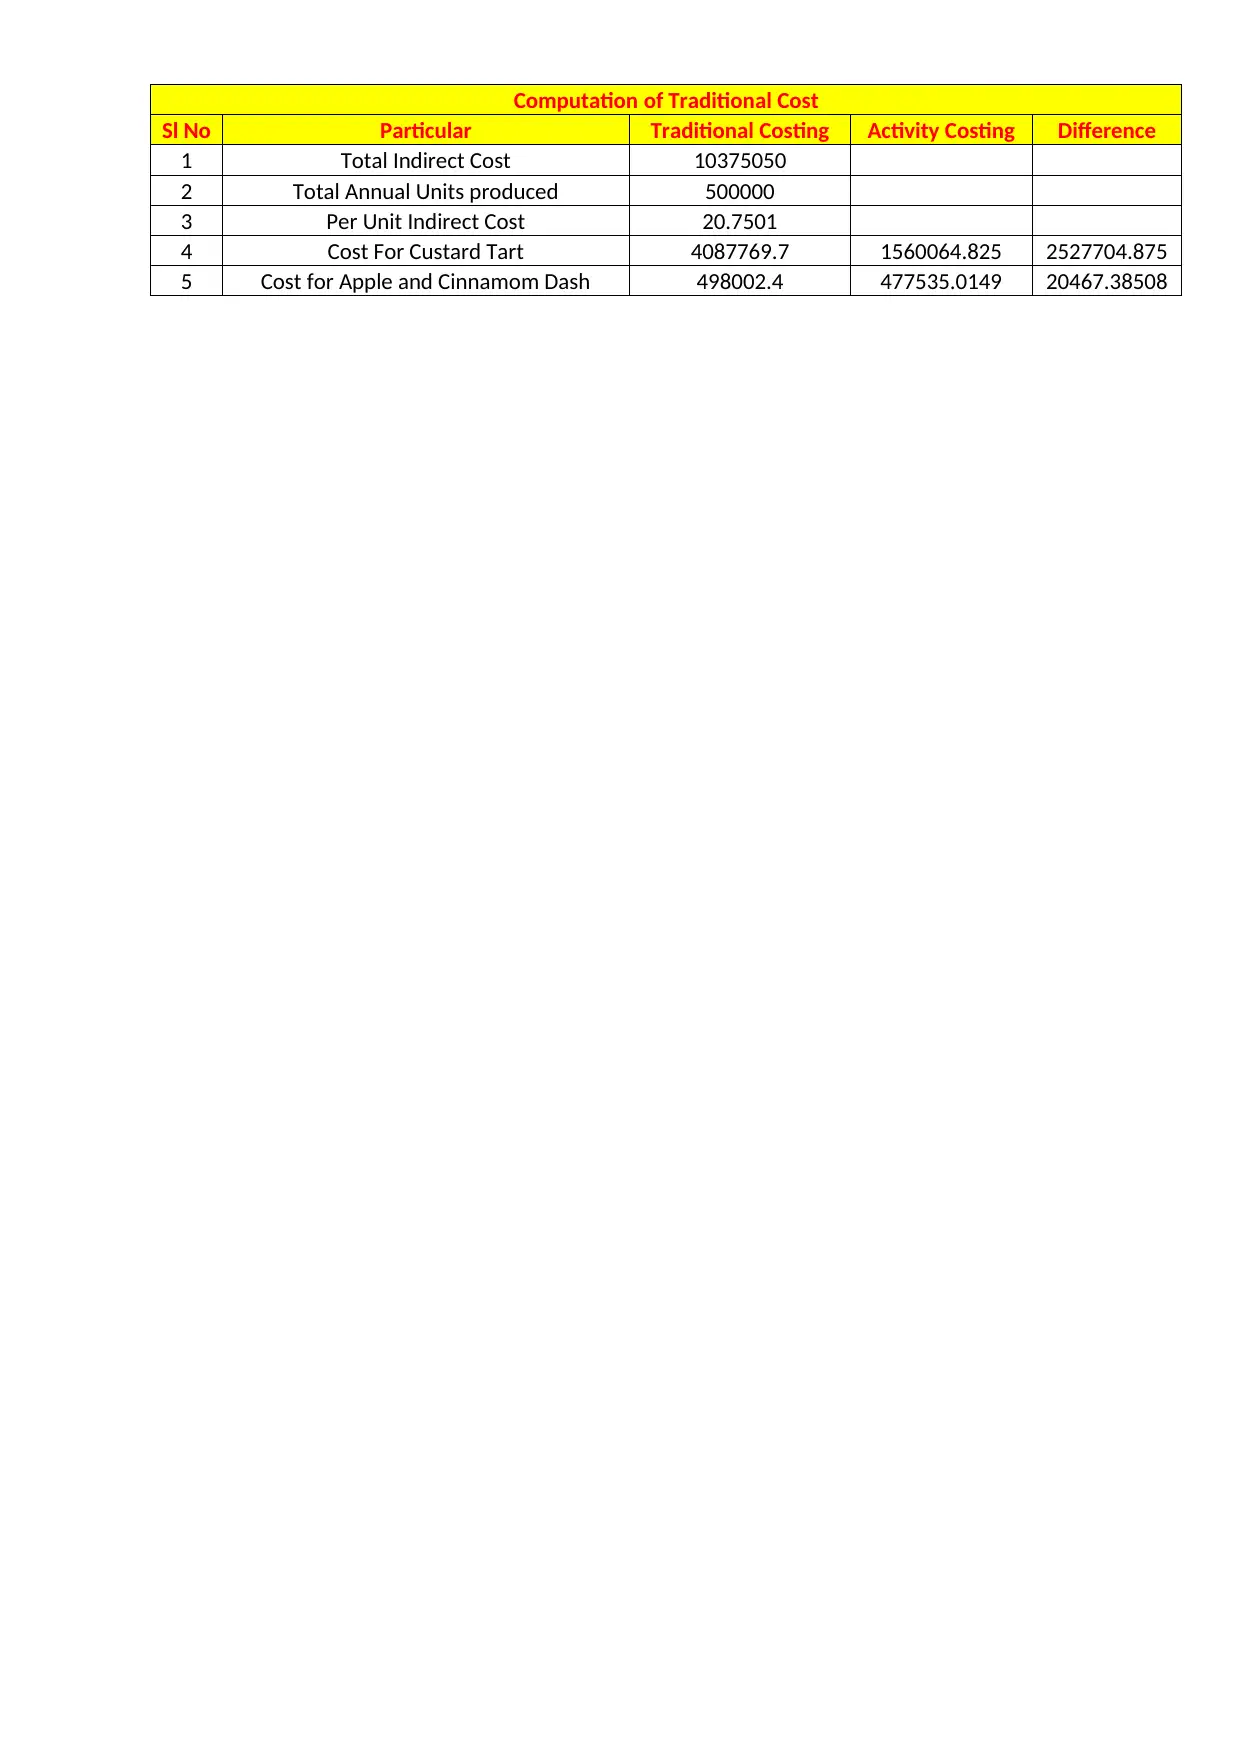
Computation of Traditional Cost
Sl No Particular Traditional Costing Activity Costing Difference
1 Total Indirect Cost 10375050
2 Total Annual Units produced 500000
3 Per Unit Indirect Cost 20.7501
4 Cost For Custard Tart 4087769.7 1560064.825 2527704.875
5 Cost for Apple and Cinnamom Dash 498002.4 477535.0149 20467.38508
Sl No Particular Traditional Costing Activity Costing Difference
1 Total Indirect Cost 10375050
2 Total Annual Units produced 500000
3 Per Unit Indirect Cost 20.7501
4 Cost For Custard Tart 4087769.7 1560064.825 2527704.875
5 Cost for Apple and Cinnamom Dash 498002.4 477535.0149 20467.38508
Secure Best Marks with AI Grader
Need help grading? Try our AI Grader for instant feedback on your assignments.
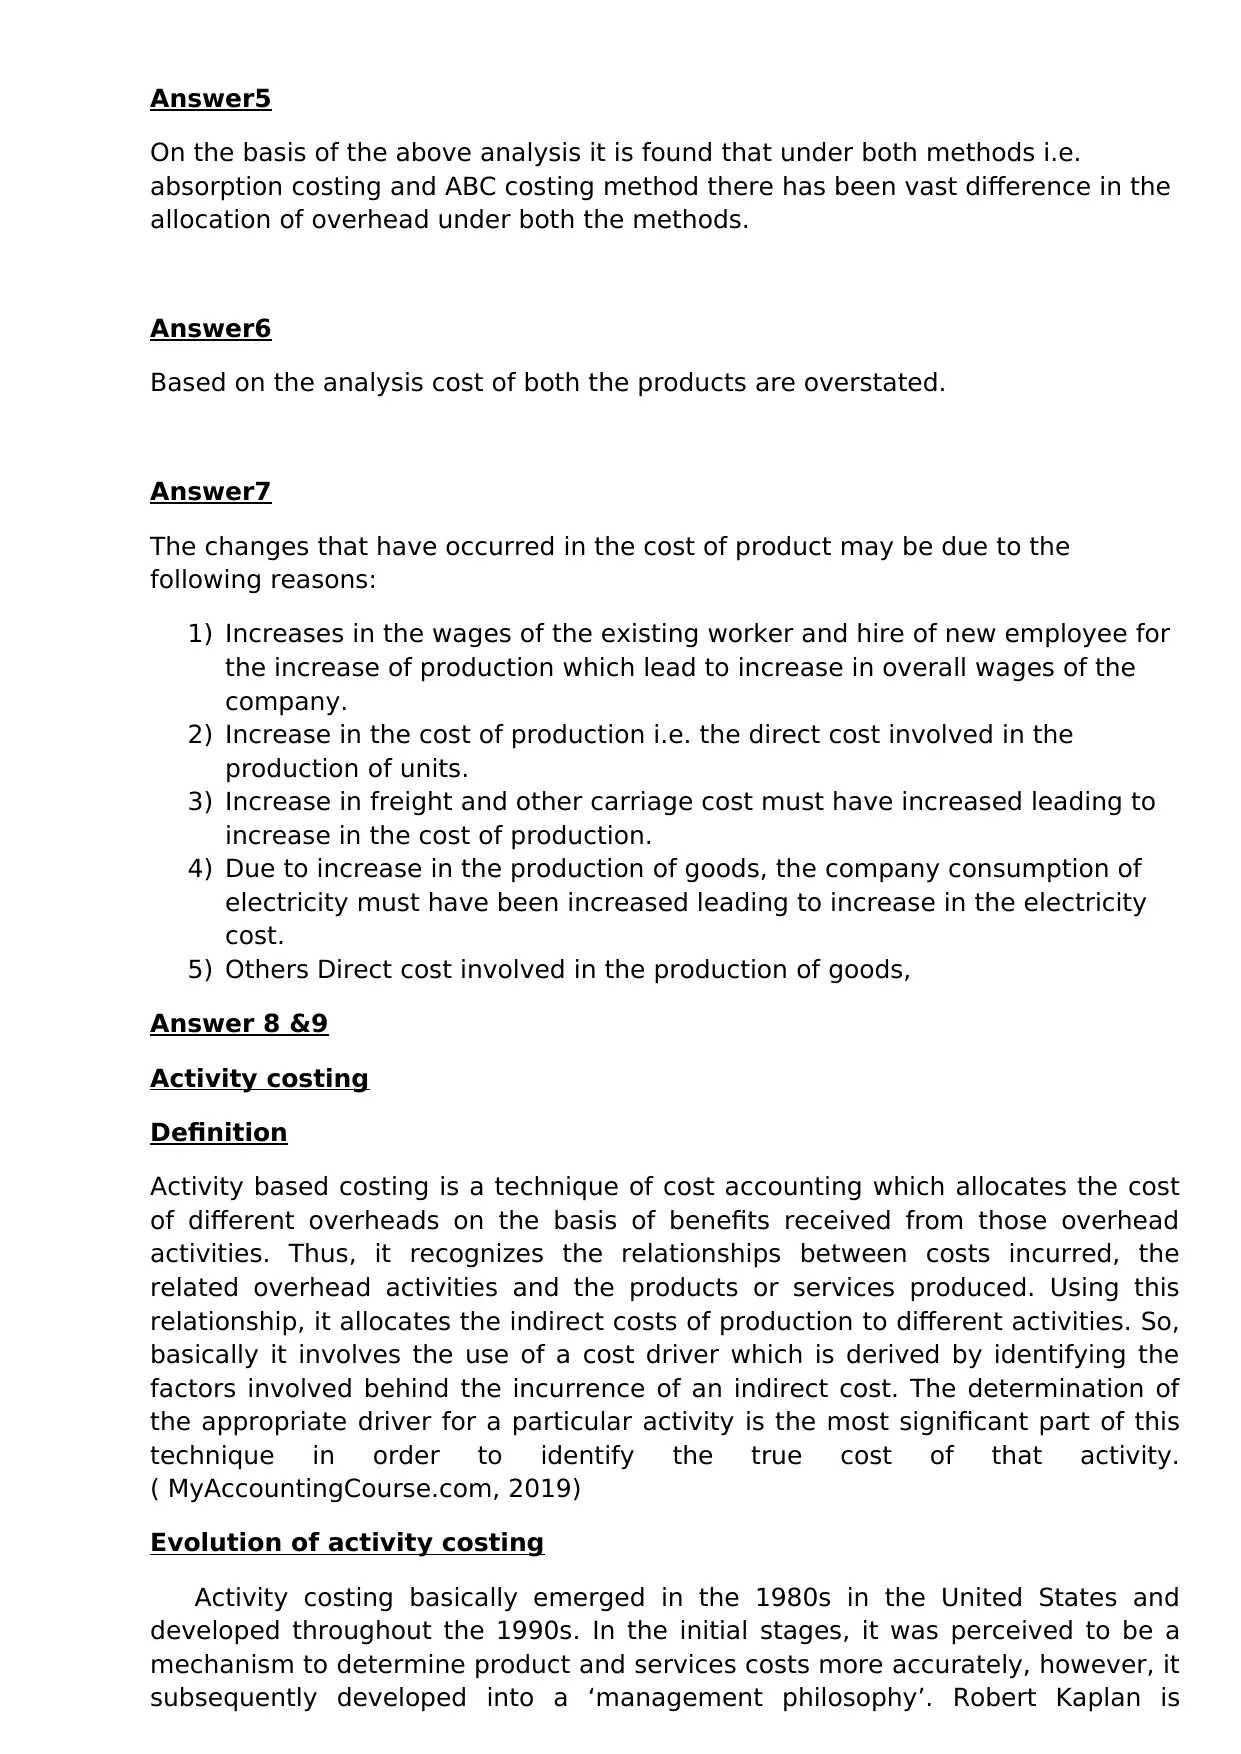
Answer5
On the basis of the above analysis it is found that under both methods i.e.
absorption costing and ABC costing method there has been vast difference in the
allocation of overhead under both the methods.
Answer6
Based on the analysis cost of both the products are overstated.
Answer7
The changes that have occurred in the cost of product may be due to the
following reasons:
1) Increases in the wages of the existing worker and hire of new employee for
the increase of production which lead to increase in overall wages of the
company.
2) Increase in the cost of production i.e. the direct cost involved in the
production of units.
3) Increase in freight and other carriage cost must have increased leading to
increase in the cost of production.
4) Due to increase in the production of goods, the company consumption of
electricity must have been increased leading to increase in the electricity
cost.
5) Others Direct cost involved in the production of goods,
Answer 8 &9
Activity costing
Definition
Activity based costing is a technique of cost accounting which allocates the cost
of different overheads on the basis of benefits received from those overhead
activities. Thus, it recognizes the relationships between costs incurred, the
related overhead activities and the products or services produced. Using this
relationship, it allocates the indirect costs of production to different activities. So,
basically it involves the use of a cost driver which is derived by identifying the
factors involved behind the incurrence of an indirect cost. The determination of
the appropriate driver for a particular activity is the most significant part of this
technique in order to identify the true cost of that activity.
( MyAccountingCourse.com, 2019)
Evolution of activity costing
Activity costing basically emerged in the 1980s in the United States and
developed throughout the 1990s. In the initial stages, it was perceived to be a
mechanism to determine product and services costs more accurately, however, it
subsequently developed into a ‘management philosophy’. Robert Kaplan is
basically regarded as the father of activity-based costing. Then the period from
1980 to 1985 saw the ad-hoc implementation of activity costing. After this period,
it was recognised that this type of costing provides strategic insights and can be
used as a decision-making tool. With the emergence of database technology, it
became more practical. Research work continued in order to make the technique
more refined to identify the cost accurately. Recently, the Time-driven costing
introduced by Anderson and Kaplan provided a simplification of the costing
model. (Gosselin, 2013)
Advantages
1. Improves the understanding of the overheads and their drivers, thus, bringing the
expensive and non- value adding activities to the management’s focus.
(Association of International Certified Professional Accountants, 2019)
2. Activity based costing (ABC) provides a support base for performance
management techniques like continuous improvement and scorecards.
3. By identifying that activities are responsible for the incurrence of indirect costs
rather than the product or service itself, it helps to understand the cost behaviour
and implement effective cost control.
4. It helps in identifying the unutilised production and estimate the future resource
requirements through its pooling of activity costs and related comparison.
(Association of International Certified Professional Accountants, 2019)
Disadvantages
1. It is much more complex than absorption costing as it involves analysis of
numerous activities to identify the cost drivers. (Association of International
Certified Professional Accountants, 2019)
2. The selection of the appropriate is the most vital and the most challenging part of
this costing technique due to the involvement of multiple factors each selection.
3. It is not suitable for firms depending on the market prices for setting the prices of
their products because in their case cost plus pricing carries no significance.
4. The implementation of ABC system requires a lot of complex calculations which is
both costly as well as time consuming.
Absorption Costing
Definition
Absorption costing is a technique of cost and management accounting which
allocates each and every cost incurred on the products manufactured, whether or
not they are sold. The direct costs are recognised as a base for allocation of
indirect costs. Thus, it is also called full costing. It is a recognised method for
external reporting. It provides a mechanism for accumulating the costs incurred
in the production process and allocating them to individual products. Basically,
Direct Materials, Direct labour are used for deriving the rates for apportionment.
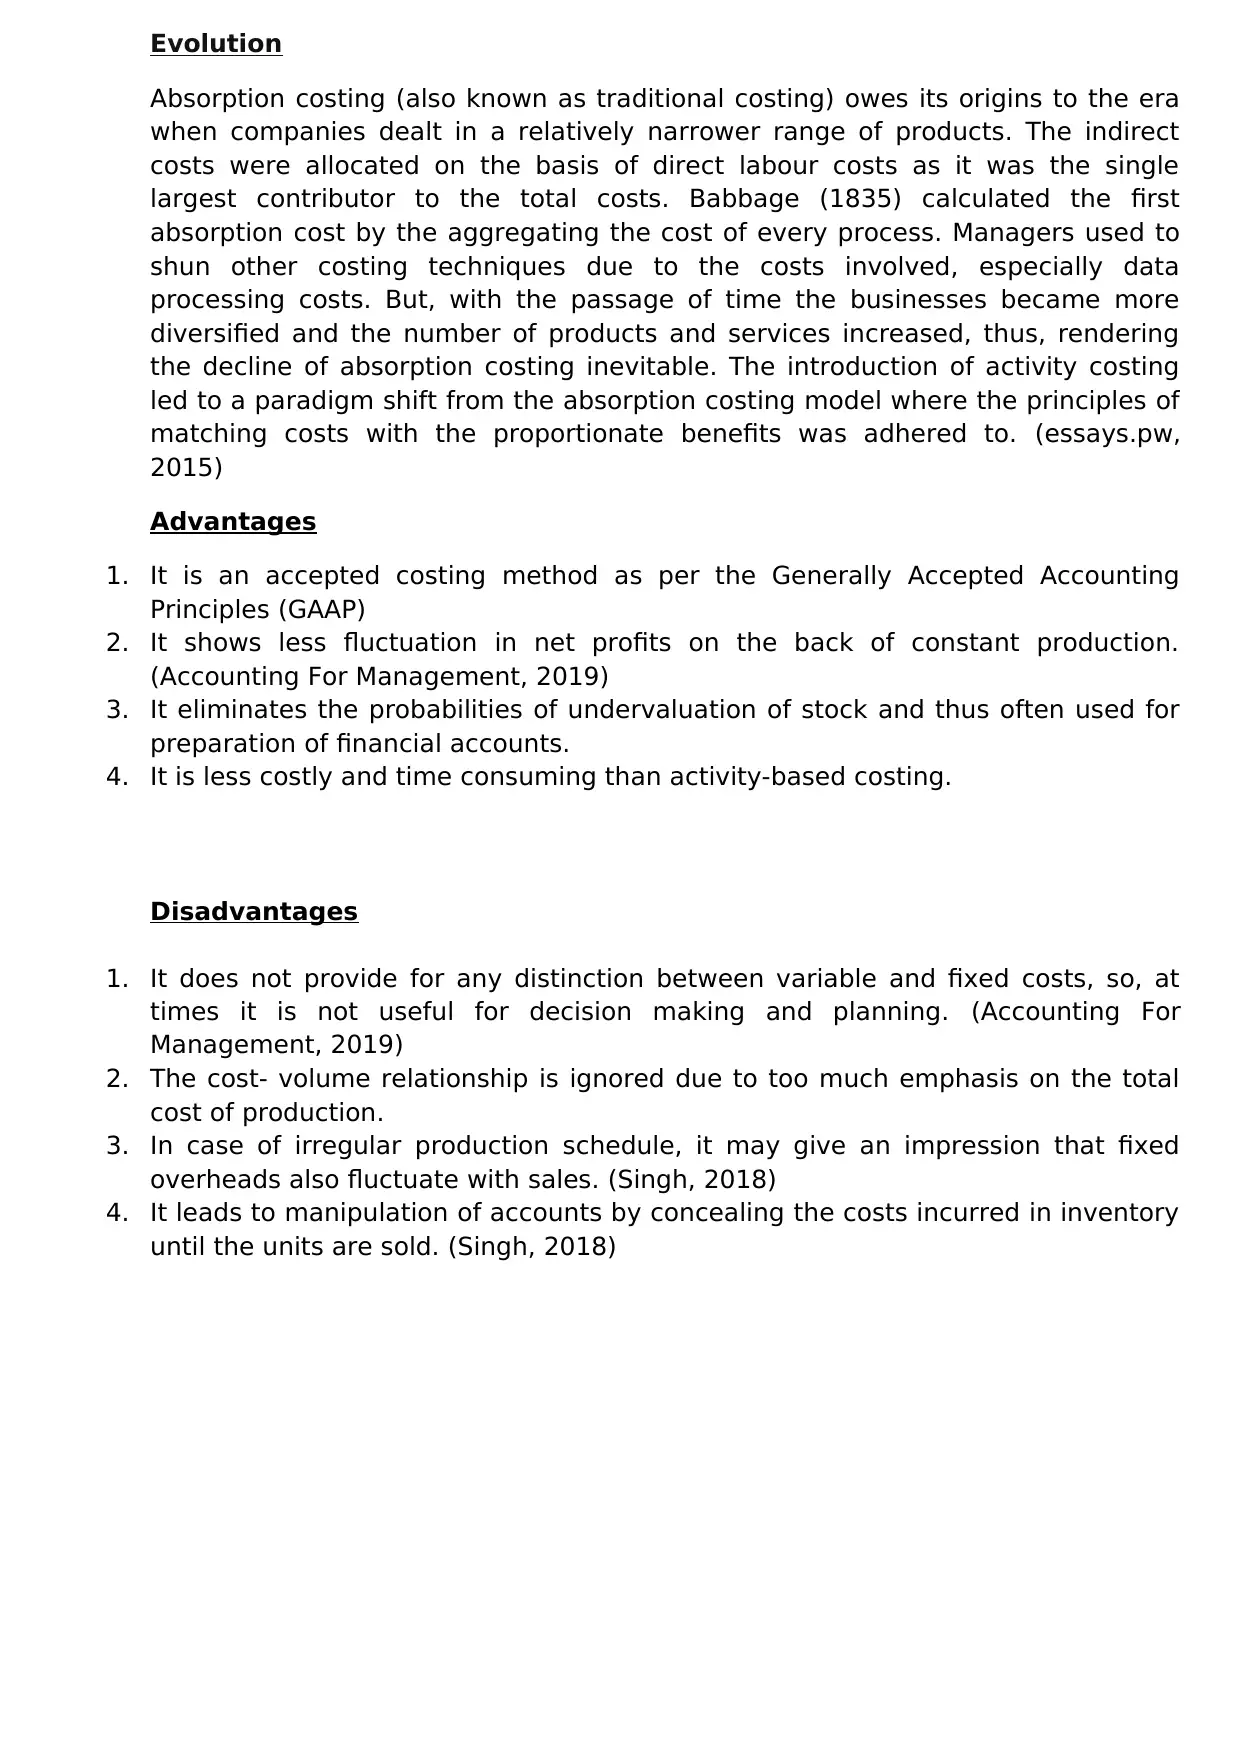
Evolution
Absorption costing (also known as traditional costing) owes its origins to the era
when companies dealt in a relatively narrower range of products. The indirect
costs were allocated on the basis of direct labour costs as it was the single
largest contributor to the total costs. Babbage (1835) calculated the first
absorption cost by the aggregating the cost of every process. Managers used to
shun other costing techniques due to the costs involved, especially data
processing costs. But, with the passage of time the businesses became more
diversified and the number of products and services increased, thus, rendering
the decline of absorption costing inevitable. The introduction of activity costing
led to a paradigm shift from the absorption costing model where the principles of
matching costs with the proportionate benefits was adhered to. (essays.pw,
2015)
Advantages
1. It is an accepted costing method as per the Generally Accepted Accounting
Principles (GAAP)
2. It shows less fluctuation in net profits on the back of constant production.
(Accounting For Management, 2019)
3. It eliminates the probabilities of undervaluation of stock and thus often used for
preparation of financial accounts.
4. It is less costly and time consuming than activity-based costing.
Disadvantages
1. It does not provide for any distinction between variable and fixed costs, so, at
times it is not useful for decision making and planning. (Accounting For
Management, 2019)
2. The cost- volume relationship is ignored due to too much emphasis on the total
cost of production.
3. In case of irregular production schedule, it may give an impression that fixed
overheads also fluctuate with sales. (Singh, 2018)
4. It leads to manipulation of accounts by concealing the costs incurred in inventory
until the units are sold. (Singh, 2018)
Paraphrase This Document
Need a fresh take? Get an instant paraphrase of this document with our AI Paraphraser
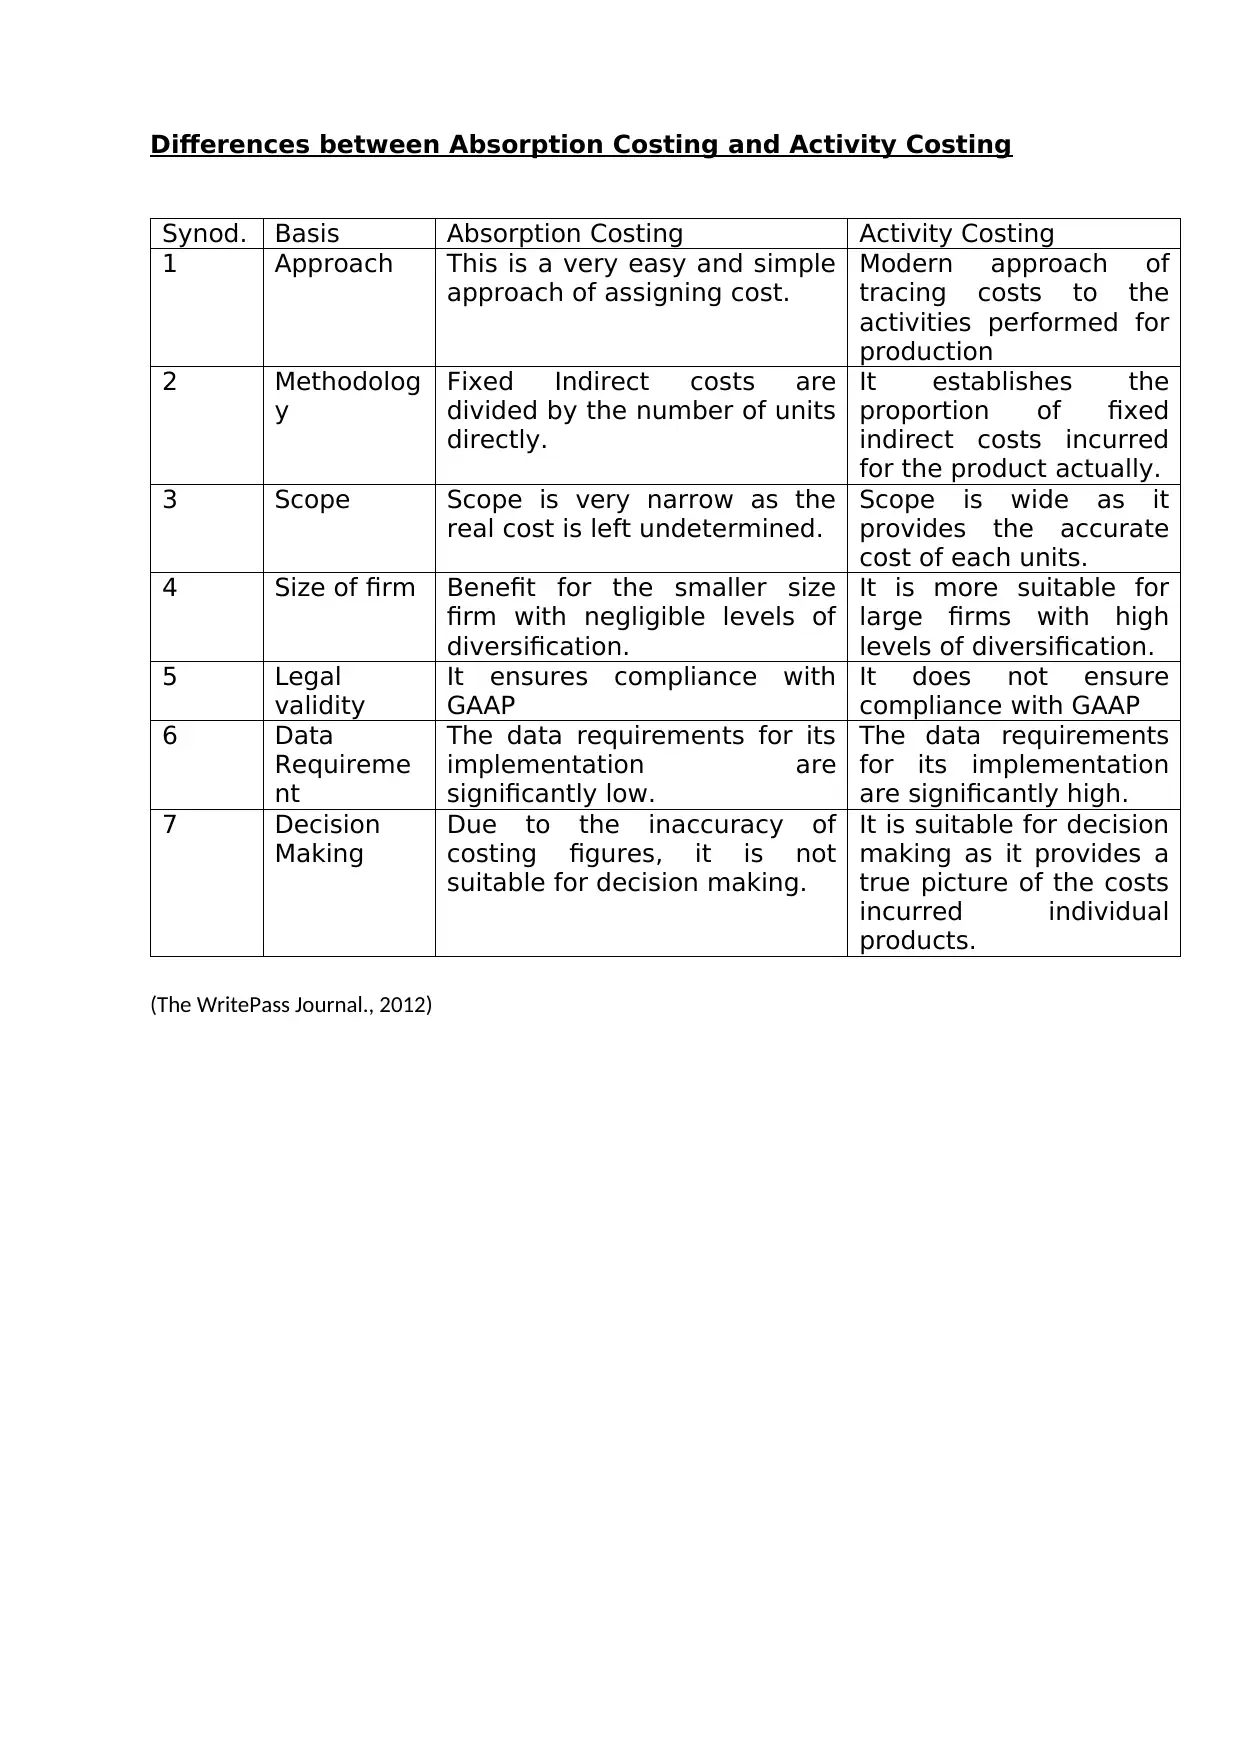
Differences between Absorption Costing and Activity Costing
Synod. Basis Absorption Costing Activity Costing
1 Approach This is a very easy and simple
approach of assigning cost.
Modern approach of
tracing costs to the
activities performed for
production
2 Methodolog
y
Fixed Indirect costs are
divided by the number of units
directly.
It establishes the
proportion of fixed
indirect costs incurred
for the product actually.
3 Scope Scope is very narrow as the
real cost is left undetermined.
Scope is wide as it
provides the accurate
cost of each units.
4 Size of firm Benefit for the smaller size
firm with negligible levels of
diversification.
It is more suitable for
large firms with high
levels of diversification.
5 Legal
validity
It ensures compliance with
GAAP
It does not ensure
compliance with GAAP
6 Data
Requireme
nt
The data requirements for its
implementation are
significantly low.
The data requirements
for its implementation
are significantly high.
7 Decision
Making
Due to the inaccuracy of
costing figures, it is not
suitable for decision making.
It is suitable for decision
making as it provides a
true picture of the costs
incurred individual
products.
(The WritePass Journal., 2012)
References
MyAccountingCourse.com, 2019. What is Activity Based Costing (ABC)?. [Online]
Available at: https://www.myaccountingcourse.com/accounting-dictionary/activity-based-costing
[Accessed 19 May 2019].
Accounting For Management, 2019. Advantages and disadvantages of absorption costing. [Online]
Available at: https://www.accountingformanagement.org/advantages-and-disadvantages-of-absorption-
costing/
[Accessed 19 May 2019].
Association of International Certified Professional Accountants, 2019. Activity Based Costing. [Online]
Available at: https://www.cgma.org/resources/tools/essential-tools/activity-based-costing.html
[Accessed 19 May 2019].
essays.pw, 2015. THE HISTORY OF ABSORPTION COSTING ACCOUNTING ESSAY. [Online]
Available at: https://essays.pw/essay/the-history-of-absorption-costing-accounting-essay-8684
[Accessed 19 May 2019].
Gosselin, M., 2013. A Review of Activity-Based Costing: Technique,. [Online]
Available at: https://edisciplinas.usp.br/pluginfile.php/4097711/mod_resource/content/1/Gosselim
%282007%29_A%20Review%20of%20Activity-Based%20Costing.pdf
[Accessed 19 May 2019].
Singh, S., 2018. http://www.accountingnotes.net/cost-accounting/absorption-costing/absorption-costing-
meaning-advantages-and. [Online]
Available at: http://www.accountingnotes.net/cost-accounting/absorption-costing/absorption-costing-
meaning-advantages-and
[Accessed 19 May 2019].
The WritePass Journal., 2012. What are the differences between Absorption costing and ABC. [Online]
Available at: https://writepass.com/journal/2012/12/why-does-the-company-need-either-absorption-costing-
or-abc/
[Accessed 19 May 2019].
1 out of 15
Related Documents


Your All-in-One AI-Powered Toolkit for Academic Success.
+13062052269
info@desklib.com
Available 24*7 on WhatsApp / Email
![[object Object]](/_next/static/media/star-bottom.7253800d.svg)
Unlock your academic potential
© 2024 | Zucol Services PVT LTD | All rights reserved.