Qantas Airline Operations: Revenue, Costs, and Profitability Analysis
VerifiedAdded on 2022/09/26
|19
|3994
|41
Essay
AI Summary
This paper provides an overview of the financial operations of Qantas Airways between 2008 and 2018, focusing on key performance indicators (KPIs), revenue drivers, cost structures, and profitability. It defines KPIs as tools to forecast system performance, highlighting Qantas's use of environmental, financial, social, and governance indicators. The analysis includes the impact of code-sharing agreements, domestic market share trends, and the opening of new international routes. Revenue drivers such as capacity, ancillary revenues, passenger yield, load factor, and cargo are examined, along with the challenges posed by rising fuel prices and labor costs. The paper also compares Cost Per Available Seat Mile (CASM) and Revenue Per Available Seat Mile (RASM) to assess unit profitability and discusses Qantas's financial strategies, including debt reduction and fleet management. The document concludes by referencing Qantas's strategic approach to increase revenue per seat kilometer (RASK) and maintain a strong capital position.
AIRLINE OPERATIONS (1950)
1
Airline operations (1950)
Student’s name
Course coordinator
Course
Institutional affiliation
City and state
Date
1
Airline operations (1950)
Student’s name
Course coordinator
Course
Institutional affiliation
City and state
Date
Paraphrase This Document
Need a fresh take? Get an instant paraphrase of this document with our AI Paraphraser
AIRLINE OPERATIONS (1950)
2
1.0 Introduction
The major aim of this paper is to explain the different financial operations of full-service
network carriers. For this particular paper, Qantas airline will be used as the case of study. This
paper will, therefore, be based upon five sections majorly. These will include Qantas key
performance indicators, Qantas airline revenues, and cost structures. The other two or perhaps
three sections of the paper will cover Qantas airline profitability, world capacity trends and
relevant conclusions as per the discussions. Definitions of key important terms will as well be
provided in this paper. Such definitions will primarily provide a better understanding of the
technical terms used within the paper. The period 2008-2018 will be used as the relevant scope
for the paper.
2.0 Body of the discussion
2.1 Qantas key performance indicators
A key performance indicator can be defined as an approach that is used to characterize
and forecast or predict the performance of any given system on an average level of output. The
key performance indicators are widely used in the airline industry. They are standard indicators
that aid shareholders in assessing and analyzing the performance of different airlines in the
aviation market. They are sub-divided into five categories to include the following: traffic based
indicators, financial indicators, load factor –indicators, productivity and operation based
indictors (Qantas group, 2018).
AIRLINE OPERATIONS (1950)
3
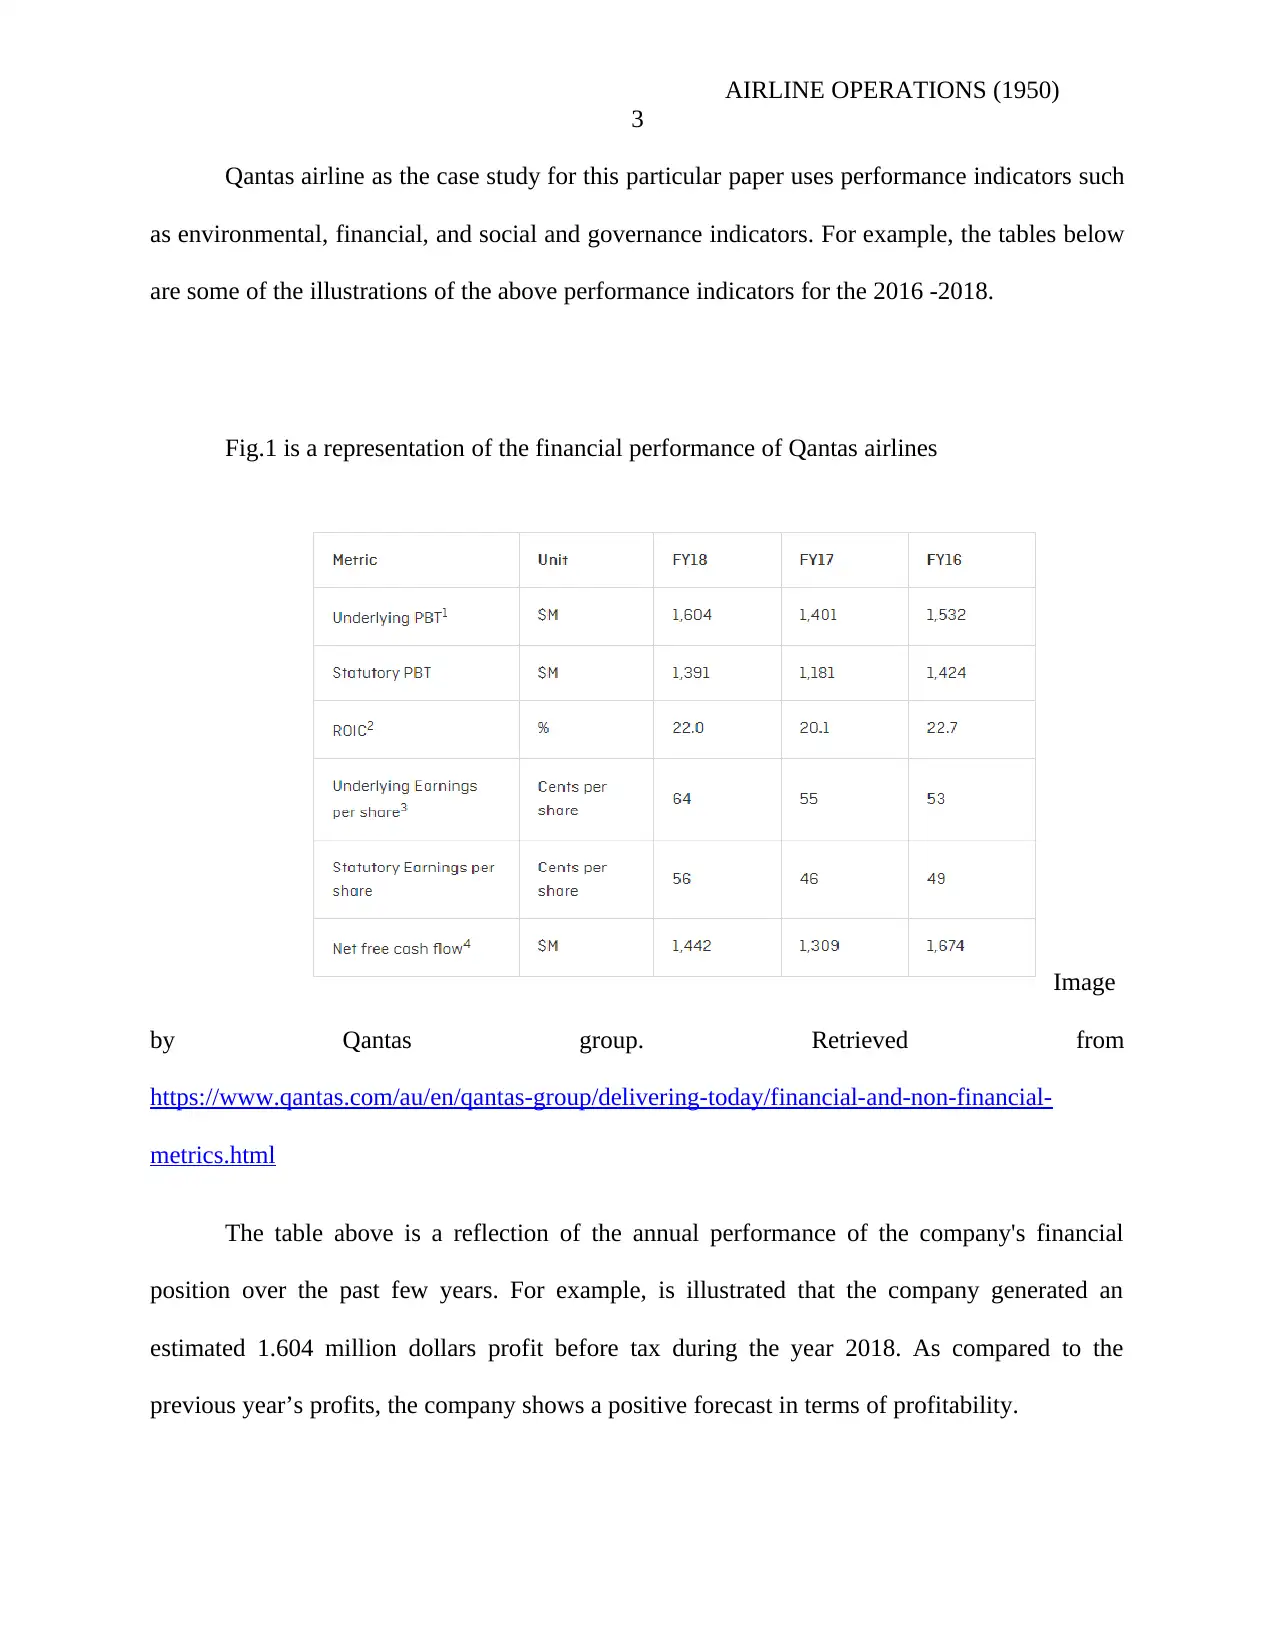
Qantas airline as the case study for this particular paper uses performance indicators such
as environmental, financial, and social and governance indicators. For example, the tables below
are some of the illustrations of the above performance indicators for the 2016 -2018.
Fig.1 is a representation of the financial performance of Qantas airlines
Image
by Qantas group. Retrieved from
https://www.qantas.com/au/en/qantas-group/delivering-today/financial-and-non-financial-
metrics.html
The table above is a reflection of the annual performance of the company's financial
position over the past few years. For example, is illustrated that the company generated an
estimated 1.604 million dollars profit before tax during the year 2018. As compared to the
previous year’s profits, the company shows a positive forecast in terms of profitability.
3
Qantas airline as the case study for this particular paper uses performance indicators such
as environmental, financial, and social and governance indicators. For example, the tables below
are some of the illustrations of the above performance indicators for the 2016 -2018.
Fig.1 is a representation of the financial performance of Qantas airlines
Image
by Qantas group. Retrieved from
https://www.qantas.com/au/en/qantas-group/delivering-today/financial-and-non-financial-
metrics.html
The table above is a reflection of the annual performance of the company's financial
position over the past few years. For example, is illustrated that the company generated an
estimated 1.604 million dollars profit before tax during the year 2018. As compared to the
previous year’s profits, the company shows a positive forecast in terms of profitability.
⊘ This is a preview!⊘
Do you want full access?
Subscribe today to unlock all pages.
Trusted by 1+ million students worldwide
AIRLINE OPERATIONS (1950)
4
Qantas airline has as well utilized code sharing approach as another alternative option in
establishing performance. It is, therefore, one of the bases through the performance of the
company is assessed. Code sharing, on the other hand, is an arrangement through which two or
more airlines share a similar flight (Creedy, 2018). For example, a passenger having a Qantas
flight ticket can rightfully use a different airline to fly to his or her desired destination. Upon this
basis by August 2018, Qantas airline had established well over 28 codeshare agreements with
other airlines. This has been an alternative option to reduce costs such as passenger service costs,
aircraft operating costs among others. With the reduced costs, the company is in a position to
facilitate operational efficiency.
In terms of the domestic market, the company has had a decreasing share of the domestic
market share. It is estimated that over the past ten years Qantas had about 39% market share.
This represented 9% a decline from the previously owned 48% controlled by the company
(Ironside,2017). The company nonetheless remains to be Australia's leading airline. On the
international scene, however, Qantas airline has been opening up new routes with the Sydney-
san Francisco being among. It is due to the creation of such routes that well over 2.9 million
people have travelled between the US and Australia. This has also led to an estimated load factor
of about 76% by the year 2015.
Qantas fleet structure composed of a total number of an estimated 307 total passenger
aircrafts as of June 2018. The fleet structure further included both the domestic and Qantas
international. Among the domestic, the company has the Qantas link and network aviation and
the jet star Asia for Qantas international.
Paraphrase This Document
Need a fresh take? Get an instant paraphrase of this document with our AI Paraphraser
AIRLINE OPERATIONS (1950)
5
Between the 2008-2018 period, Qantas airline has had well over 950 pilots within and
outside Australia (Shepherd,2018). These pilots have been sourced from different flight schools,
general aviation, the military and other commercial airlines. The company has also had full-time
employees from 33670 to 28622. Such figures have had a significant positive contribution to the
company's status in the Australian aviation market.
2.2 Qantas revenue drivers
Like all airline companies, Qantas airline has several revenue drivers. These include
capacity, ancillary revenues and passenger yield. Other revenue drivers available to the company
include load factor and cargo. The company had an estimated 2.5% increase in corporate travel
incomes by the third quarter of the financial year 2018/19. Revenues as per the Available Seat
kilometre have risen by about 5.5% in the last decade. The company load factor has however
been lesser by at least 1.4% from the previous 75.5% record (Reuters,2019). The company’s
RPK (revenue passenger kilometre has been at an average low of 3.7% during the same period.
This measure of demand has also been noted to be falling faster than the contraction in Available
Seat Kilometres. On the other hand, the airline domestic load factors are said to have increased
by 0.4% to an estimated 87.2%. it was as a result of such increments that the company registered
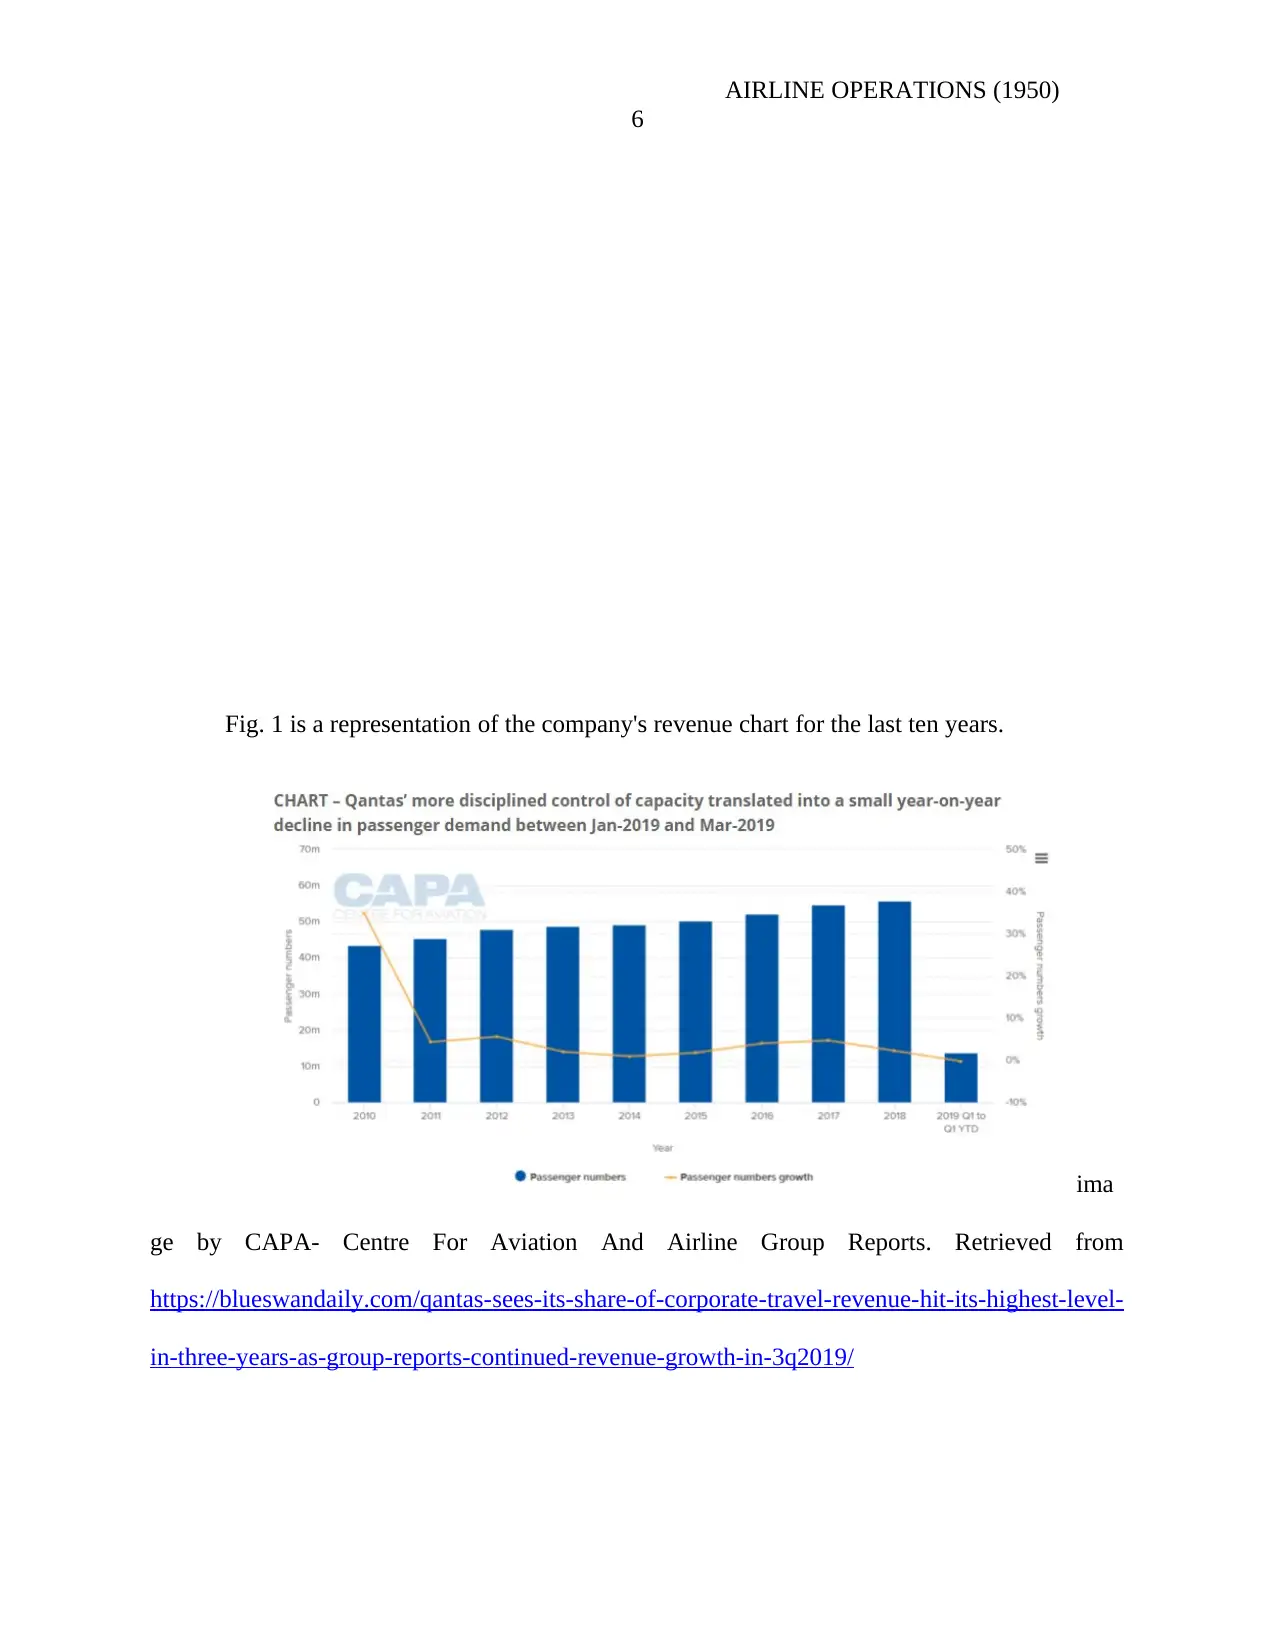
1.1 percentage increases in the overall domestic revenues (the blue swan daily,2018). The figure
below shows a brief forecast of the company's revenues generated form capacity and other
revenue drivers.
5
Between the 2008-2018 period, Qantas airline has had well over 950 pilots within and
outside Australia (Shepherd,2018). These pilots have been sourced from different flight schools,
general aviation, the military and other commercial airlines. The company has also had full-time
employees from 33670 to 28622. Such figures have had a significant positive contribution to the
company's status in the Australian aviation market.
2.2 Qantas revenue drivers
Like all airline companies, Qantas airline has several revenue drivers. These include
capacity, ancillary revenues and passenger yield. Other revenue drivers available to the company
include load factor and cargo. The company had an estimated 2.5% increase in corporate travel
incomes by the third quarter of the financial year 2018/19. Revenues as per the Available Seat
kilometre have risen by about 5.5% in the last decade. The company load factor has however
been lesser by at least 1.4% from the previous 75.5% record (Reuters,2019). The company’s
RPK (revenue passenger kilometre has been at an average low of 3.7% during the same period.
This measure of demand has also been noted to be falling faster than the contraction in Available
Seat Kilometres. On the other hand, the airline domestic load factors are said to have increased
by 0.4% to an estimated 87.2%. it was as a result of such increments that the company registered
1.1 percentage increases in the overall domestic revenues (the blue swan daily,2018). The figure
below shows a brief forecast of the company's revenues generated form capacity and other
revenue drivers.
AIRLINE OPERATIONS (1950)
6
Fig. 1 is a representation of the company's revenue chart for the last ten years.
ima
ge by CAPA- Centre For Aviation And Airline Group Reports. Retrieved from
https://blueswandaily.com/qantas-sees-its-share-of-corporate-travel-revenue-hit-its-highest-level-
in-three-years-as-group-reports-continued-revenue-growth-in-3q2019/
⊘ This is a preview!⊘
Do you want full access?
Subscribe today to unlock all pages.
Trusted by 1+ million students worldwide
AIRLINE OPERATIONS (1950)
7
By cargo and freight, the company reportedly registered and an estimated A$525 net
income by 2017. This increase in net income was recorded to be up by 15%. Such a performance
implies that the freight business registered progressive performance for the company due to high
demand on the global market (air cargo news,2019).
During the year 2013, the company was ranked 5th among the top earners from ancillary
revenues in the world. These reven9ues were generated from activities such as bags, excess
luggage for passengers, upgrades, and fees. For Qantas as a company, its total ancillary revenue
in 2013 was estimated to be at $1.574, 698,320 billion (Godfrey, 2013). Such an amount can be
cut down to about $ 56.21 per individual. However much of this ancillary revenue is said to be
generated by the company's frequent-flier arrangement with its customers. In the domestic
market, capacity ranks as one of the highest revenue drivers. It is by such that the 2018 period
was in the position to record a 1.1 billion dollars from domestic market services. This record
earning, therefore, represents a 25% spike from that of 2017. On the international market,
average load factor ranks as one of the key revenue drivers in the same period. Qantas
international registered an increase in earnings by 7% and an 84% average load factor increment
(the blue swan daily,2018)
Qantas cost structure
Rising fuel prices are one of the major challenges that the company is faced with. A total
of AUD 200 million was spent on fuel in 2018 and it is expected to rise to a sum of AUD 690
million. An estimated 5000 FTEs are likely to be laid off and extended wage freezes in the bid to
reduce labour costs by around $2 billion in 2018 (Australian aviation,2019). The company
drawing plans to withdraw certain aircraft, scrap underperforming flight routes together with
Paraphrase This Document
Need a fresh take? Get an instant paraphrase of this document with our AI Paraphraser
AIRLINE OPERATIONS (1950)
8
bases such as the Avalon maintenance base. Due to such strategic changes, the company share
prices on the market have fallen by about 7% to $1.17 billion. The aircraft changes and
maintenances are aimed at matching capacity to total demand especially on the international
market (Janda, 2018). The company is also opting to hedge against its fuel requirement
requirements by around 76%. This, therefore, brings the total fuel costs to an estimated A$ 4.09
billion for the entire fiscal year from the previously recorded A$3.23 billion. For the domestic
and international markets, fuel prices still rank as the biggest challenge that the company is
subjected to despite the different solutions to overcome the problem.
Step 4. Comparison between RASK or CASK for the unit profitability of Qantas
In airline industry, the Cost Per Available Seat miles (CASM) refers to the measure of the
capacity of passenger carriage (Roberts, J. et al, 2015). It can be obtained from the number of
seats that are available times the number of miles being flown. Furthermore, the available seat
mile is one of the basic unit of production about the passenger carrying airline (Stalnaker et al,
2018). To consider this case, a unit of carriage is always one seat that is available for sale being
flown often by one mile. For instance, the aircraft holding seats (300) that are available for sale
on the flying of 1000miles on statute, they are likely to generate 300,000 available seat miles for
a given flight. On the other hand, Revenue Per Available seat (RASM) involves the four various
but interrelated features of data processing, physical or even mechanical system. The four
characteristics are reliability, availability, serviceability and manageability (Oguntona, 2019).
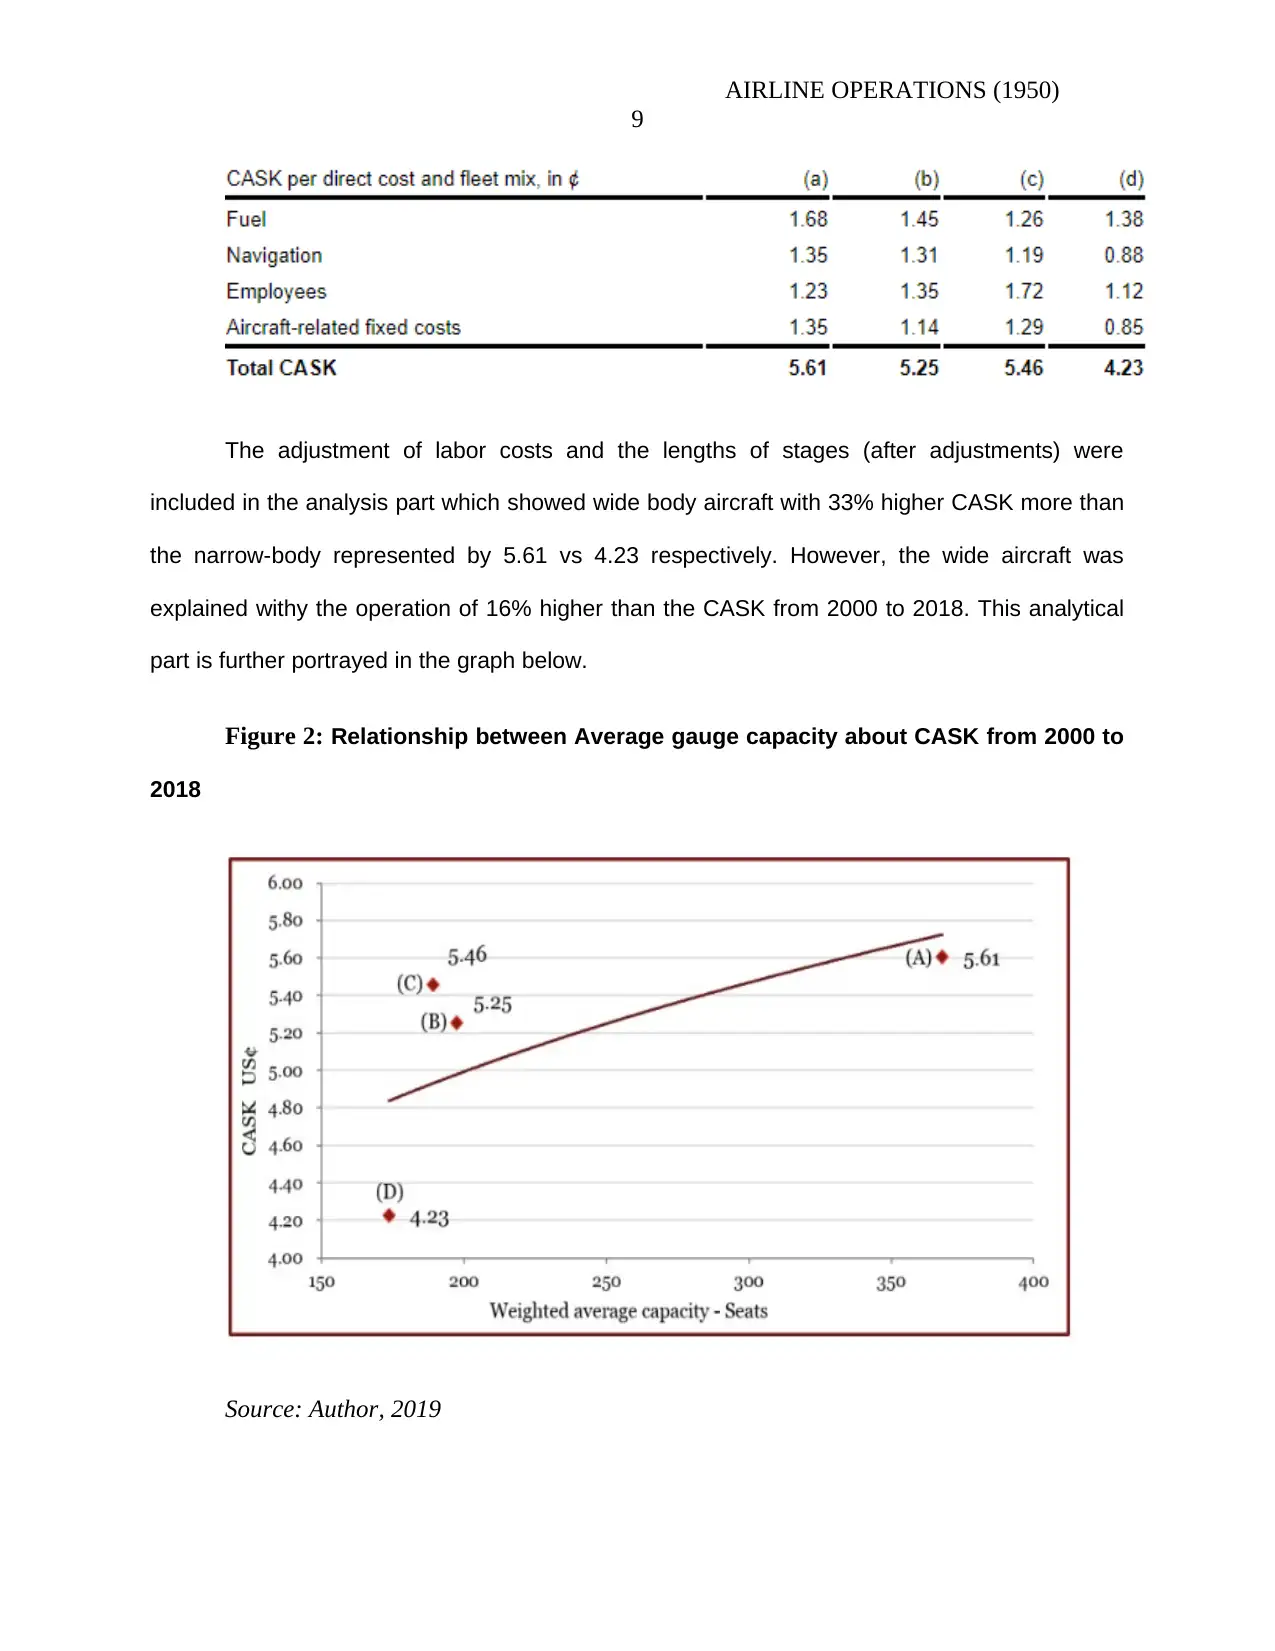
Table 1: CASK per direct cost and fleet mix, in ¢
8
bases such as the Avalon maintenance base. Due to such strategic changes, the company share
prices on the market have fallen by about 7% to $1.17 billion. The aircraft changes and
maintenances are aimed at matching capacity to total demand especially on the international
market (Janda, 2018). The company is also opting to hedge against its fuel requirement
requirements by around 76%. This, therefore, brings the total fuel costs to an estimated A$ 4.09
billion for the entire fiscal year from the previously recorded A$3.23 billion. For the domestic
and international markets, fuel prices still rank as the biggest challenge that the company is
subjected to despite the different solutions to overcome the problem.
Step 4. Comparison between RASK or CASK for the unit profitability of Qantas
In airline industry, the Cost Per Available Seat miles (CASM) refers to the measure of the
capacity of passenger carriage (Roberts, J. et al, 2015). It can be obtained from the number of
seats that are available times the number of miles being flown. Furthermore, the available seat
mile is one of the basic unit of production about the passenger carrying airline (Stalnaker et al,
2018). To consider this case, a unit of carriage is always one seat that is available for sale being
flown often by one mile. For instance, the aircraft holding seats (300) that are available for sale
on the flying of 1000miles on statute, they are likely to generate 300,000 available seat miles for
a given flight. On the other hand, Revenue Per Available seat (RASM) involves the four various
but interrelated features of data processing, physical or even mechanical system. The four
characteristics are reliability, availability, serviceability and manageability (Oguntona, 2019).
Table 1: CASK per direct cost and fleet mix, in ¢
AIRLINE OPERATIONS (1950)
9
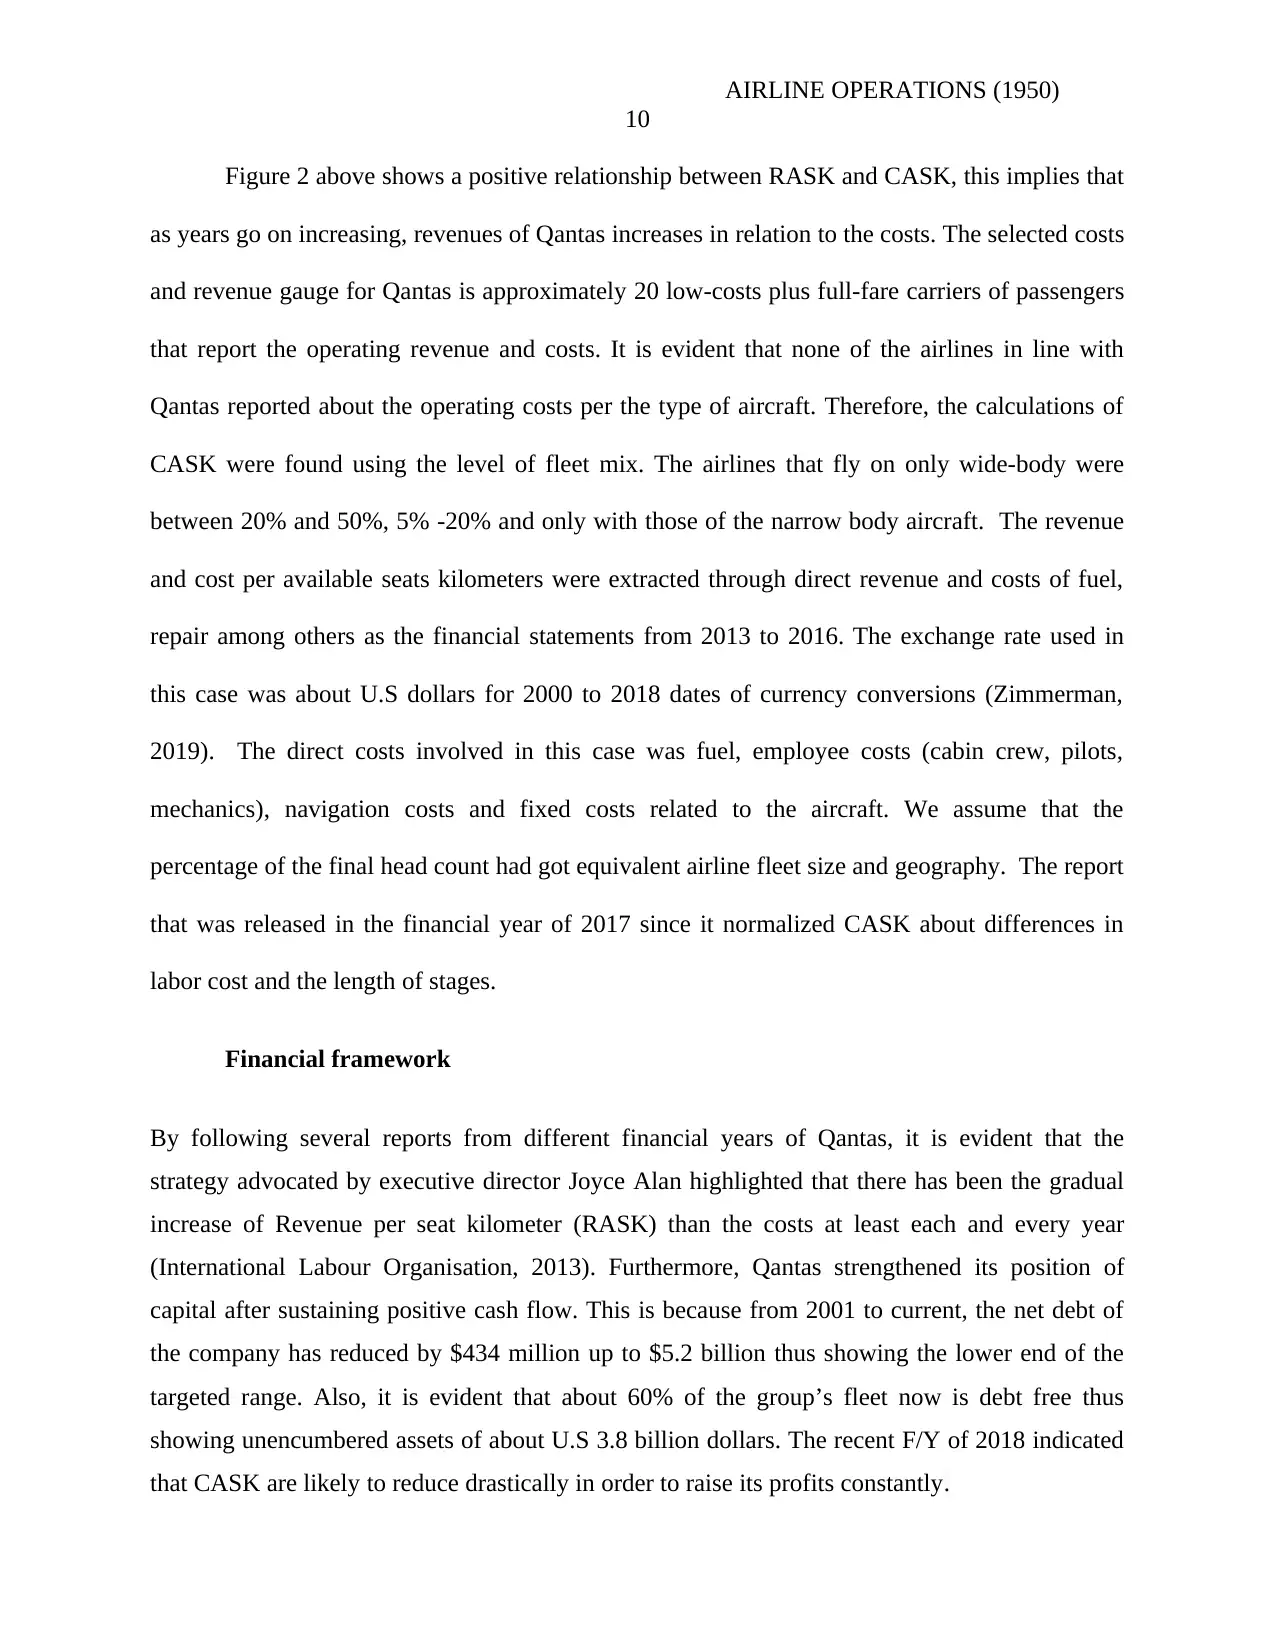
The adjustment of labor costs and the lengths of stages (after adjustments) were
included in the analysis part which showed wide body aircraft with 33% higher CASK more than
the narrow-body represented by 5.61 vs 4.23 respectively. However, the wide aircraft was
explained withy the operation of 16% higher than the CASK from 2000 to 2018. This analytical
part is further portrayed in the graph below.
Figure 2: Relationship between Average gauge capacity about CASK from 2000 to
2018
Source: Author, 2019
9
The adjustment of labor costs and the lengths of stages (after adjustments) were
included in the analysis part which showed wide body aircraft with 33% higher CASK more than
the narrow-body represented by 5.61 vs 4.23 respectively. However, the wide aircraft was
explained withy the operation of 16% higher than the CASK from 2000 to 2018. This analytical
part is further portrayed in the graph below.
Figure 2: Relationship between Average gauge capacity about CASK from 2000 to
2018
Source: Author, 2019
⊘ This is a preview!⊘
Do you want full access?
Subscribe today to unlock all pages.
Trusted by 1+ million students worldwide
AIRLINE OPERATIONS (1950)
10
Figure 2 above shows a positive relationship between RASK and CASK, this implies that
as years go on increasing, revenues of Qantas increases in relation to the costs. The selected costs
and revenue gauge for Qantas is approximately 20 low-costs plus full-fare carriers of passengers
that report the operating revenue and costs. It is evident that none of the airlines in line with
Qantas reported about the operating costs per the type of aircraft. Therefore, the calculations of
CASK were found using the level of fleet mix. The airlines that fly on only wide-body were
between 20% and 50%, 5% -20% and only with those of the narrow body aircraft. The revenue
and cost per available seats kilometers were extracted through direct revenue and costs of fuel,
repair among others as the financial statements from 2013 to 2016. The exchange rate used in
this case was about U.S dollars for 2000 to 2018 dates of currency conversions (Zimmerman,
2019). The direct costs involved in this case was fuel, employee costs (cabin crew, pilots,
mechanics), navigation costs and fixed costs related to the aircraft. We assume that the
percentage of the final head count had got equivalent airline fleet size and geography. The report
that was released in the financial year of 2017 since it normalized CASK about differences in
labor cost and the length of stages.
Financial framework
By following several reports from different financial years of Qantas, it is evident that the
strategy advocated by executive director Joyce Alan highlighted that there has been the gradual
increase of Revenue per seat kilometer (RASK) than the costs at least each and every year
(International Labour Organisation, 2013). Furthermore, Qantas strengthened its position of
capital after sustaining positive cash flow. This is because from 2001 to current, the net debt of
the company has reduced by $434 million up to $5.2 billion thus showing the lower end of the
targeted range. Also, it is evident that about 60% of the group’s fleet now is debt free thus
showing unencumbered assets of about U.S 3.8 billion dollars. The recent F/Y of 2018 indicated
that CASK are likely to reduce drastically in order to raise its profits constantly.
Paraphrase This Document
Need a fresh take? Get an instant paraphrase of this document with our AI Paraphraser
AIRLINE OPERATIONS (1950)
11
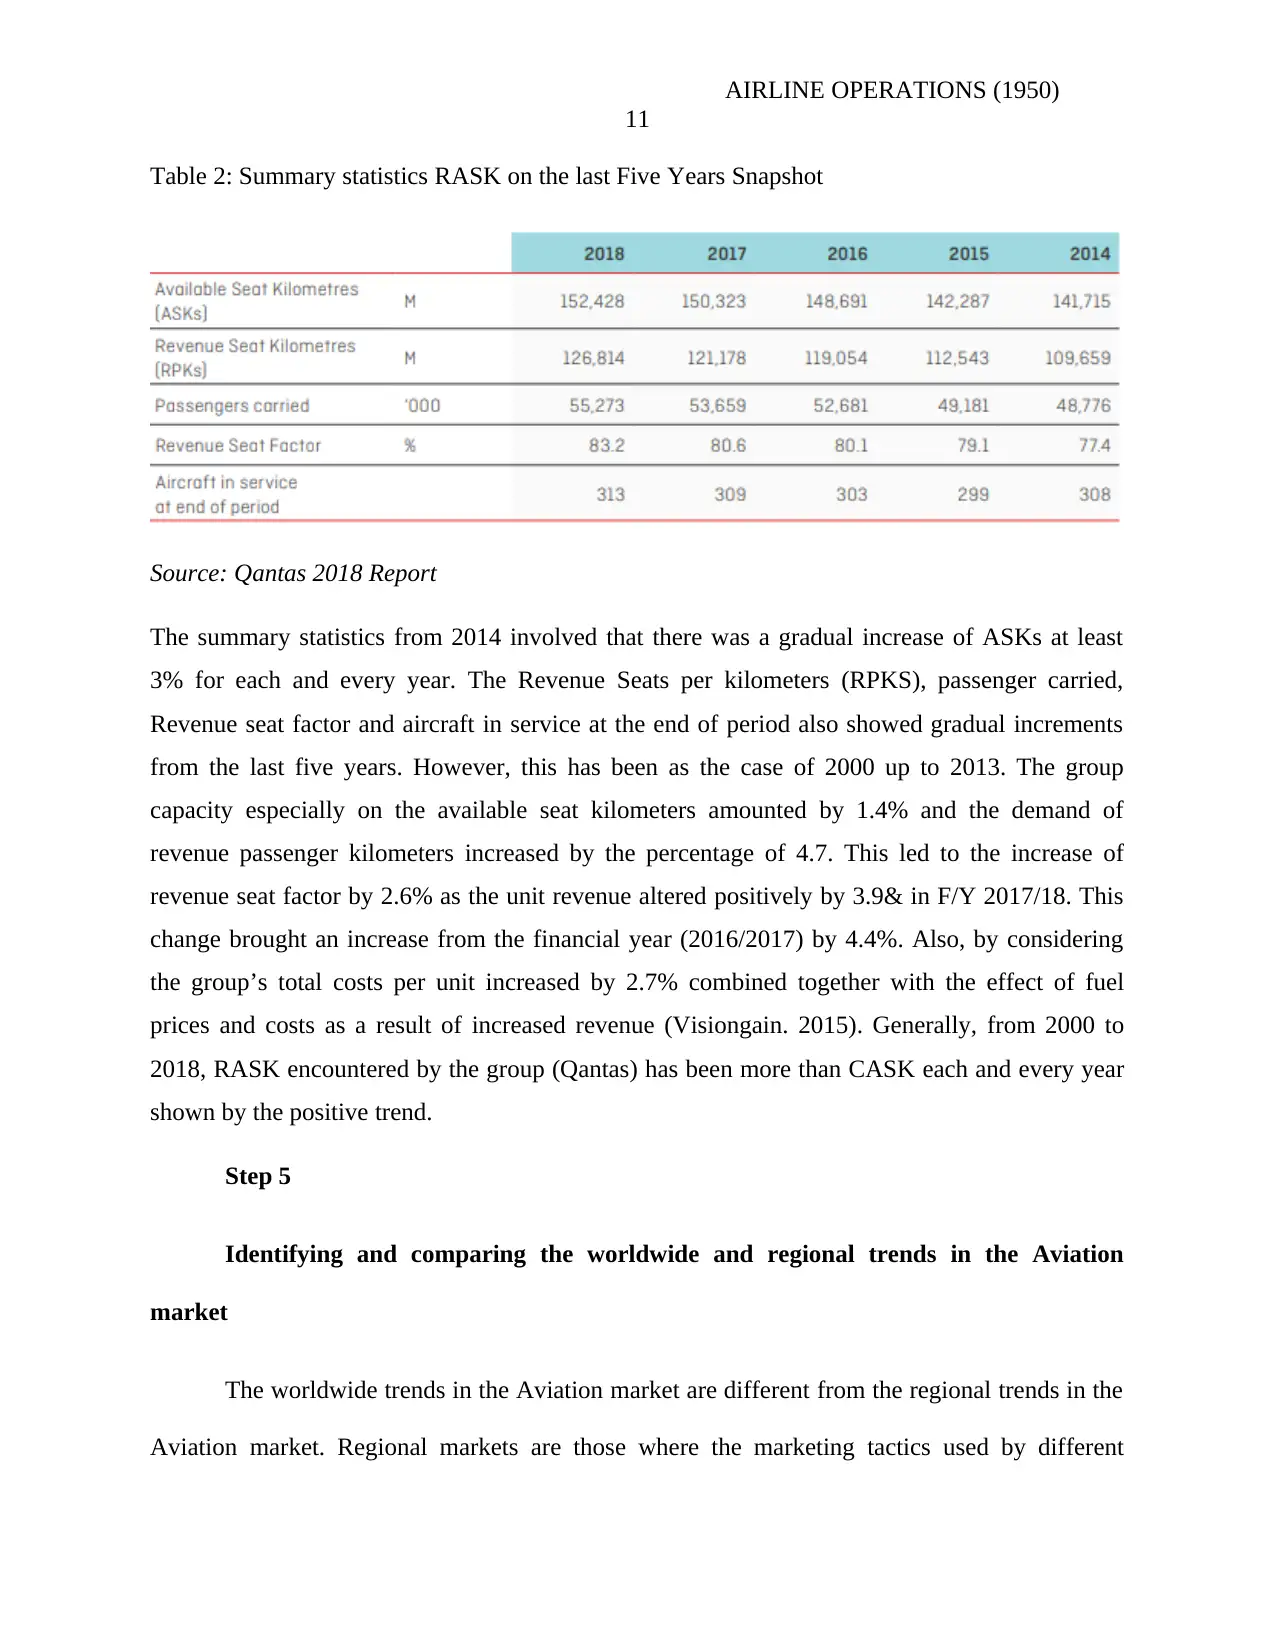
Table 2: Summary statistics RASK on the last Five Years Snapshot
Source: Qantas 2018 Report
The summary statistics from 2014 involved that there was a gradual increase of ASKs at least
3% for each and every year. The Revenue Seats per kilometers (RPKS), passenger carried,
Revenue seat factor and aircraft in service at the end of period also showed gradual increments
from the last five years. However, this has been as the case of 2000 up to 2013. The group
capacity especially on the available seat kilometers amounted by 1.4% and the demand of
revenue passenger kilometers increased by the percentage of 4.7. This led to the increase of
revenue seat factor by 2.6% as the unit revenue altered positively by 3.9& in F/Y 2017/18. This
change brought an increase from the financial year (2016/2017) by 4.4%. Also, by considering
the group’s total costs per unit increased by 2.7% combined together with the effect of fuel
prices and costs as a result of increased revenue (Visiongain. 2015). Generally, from 2000 to
2018, RASK encountered by the group (Qantas) has been more than CASK each and every year
shown by the positive trend.
Step 5
Identifying and comparing the worldwide and regional trends in the Aviation
market
The worldwide trends in the Aviation market are different from the regional trends in the
Aviation market. Regional markets are those where the marketing tactics used by different
11
Table 2: Summary statistics RASK on the last Five Years Snapshot
Source: Qantas 2018 Report
The summary statistics from 2014 involved that there was a gradual increase of ASKs at least
3% for each and every year. The Revenue Seats per kilometers (RPKS), passenger carried,
Revenue seat factor and aircraft in service at the end of period also showed gradual increments
from the last five years. However, this has been as the case of 2000 up to 2013. The group
capacity especially on the available seat kilometers amounted by 1.4% and the demand of
revenue passenger kilometers increased by the percentage of 4.7. This led to the increase of
revenue seat factor by 2.6% as the unit revenue altered positively by 3.9& in F/Y 2017/18. This
change brought an increase from the financial year (2016/2017) by 4.4%. Also, by considering
the group’s total costs per unit increased by 2.7% combined together with the effect of fuel
prices and costs as a result of increased revenue (Visiongain. 2015). Generally, from 2000 to
2018, RASK encountered by the group (Qantas) has been more than CASK each and every year
shown by the positive trend.
Step 5
Identifying and comparing the worldwide and regional trends in the Aviation
market
The worldwide trends in the Aviation market are different from the regional trends in the
Aviation market. Regional markets are those where the marketing tactics used by different
AIRLINE OPERATIONS (1950)
12
countries specific to particular places or countries. On the other hand, worldwide market
comprises of all the Aviation in a single market (Homsombat, et al 2014).
The worldwide airline market comprises of all the regional and domestic airline markets.
It therefore addresses all the issues concerning airlines internationally minus considering some.
The worldwide trends in the aviation market are seen advancing and experiencing vigorous
growth, development and profitability. The total demand in the market increased since 2017 up
to date (Australian Aviation Associations Forum, 2016). The general fuel costs of jets are seen
rising due to high demand for fuel and so the transportation costs. Markets like Asia and Middle
East airlines are better examples for the increased new entrants in the market where the
passengers demand for low costs travelling. In 2012 global annual airline report, the market was
led by North America, Europe the Asia airlines.
Regional airlines have gone through different trends that make them different from each
other. The optimism levels of the airline are much determined by respective countries. African is
the region with the weakest airline market though its predicted that the, market will improve and
rise in the coming years (Australia competition and airline consumption, 2018). Africa as a
region still has chances since many Aviation groups consider it to have a better long-term
growth. The African Aviation market is weak and the governments of these countries consider
air transport to be for the rich. African countries also deny air space to their fellow African
airlines but do provide space for airlines from other continents.
For Middle East airlines, it has been seen booming as the main aviation ‘hub’. Middle
East airlines some level of competition that show an improvement in its market. The
improvement is majorly seen in Emirates and Flydubai. Currently, Qatar is going through
⊘ This is a preview!⊘
Do you want full access?
Subscribe today to unlock all pages.
Trusted by 1+ million students worldwide
1 out of 19
Related Documents


Your All-in-One AI-Powered Toolkit for Academic Success.
+13062052269
info@desklib.com
Available 24*7 on WhatsApp / Email
![[object Object]](/_next/static/media/star-bottom.7253800d.svg)
Unlock your academic potential
Copyright © 2020–2026 A2Z Services. All Rights Reserved. Developed and managed by ZUCOL.