logo

AMOS Analysis: Model 1 vs Model 2

11 Pages1830 Words80 Views
   

Added on  2023-01-07

About This Document

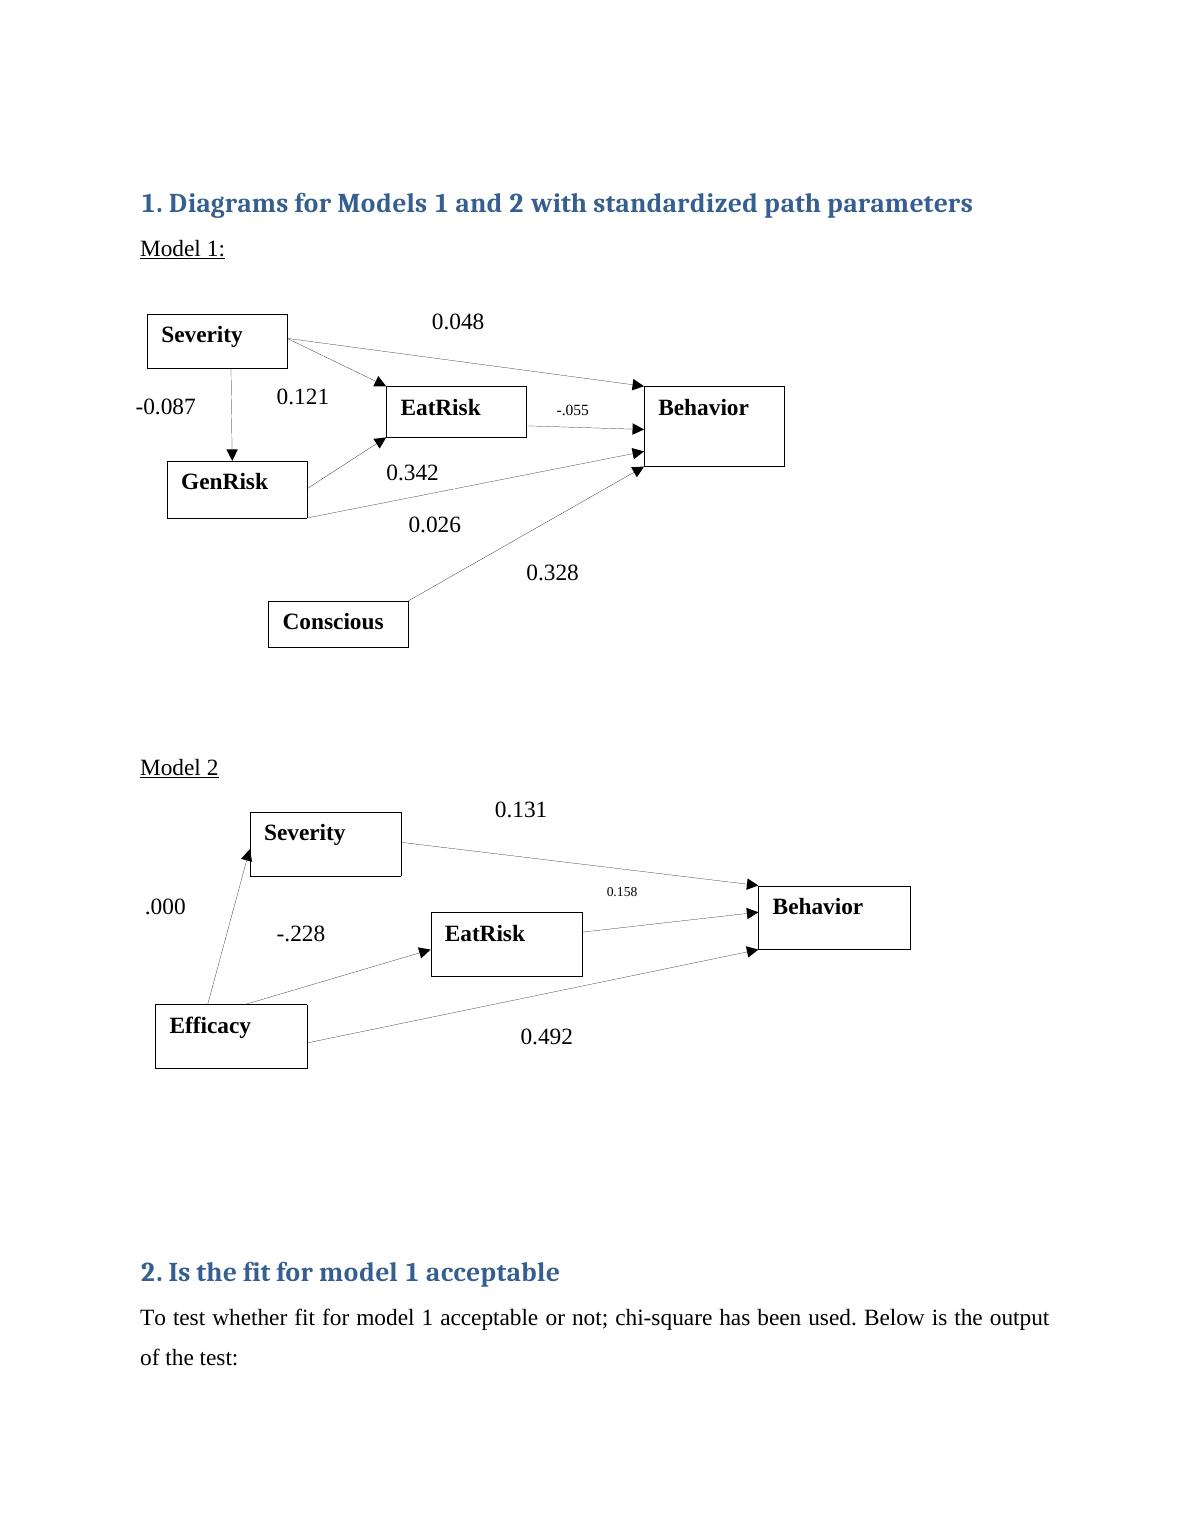
An analysis comparing the fit of Model 1 and Model 2 in AMOS. Model 1 is recommended as the best fit for predicting behavior related to healthy eating. Model 2 does not show significant variations in the variables.

AMOS Analysis: Model 1 vs Model 2

   Added on 2023-01-07

ShareRelated Documents
AMOS analysis
AMOS Analysis: Model 1 vs Model 2_1
1. Diagrams for Models 1 and 2 with standardized path parameters
Model 1:
Model 2
2. Is the fit for model 1 acceptable
To test whether fit for model 1 acceptable or not; chi-square has been used. Below is the output
of the test:
Severity
GenRisk
EatRisk Behavior
Conscious
-0.087 0.121
0.342
0.048
-.055
0.026
0.328
Severity
EatRisk
Efficacy
Behavior.000
-.228
0.131
0.492
0.158
AMOS Analysis: Model 1 vs Model 2_2
Severity
Observed N Expected N Residual
0 2 22.7 -20.7
1 23 22.7 .3
2 47 22.7 24.3
3 39 22.7 16.3
4 22 22.7 -.7
5 3 22.7 -19.7
Total 136
EatRisk
Observed N Expected N Residual
0 8 22.7 -14.7
1 16 22.7 -6.7
2 92 22.7 69.3
3 11 22.7 -11.7
4 8 22.7 -14.7
5 1 22.7 -21.7
Total 136
GenRisk
Observed N Expected N Residual
2 36 34.0 2.0
3 76 34.0 42.0
4 20 34.0 -14.0
5 4 34.0 -30.0
Total 136
AMOS Analysis: Model 1 vs Model 2_3
Conscious
Observed N Expected N Residual
2 2 22.7 -20.7
3 9 22.7 -13.7
4 34 22.7 11.3
5 49 22.7 26.3
6 34 22.7 11.3
7 8 22.7 -14.7
Total 136
Behaviour
Observed N Expected N Residual
1 5 17.0 -12.0
2 7 17.0 -10.0
3 16 17.0 -1.0
4 22 17.0 5.0
5 52 17.0 35.0
6 21 17.0 4.0
7 6 17.0 -11.0
8 7 17.0 -10.0
Total 136
Test Statistics
Severity EatRisk GenRisk Conscious Behaviour
Chi-Square 73.824a 259.735a 84.235b 78.500a 101.882c
df 5 5 3 5 7
Asymp. Sig. .000 .000 .000 .000 .000
a. 0 cells (0.0%) have expected frequencies less than 5. The minimum expected
cell frequency is 22.7.
b. 0 cells (0.0%) have expected frequencies less than 5. The minimum expected
cell frequency is 34.0.
c. 0 cells (0.0%) have expected frequencies less than 5. The minimum expected
cell frequency is 17.0.
Critical values:
Degrees of
freedom
0.05
AMOS Analysis: Model 1 vs Model 2_4

End of preview

Want to access all the pages? Upload your documents or become a member.

Related Documents
SPSS Assignment | Statistics Assignment
|8
|1035
|294

Significant Change in Gender and Geography of Respondents
|8
|964
|53

Impact of Break Time on Productivity: A Statistical Analysis
|14
|2360
|437

SPSS Assessment: Program Evaluation, Gender and Activity Association, Mood and Stress Relationship, Impact of Mood, Motivation, and Stress on Cognitive Performance
|13
|1880
|50

SPSS Data Analysis: Relations and Variable Analysis
|28
|3462
|497

Relationship between gender and life happiness score
|26
|2817
|200