Analysis and Visualization of Big Data
VerifiedAdded on 2023/06/11
|19
|3019
|479
AI Summary
This research paper aims to obtain a critical insight of the important power consumption drivers. The visualisations related to technology of solar energy along with data analysis focus on certain features, which are enumerated briefly as follows: Enforcement of technologies pertaining to solar energy, Geographical features, Physical features that the houses have including variables like bedrooms, roof colour, materials utilised, staircases, size, lighting used, PV capacity and housing insulation
Contribute Materials
Your contribution can guide someone’s learning journey. Share your
documents today.
RUNNING HEAD: ANALYSIS AND VISUALIZATION OF BIG DATA
Analysis and Visualization of Big Data
Name of Student:
Name of University:
Course ID:
Analysis and Visualization of Big Data
Name of Student:
Name of University:
Course ID:
Secure Best Marks with AI Grader
Need help grading? Try our AI Grader for instant feedback on your assignments.
1ANALYSIS AND VISUALIZATION OF BIG DATA
Table of Contents
Introduction:....................................................................................................................................2
Answers:..........................................................................................................................................3
Dashboard Presentation:................................................................................................................13
Reporting:......................................................................................................................................14
Recommendation:..........................................................................................................................15
Reflection:......................................................................................................................................16
References:....................................................................................................................................17
2ANALYSIS AND VISUALIZATION OF BIG DATA
Introduction:
The current research would focus on brief assessment of the project data related to “Solar
city” that the authority of “Ballarat University” has undertaken. The intention is to analyse the
changes aroused to energy consumption. In order to accumulate data, the primary targets are
business and household recruitments, which include Grampians and Loddon Mallee. Moreover,
in this paper, numerous factors would be highlighted having direct effect on the conventional
power consumption in various households falling under the Australian suburbs. This research
paper aims to obtain a critical insight of the important power consumption drivers. This is
because the energy sources that are not renewable have engendered electric energy, which leads
to huge emission of detrimental gases like carbon dioxide. The visualisations related to
technology of solar energy along with data analysis focus on certain features, which are
enumerated briefly as follows:
Enforcement of technologies pertaining to solar energy
Geographical features
Physical features that the houses have including variables like bedrooms, roof colour,
materials utilised, staircases, size, lighting used, PV capacity and housing insulation
For meeting the criteria, two research questions are needed to be taken into consideration.
Hence, the tool that would be most suitable in this case is “IBM Watson Analytic” through
which it is possible to assess the provided set of data.
Answers:
The contribution of power usage over a year by roof colour:
3ANALYSIS AND VISUALIZATION OF BIG DATA
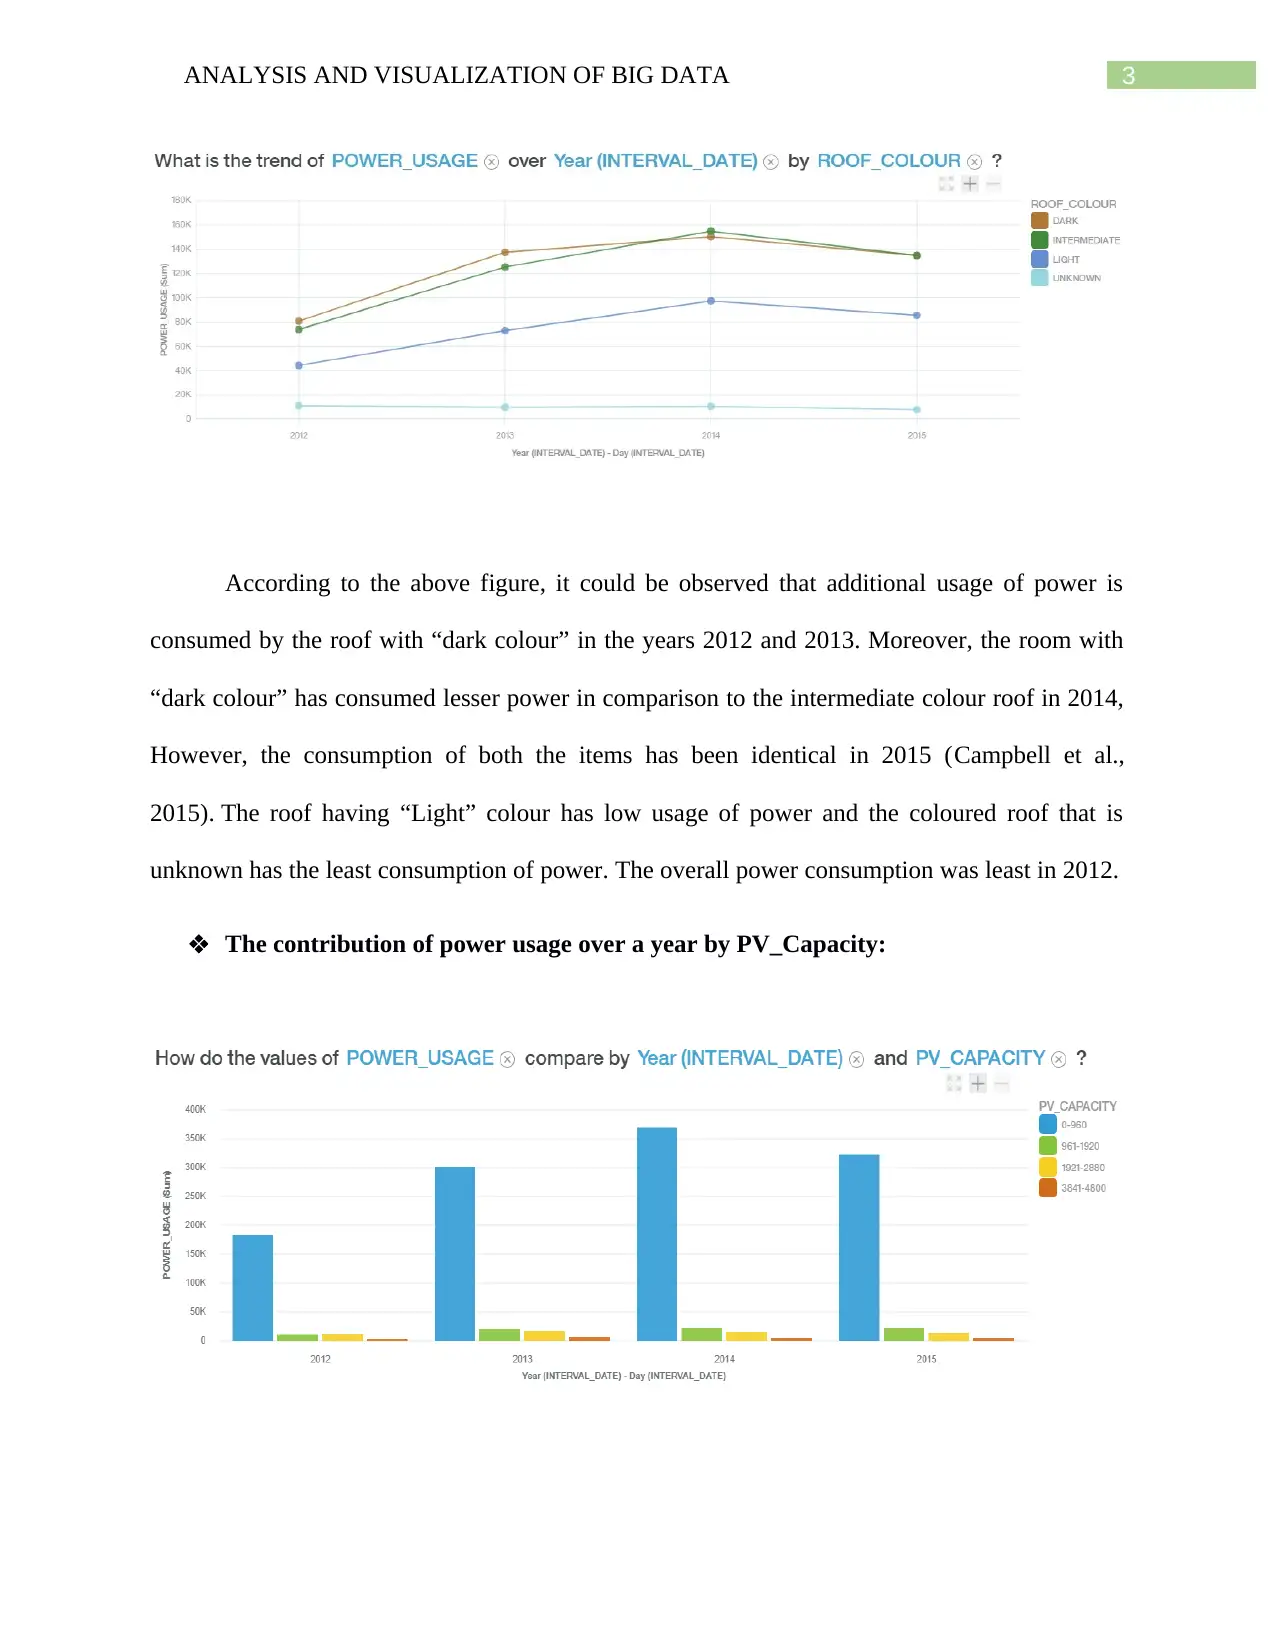
According to the above figure, it could be observed that additional usage of power is
consumed by the roof with “dark colour” in the years 2012 and 2013. Moreover, the room with
“dark colour” has consumed lesser power in comparison to the intermediate colour roof in 2014,
However, the consumption of both the items has been identical in 2015 (Campbell et al.,
2015). The roof having “Light” colour has low usage of power and the coloured roof that is
unknown has the least consumption of power. The overall power consumption was least in 2012.
The contribution of power usage over a year by PV_Capacity:
Secure Best Marks with AI Grader
Need help grading? Try our AI Grader for instant feedback on your assignments.
4ANALYSIS AND VISUALIZATION OF BIG DATA
The Photo Voltaic capacity having lowest capacity ranging between 0 and 960 has the
maximum usage of power. On the contrary, the Photo Voltaic capacity having the uppermost
photo voltaic capacity ranging above 960 leads to minimised usage of power. The maximum
power usage could be observed in 2014 because the PV capacity is the lowest in the year. In
2012, considerable decline in usage of power could be observed during the year in each type of
photo voltaic capacity.
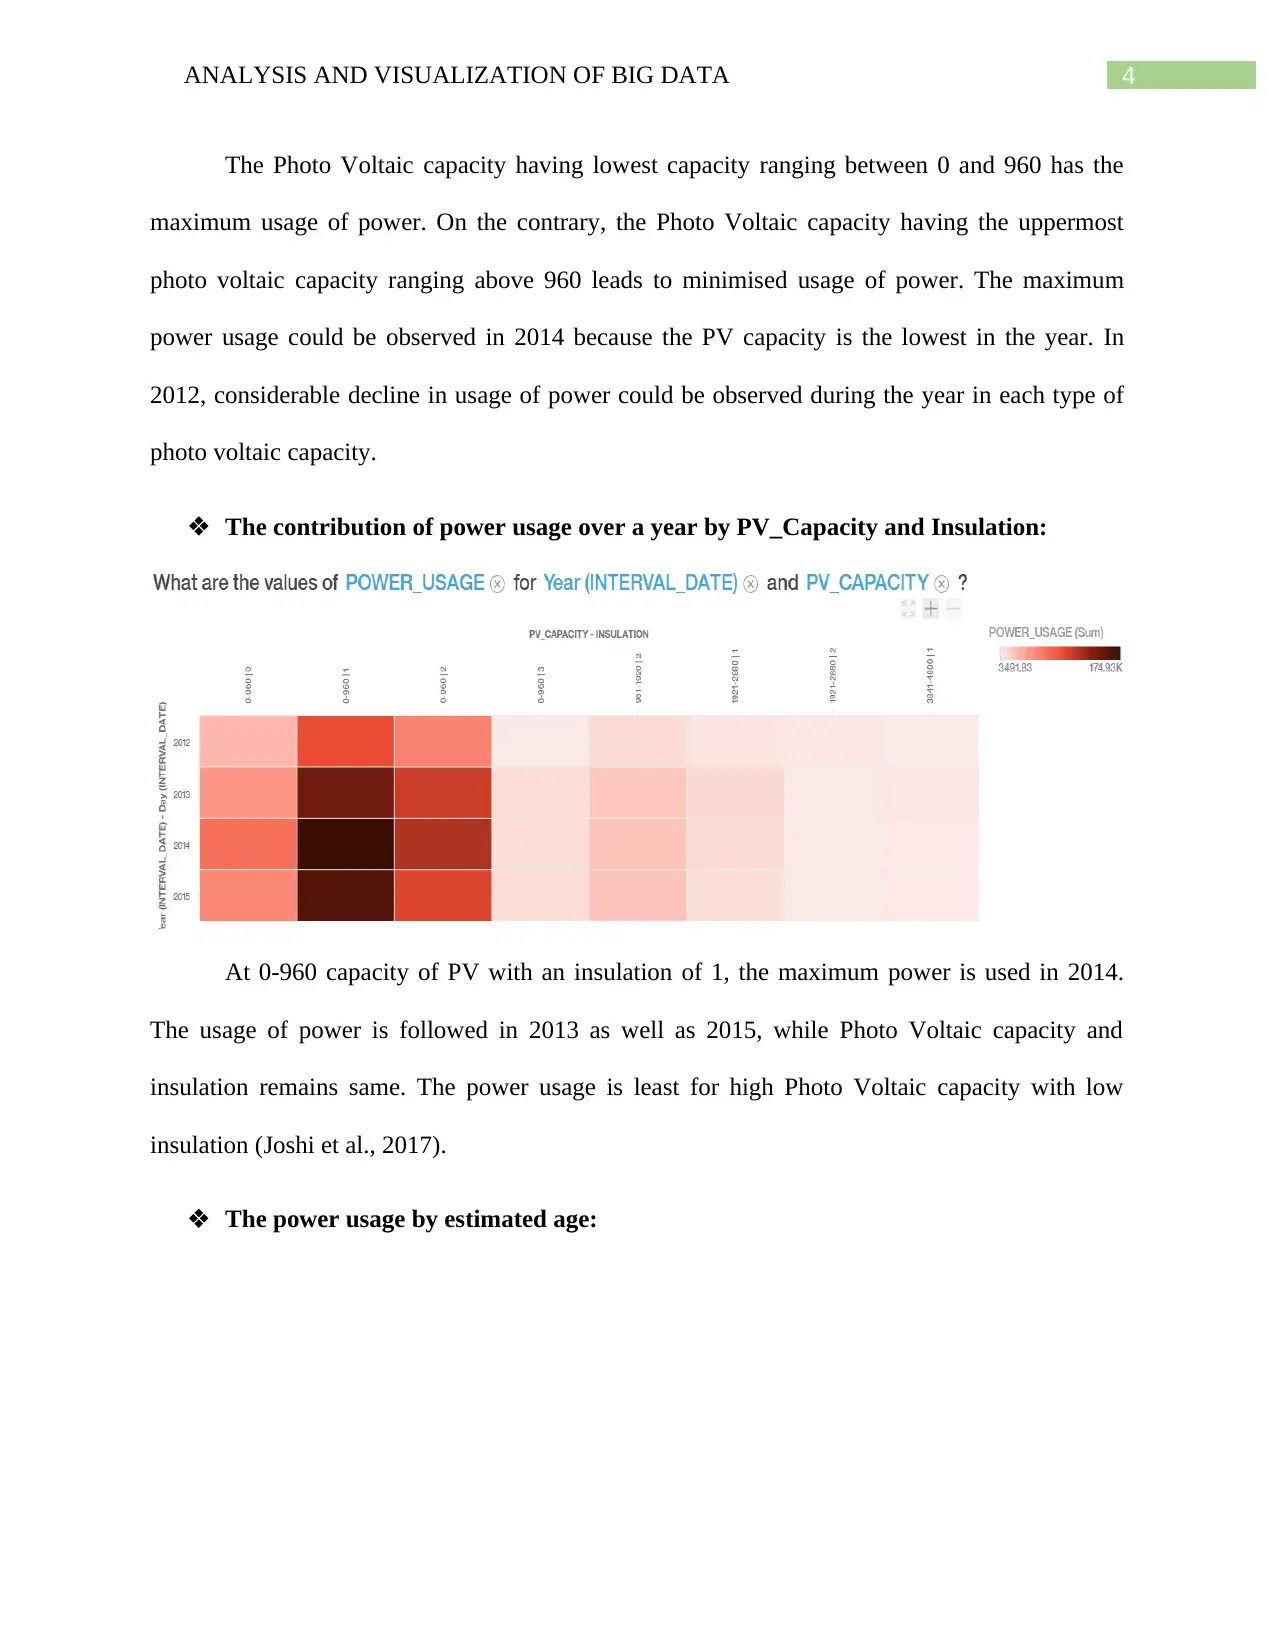
The contribution of power usage over a year by PV_Capacity and Insulation:
At 0-960 capacity of PV with an insulation of 1, the maximum power is used in 2014.
The usage of power is followed in 2013 as well as 2015, while Photo Voltaic capacity and
insulation remains same. The power usage is least for high Photo Voltaic capacity with low
insulation (Joshi et al., 2017).
The power usage by estimated age:
The Photo Voltaic capacity having lowest capacity ranging between 0 and 960 has the
maximum usage of power. On the contrary, the Photo Voltaic capacity having the uppermost
photo voltaic capacity ranging above 960 leads to minimised usage of power. The maximum
power usage could be observed in 2014 because the PV capacity is the lowest in the year. In
2012, considerable decline in usage of power could be observed during the year in each type of
photo voltaic capacity.
The contribution of power usage over a year by PV_Capacity and Insulation:
At 0-960 capacity of PV with an insulation of 1, the maximum power is used in 2014.
The usage of power is followed in 2013 as well as 2015, while Photo Voltaic capacity and
insulation remains same. The power usage is least for high Photo Voltaic capacity with low
insulation (Joshi et al., 2017).
The power usage by estimated age:
5ANALYSIS AND VISUALIZATION OF BIG DATA
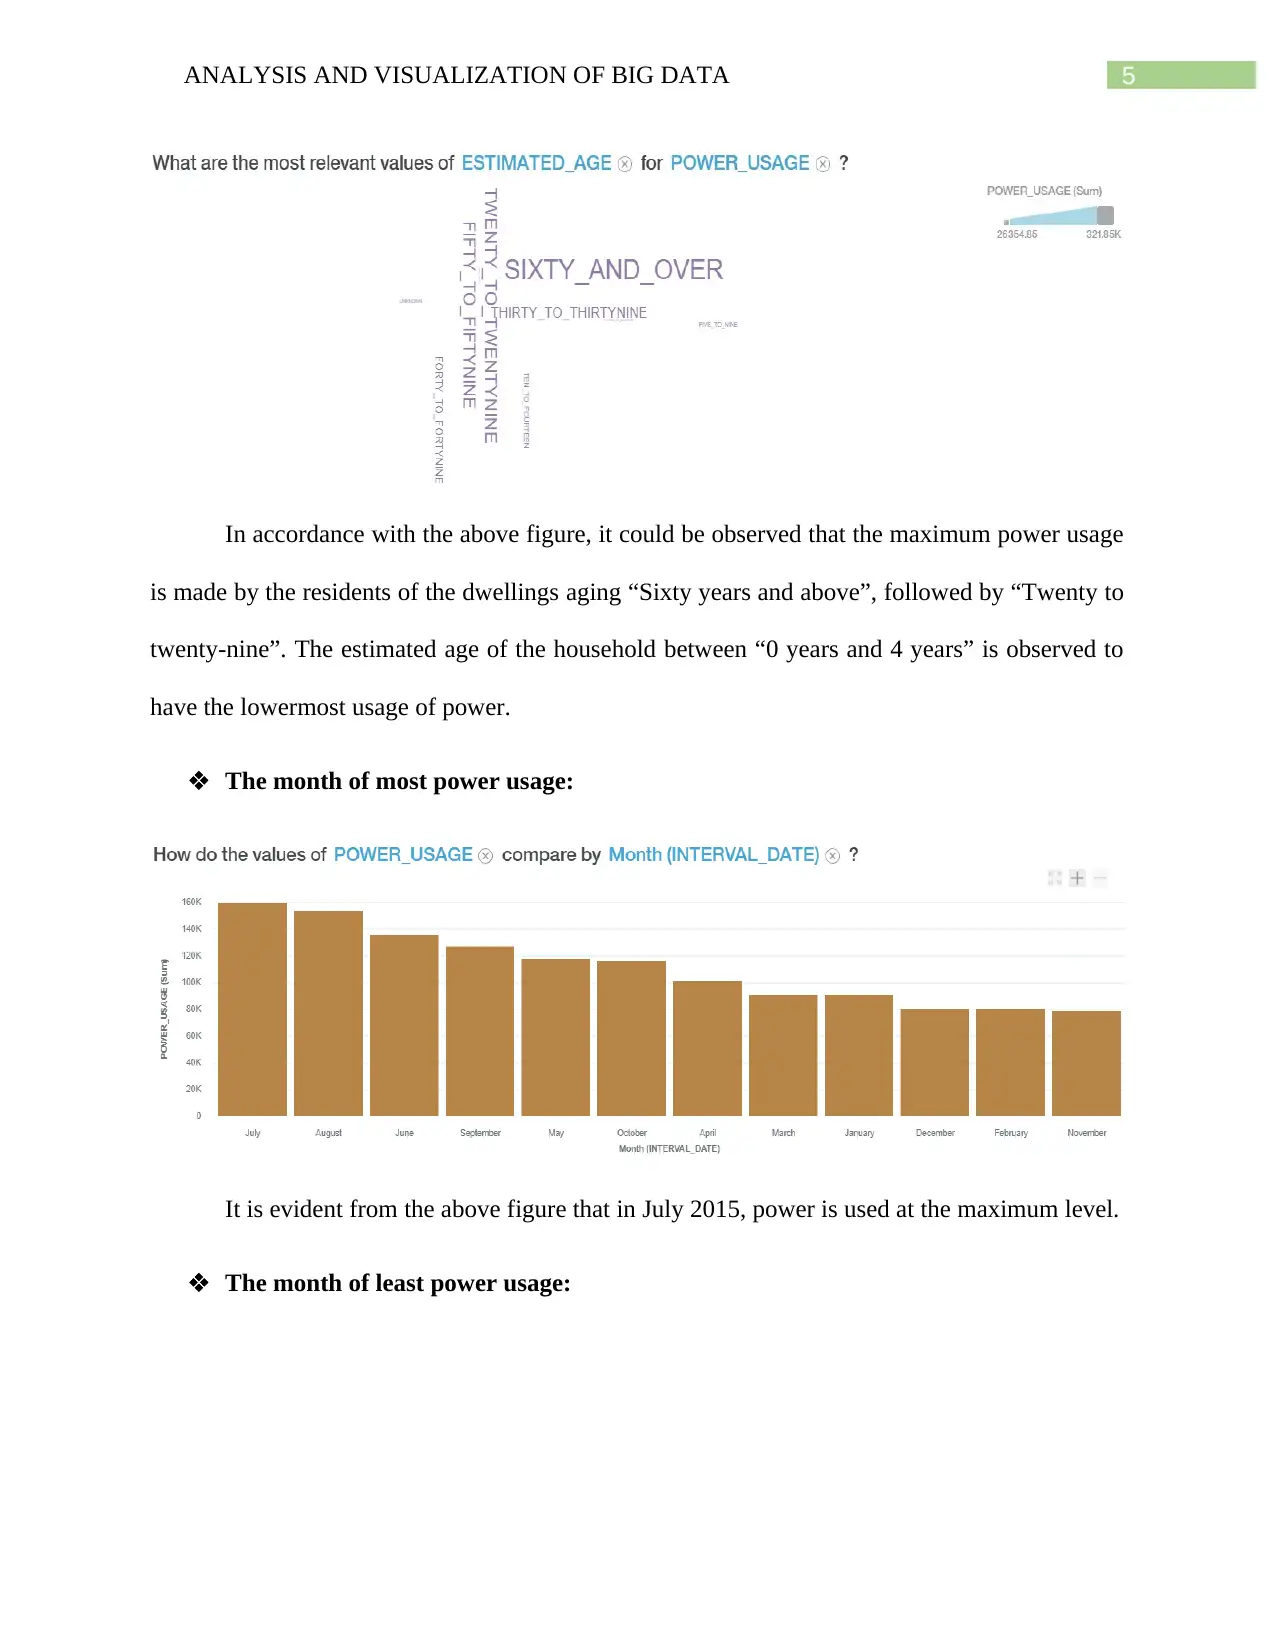
In accordance with the above figure, it could be observed that the maximum power usage
is made by the residents of the dwellings aging “Sixty years and above”, followed by “Twenty to
twenty-nine”. The estimated age of the household between “0 years and 4 years” is observed to
have the lowermost usage of power.
The month of most power usage:
It is evident from the above figure that in July 2015, power is used at the maximum level.
The month of least power usage:
6ANALYSIS AND VISUALIZATION OF BIG DATA
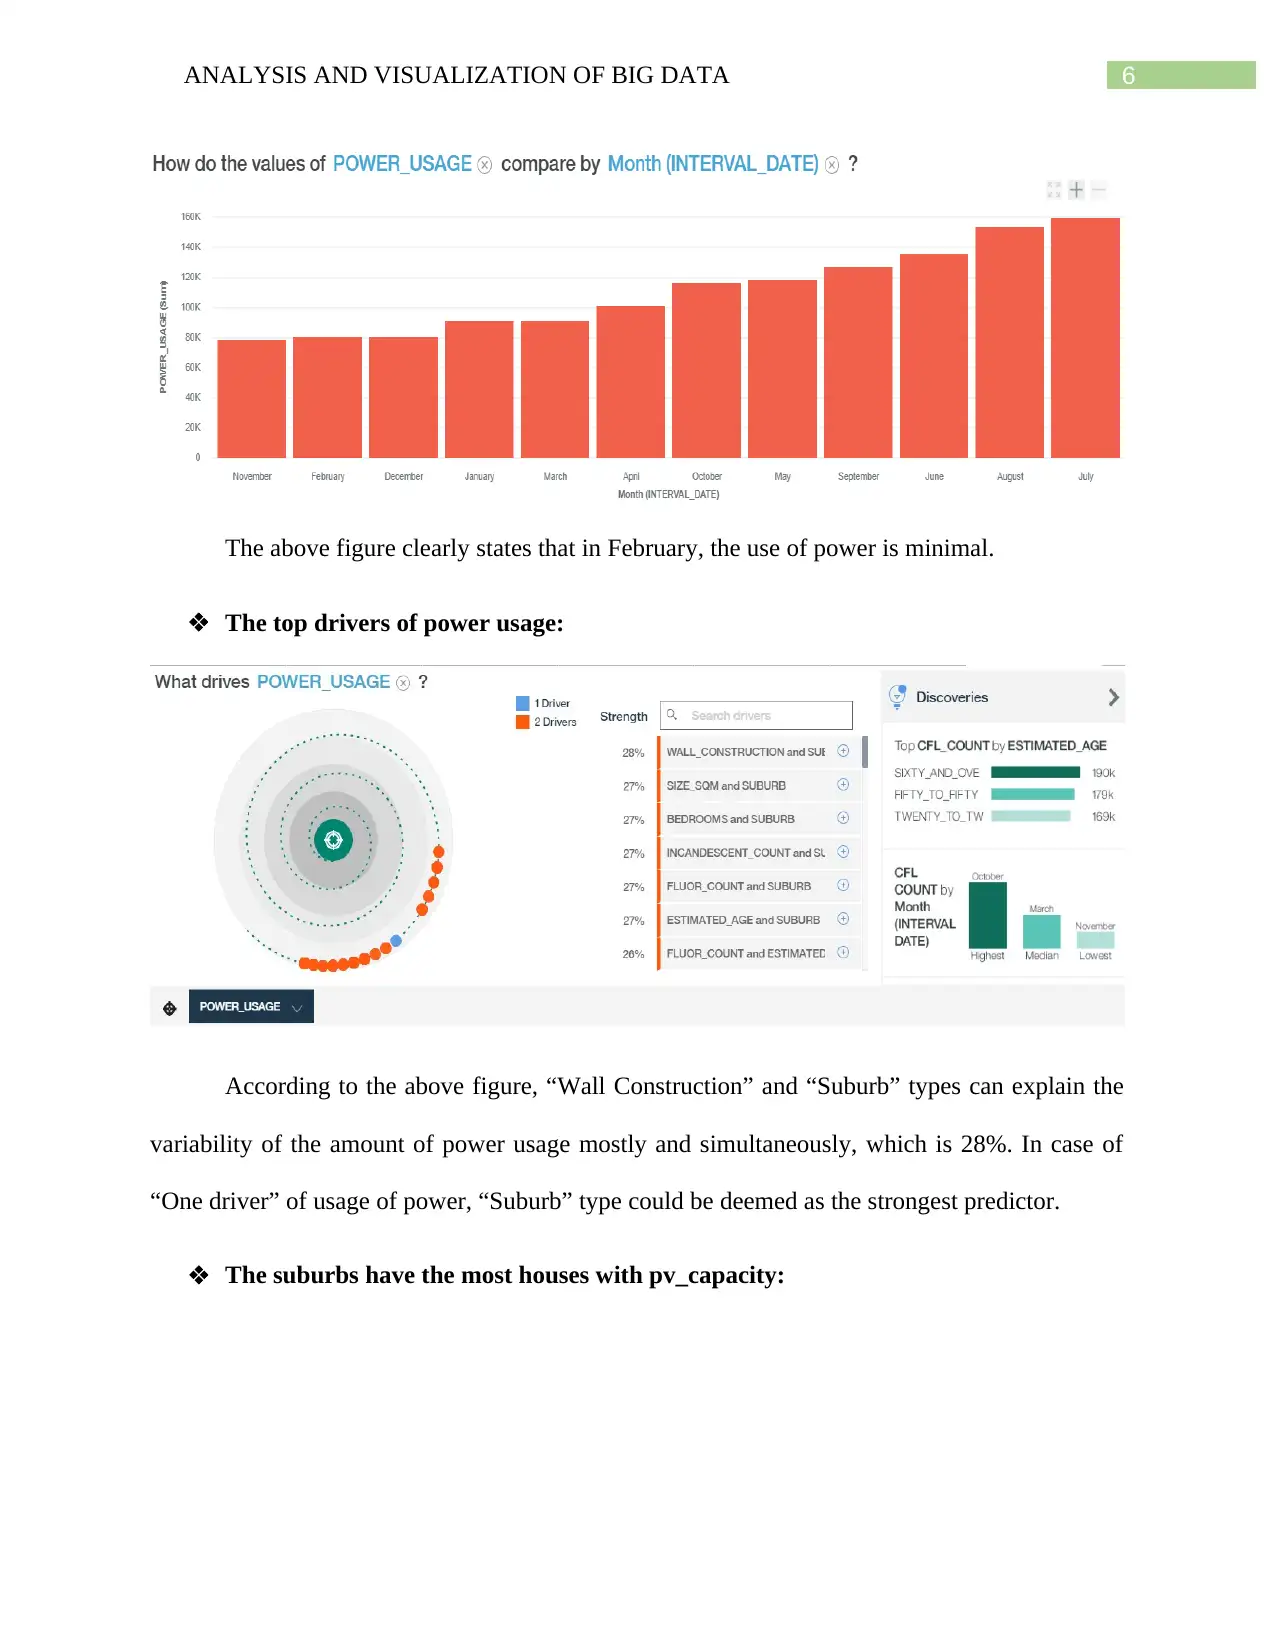
The above figure clearly states that in February, the use of power is minimal.
The top drivers of power usage:
According to the above figure, “Wall Construction” and “Suburb” types can explain the
variability of the amount of power usage mostly and simultaneously, which is 28%. In case of
“One driver” of usage of power, “Suburb” type could be deemed as the strongest predictor.
The suburbs have the most houses with pv_capacity:
Paraphrase This Document
Need a fresh take? Get an instant paraphrase of this document with our AI Paraphraser
7ANALYSIS AND VISUALIZATION OF BIG DATA
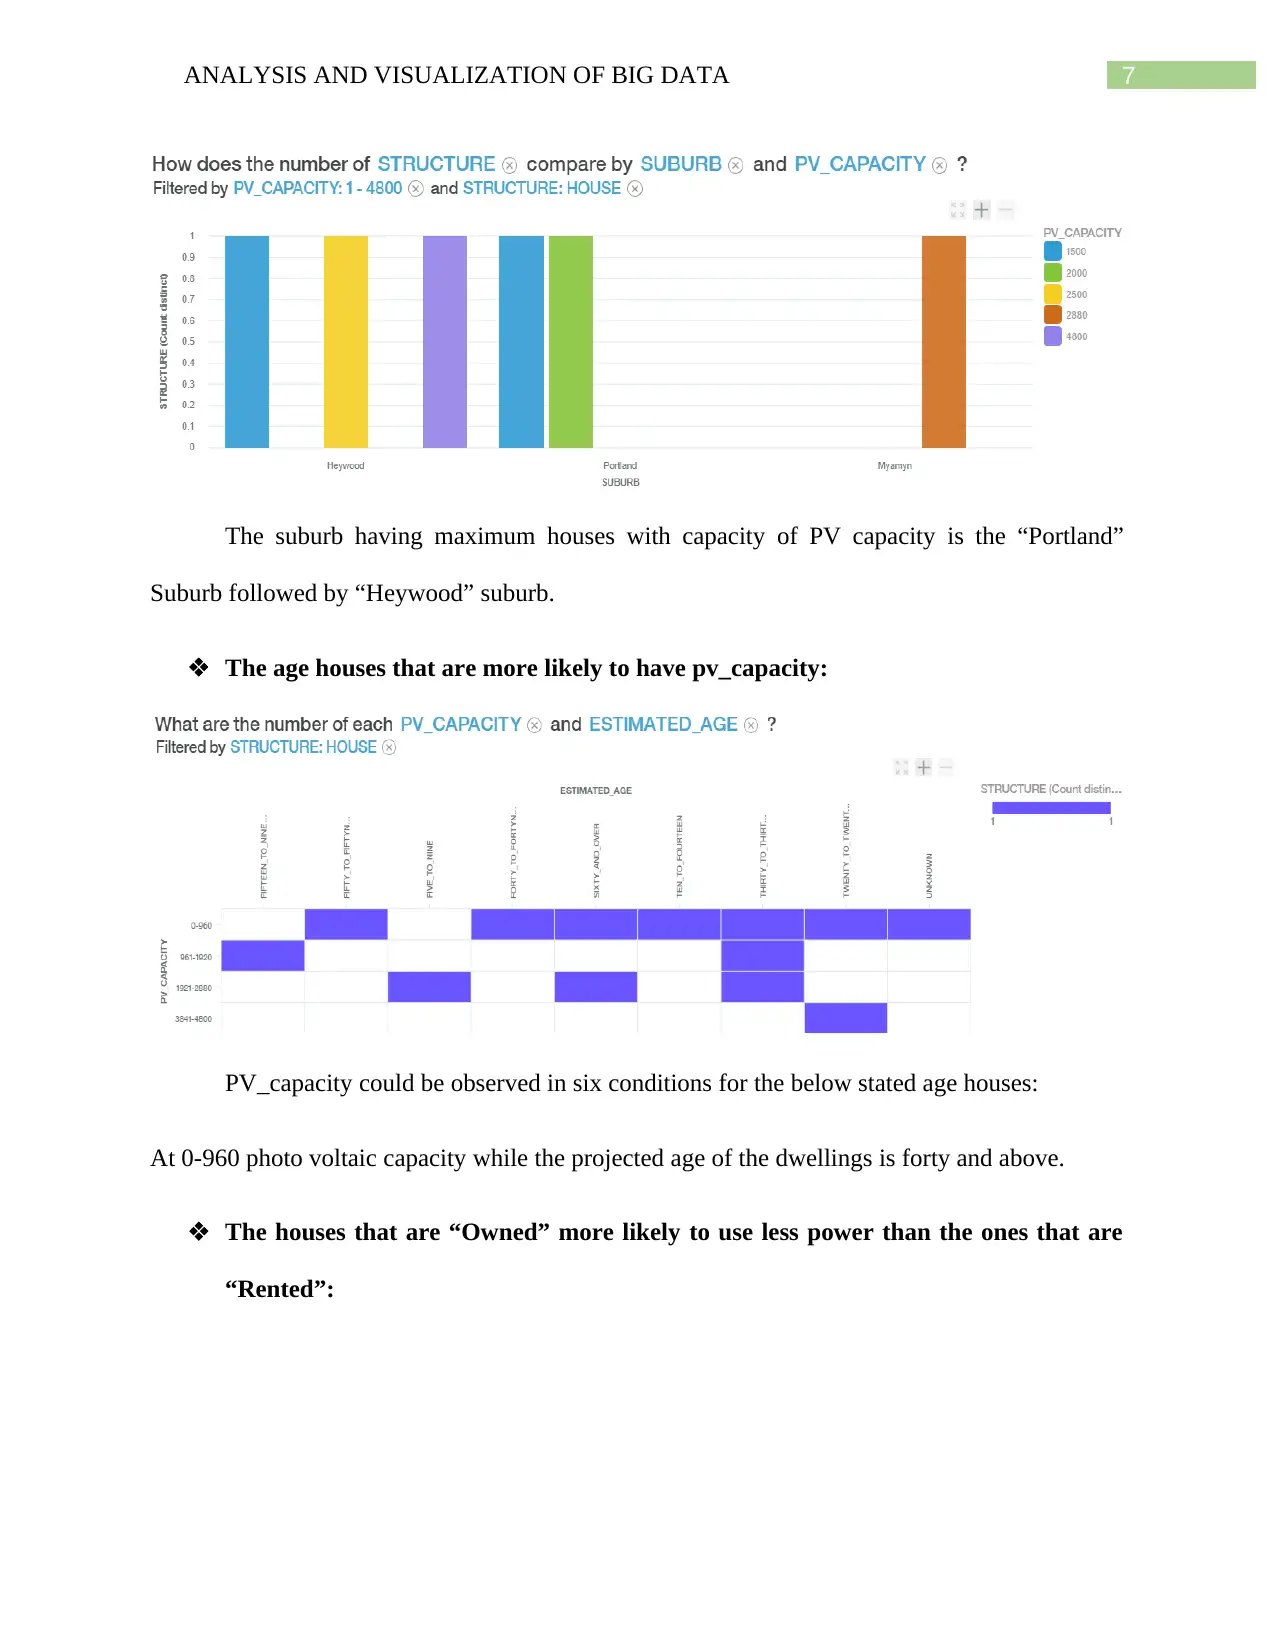
The suburb having maximum houses with capacity of PV capacity is the “Portland”
Suburb followed by “Heywood” suburb.
The age houses that are more likely to have pv_capacity:
PV_capacity could be observed in six conditions for the below stated age houses:
At 0-960 photo voltaic capacity while the projected age of the dwellings is forty and above.
The houses that are “Owned” more likely to use less power than the ones that are
“Rented”:
8ANALYSIS AND VISUALIZATION OF BIG DATA
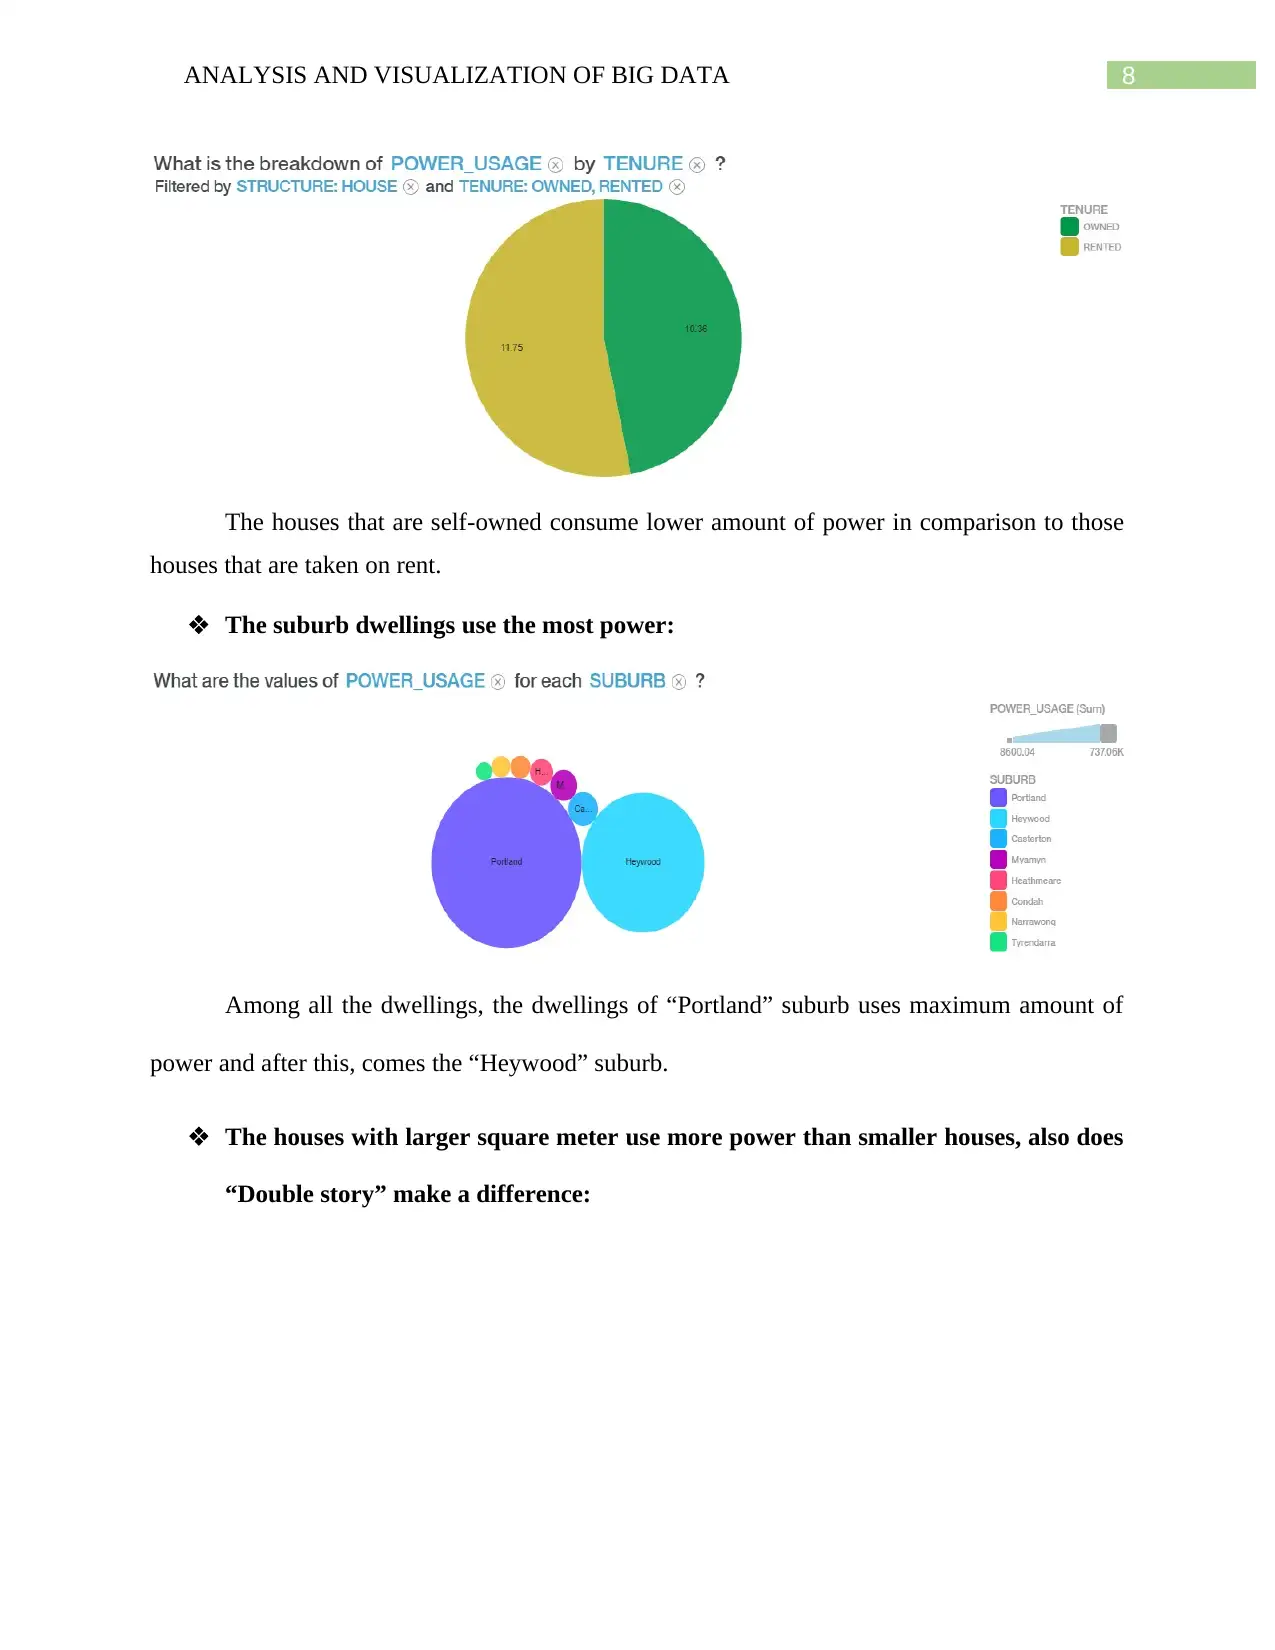
The houses that are self-owned consume lower amount of power in comparison to those
houses that are taken on rent.
The suburb dwellings use the most power:
Among all the dwellings, the dwellings of “Portland” suburb uses maximum amount of
power and after this, comes the “Heywood” suburb.
The houses with larger square meter use more power than smaller houses, also does
“Double story” make a difference:
9ANALYSIS AND VISUALIZATION OF BIG DATA
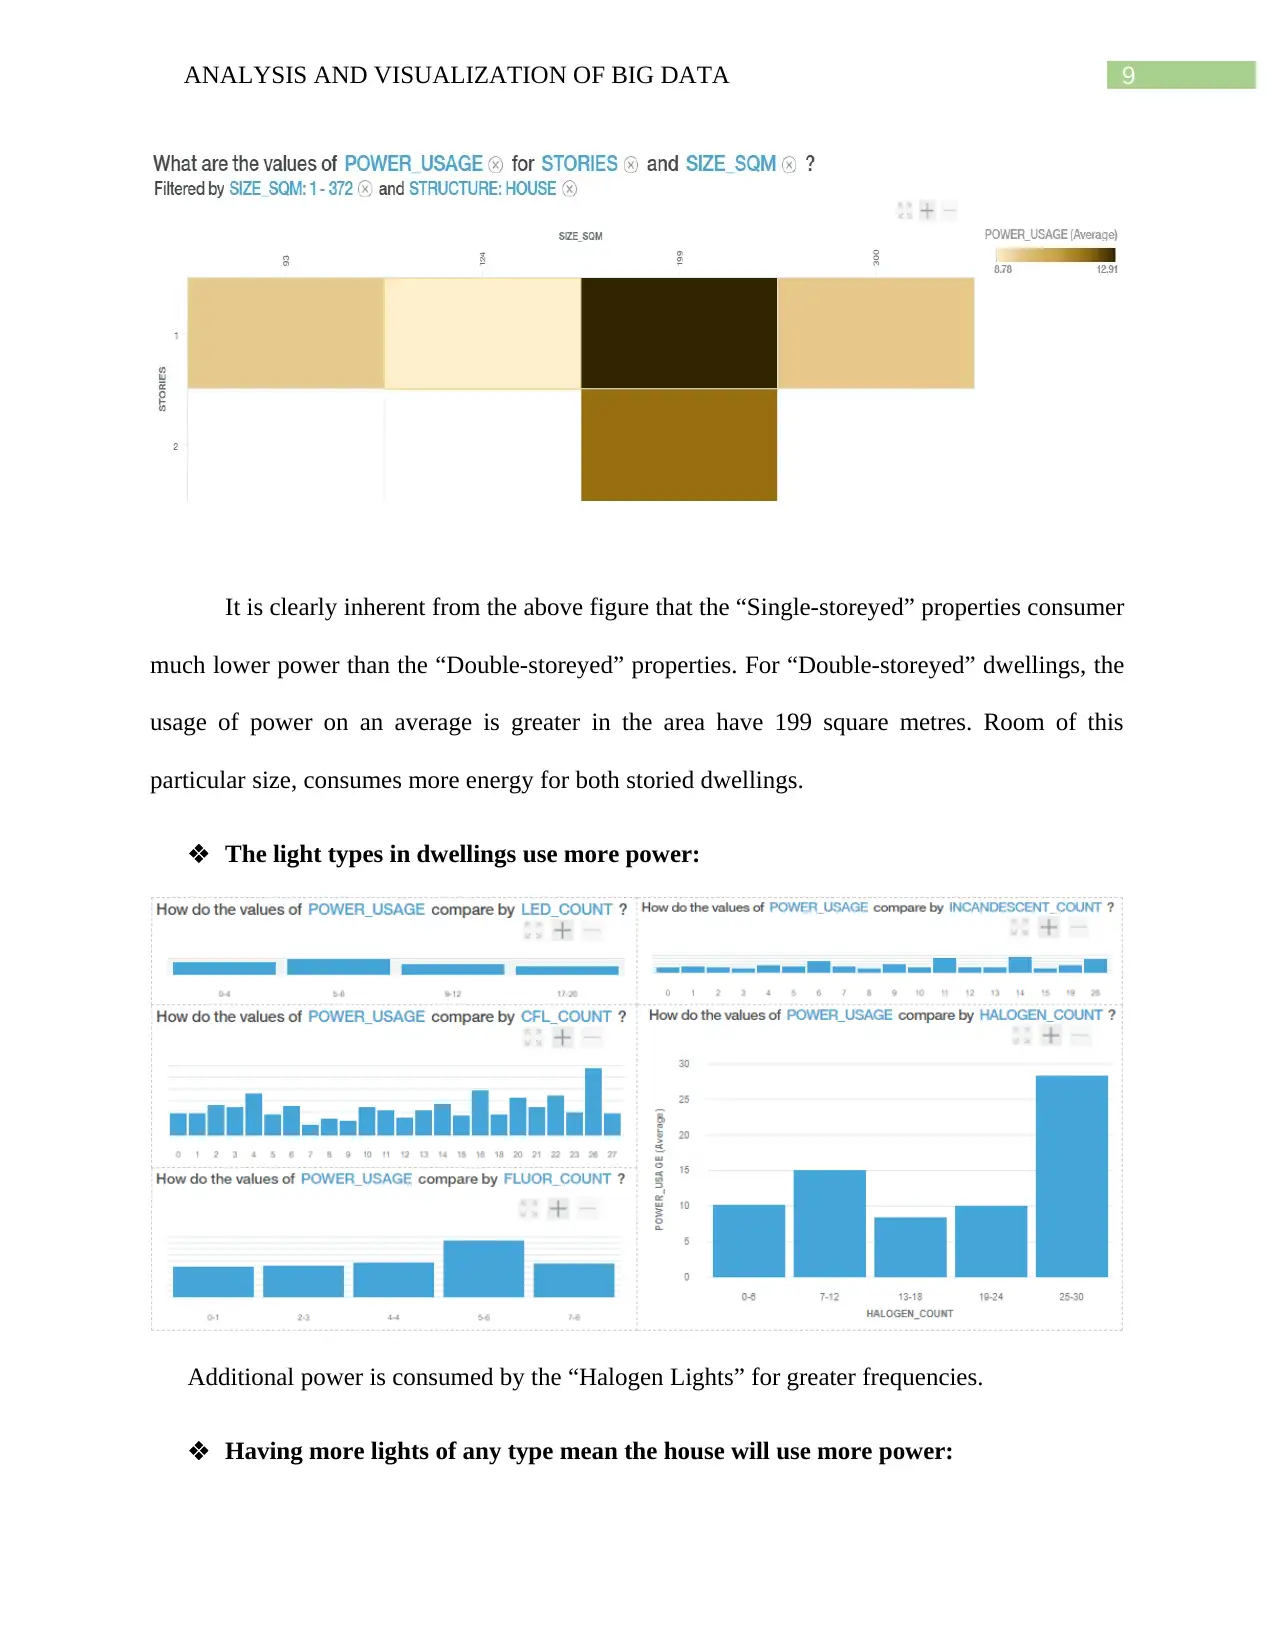
It is clearly inherent from the above figure that the “Single-storeyed” properties consumer
much lower power than the “Double-storeyed” properties. For “Double-storeyed” dwellings, the
usage of power on an average is greater in the area have 199 square metres. Room of this
particular size, consumes more energy for both storied dwellings.
The light types in dwellings use more power:
Additional power is consumed by the “Halogen Lights” for greater frequencies.
Having more lights of any type mean the house will use more power:
Secure Best Marks with AI Grader
Need help grading? Try our AI Grader for instant feedback on your assignments.
10ANALYSIS AND VISUALIZATION OF BIG DATA
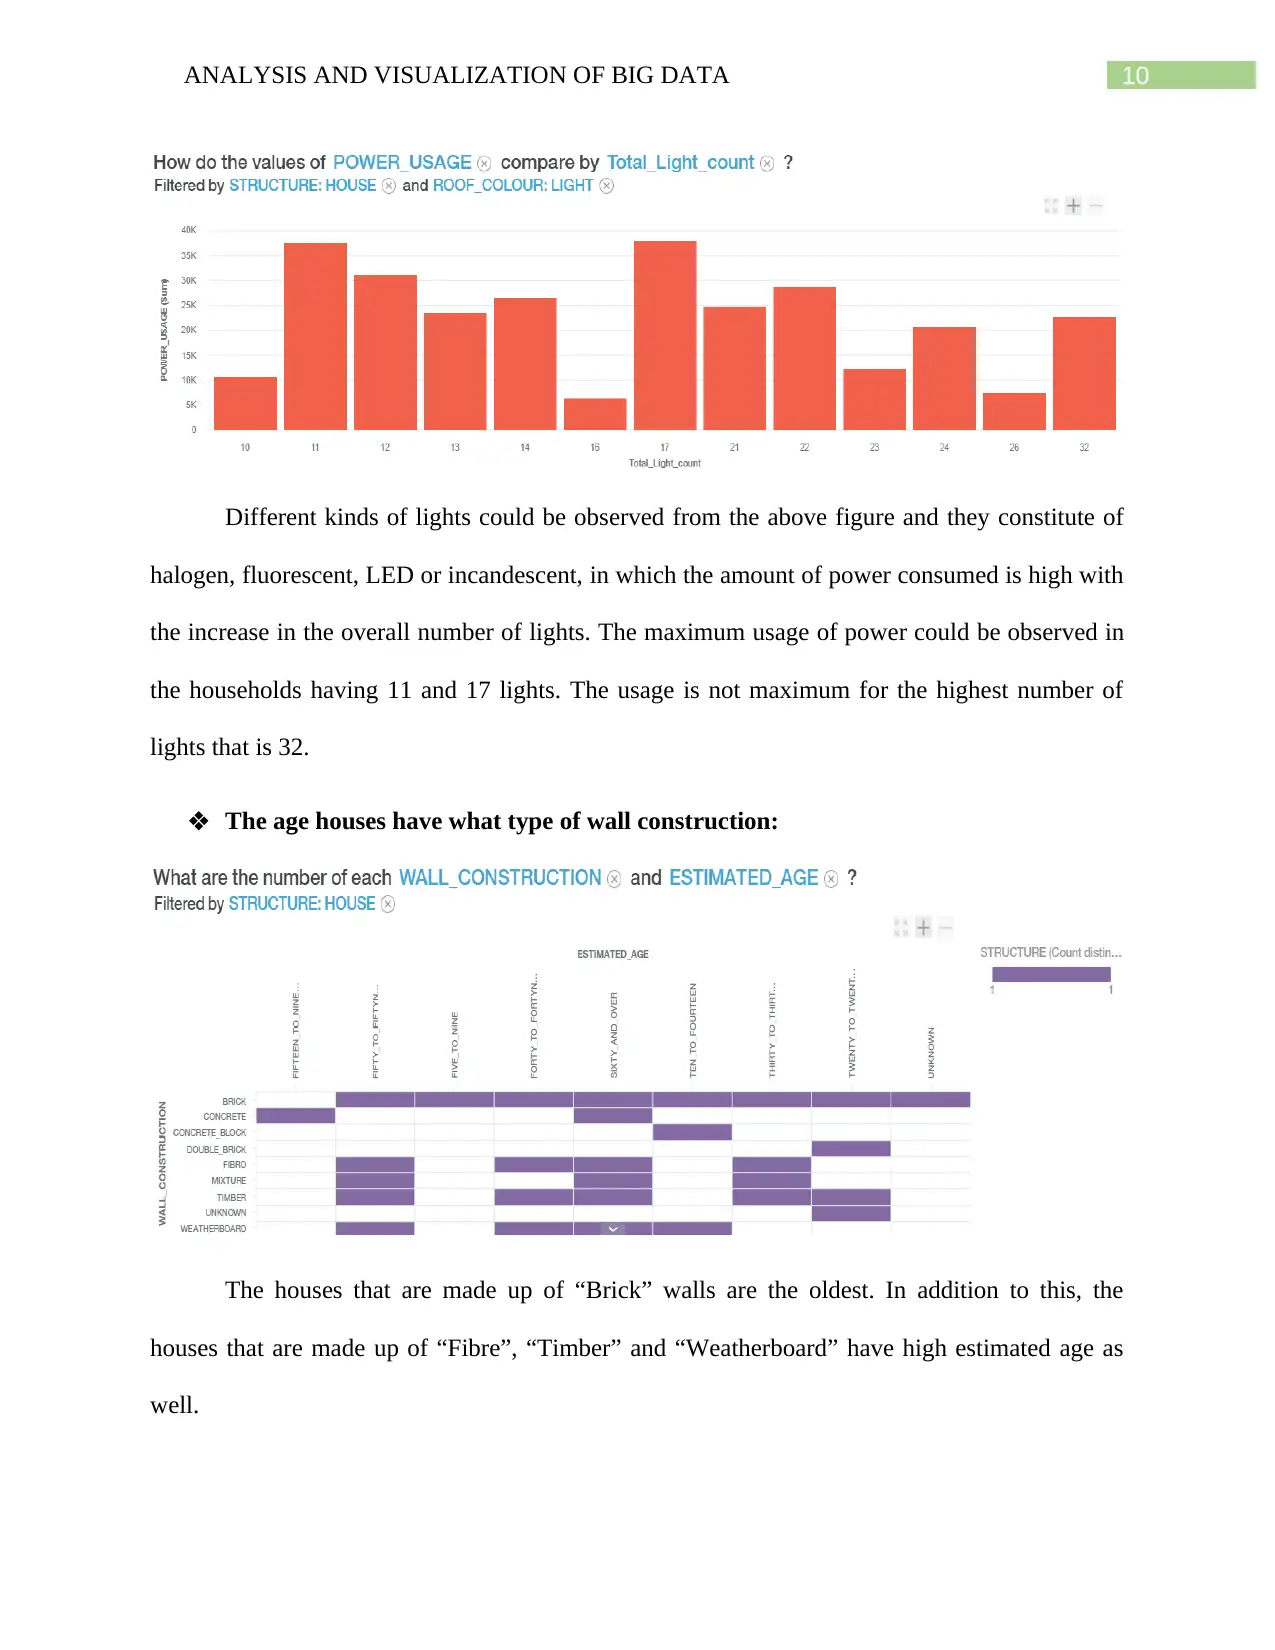
Different kinds of lights could be observed from the above figure and they constitute of
halogen, fluorescent, LED or incandescent, in which the amount of power consumed is high with
the increase in the overall number of lights. The maximum usage of power could be observed in
the households having 11 and 17 lights. The usage is not maximum for the highest number of
lights that is 32.
The age houses have what type of wall construction:
The houses that are made up of “Brick” walls are the oldest. In addition to this, the
houses that are made up of “Fibre”, “Timber” and “Weatherboard” have high estimated age as
well.
11ANALYSIS AND VISUALIZATION OF BIG DATA
The age houses and from which areas and with how many bedrooms use the most
power:
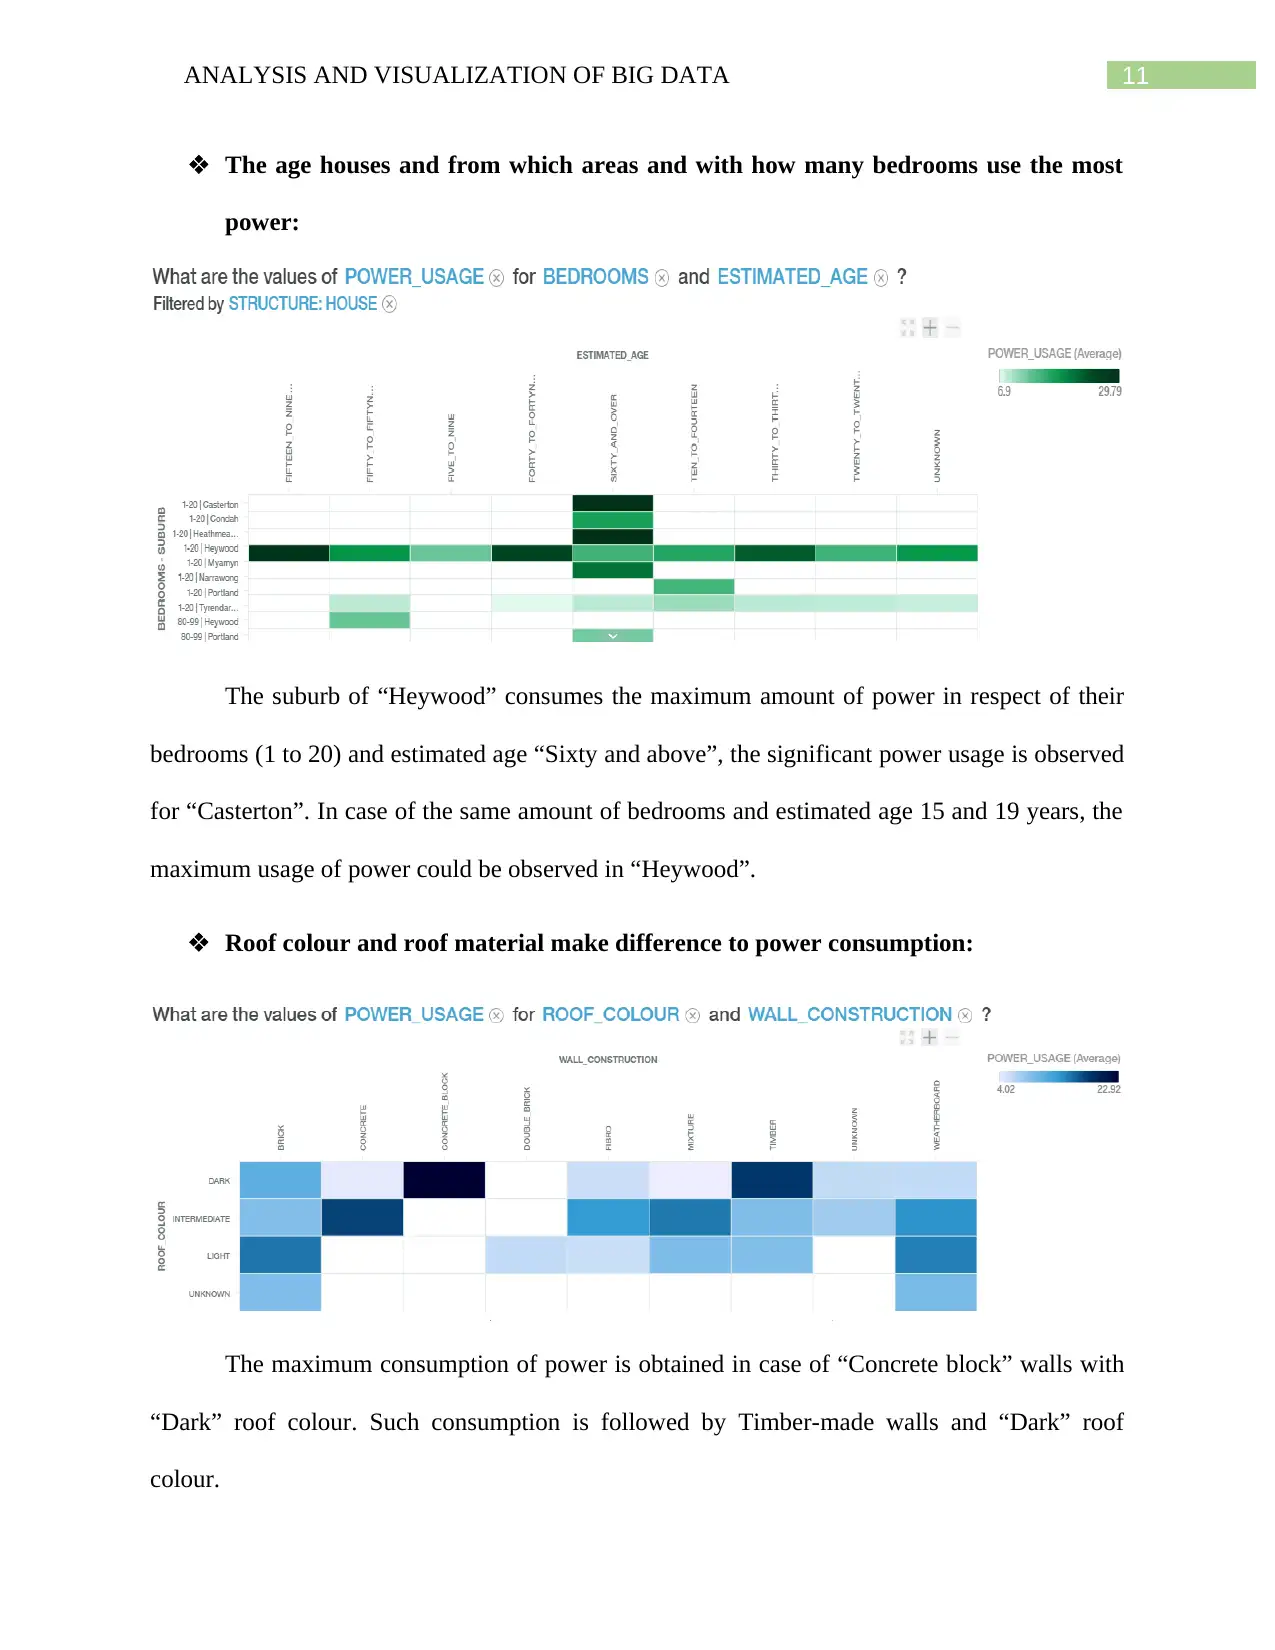
The suburb of “Heywood” consumes the maximum amount of power in respect of their
bedrooms (1 to 20) and estimated age “Sixty and above”, the significant power usage is observed
for “Casterton”. In case of the same amount of bedrooms and estimated age 15 and 19 years, the
maximum usage of power could be observed in “Heywood”.
Roof colour and roof material make difference to power consumption:
The maximum consumption of power is obtained in case of “Concrete block” walls with
“Dark” roof colour. Such consumption is followed by Timber-made walls and “Dark” roof
colour.
The age houses and from which areas and with how many bedrooms use the most
power:
The suburb of “Heywood” consumes the maximum amount of power in respect of their
bedrooms (1 to 20) and estimated age “Sixty and above”, the significant power usage is observed
for “Casterton”. In case of the same amount of bedrooms and estimated age 15 and 19 years, the
maximum usage of power could be observed in “Heywood”.
Roof colour and roof material make difference to power consumption:
The maximum consumption of power is obtained in case of “Concrete block” walls with
“Dark” roof colour. Such consumption is followed by Timber-made walls and “Dark” roof
colour.
12ANALYSIS AND VISUALIZATION OF BIG DATA
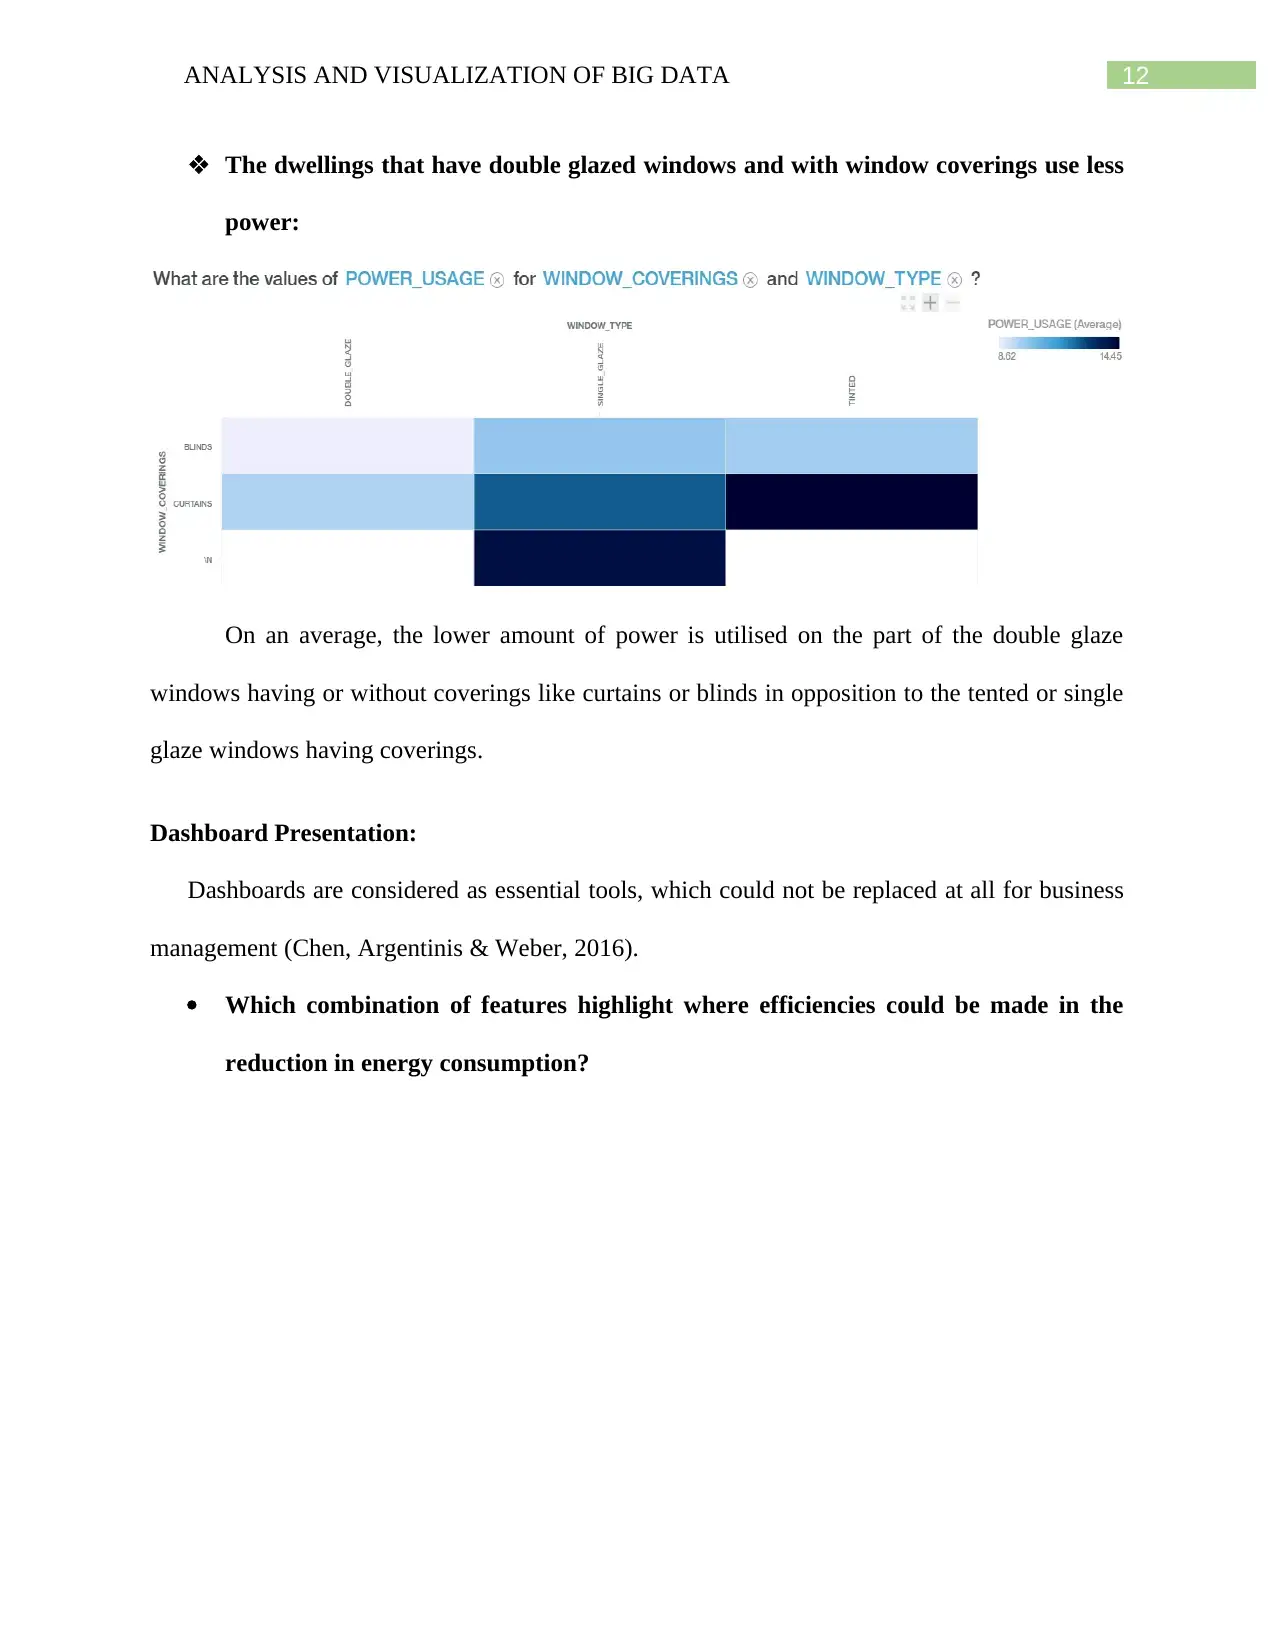
The dwellings that have double glazed windows and with window coverings use less
power:
On an average, the lower amount of power is utilised on the part of the double glaze
windows having or without coverings like curtains or blinds in opposition to the tented or single
glaze windows having coverings.
Dashboard Presentation:
Dashboards are considered as essential tools, which could not be replaced at all for business
management (Chen, Argentinis & Weber, 2016).
Which combination of features highlight where efficiencies could be made in the
reduction in energy consumption?
Paraphrase This Document
Need a fresh take? Get an instant paraphrase of this document with our AI Paraphraser
13ANALYSIS AND VISUALIZATION OF BIG DATA
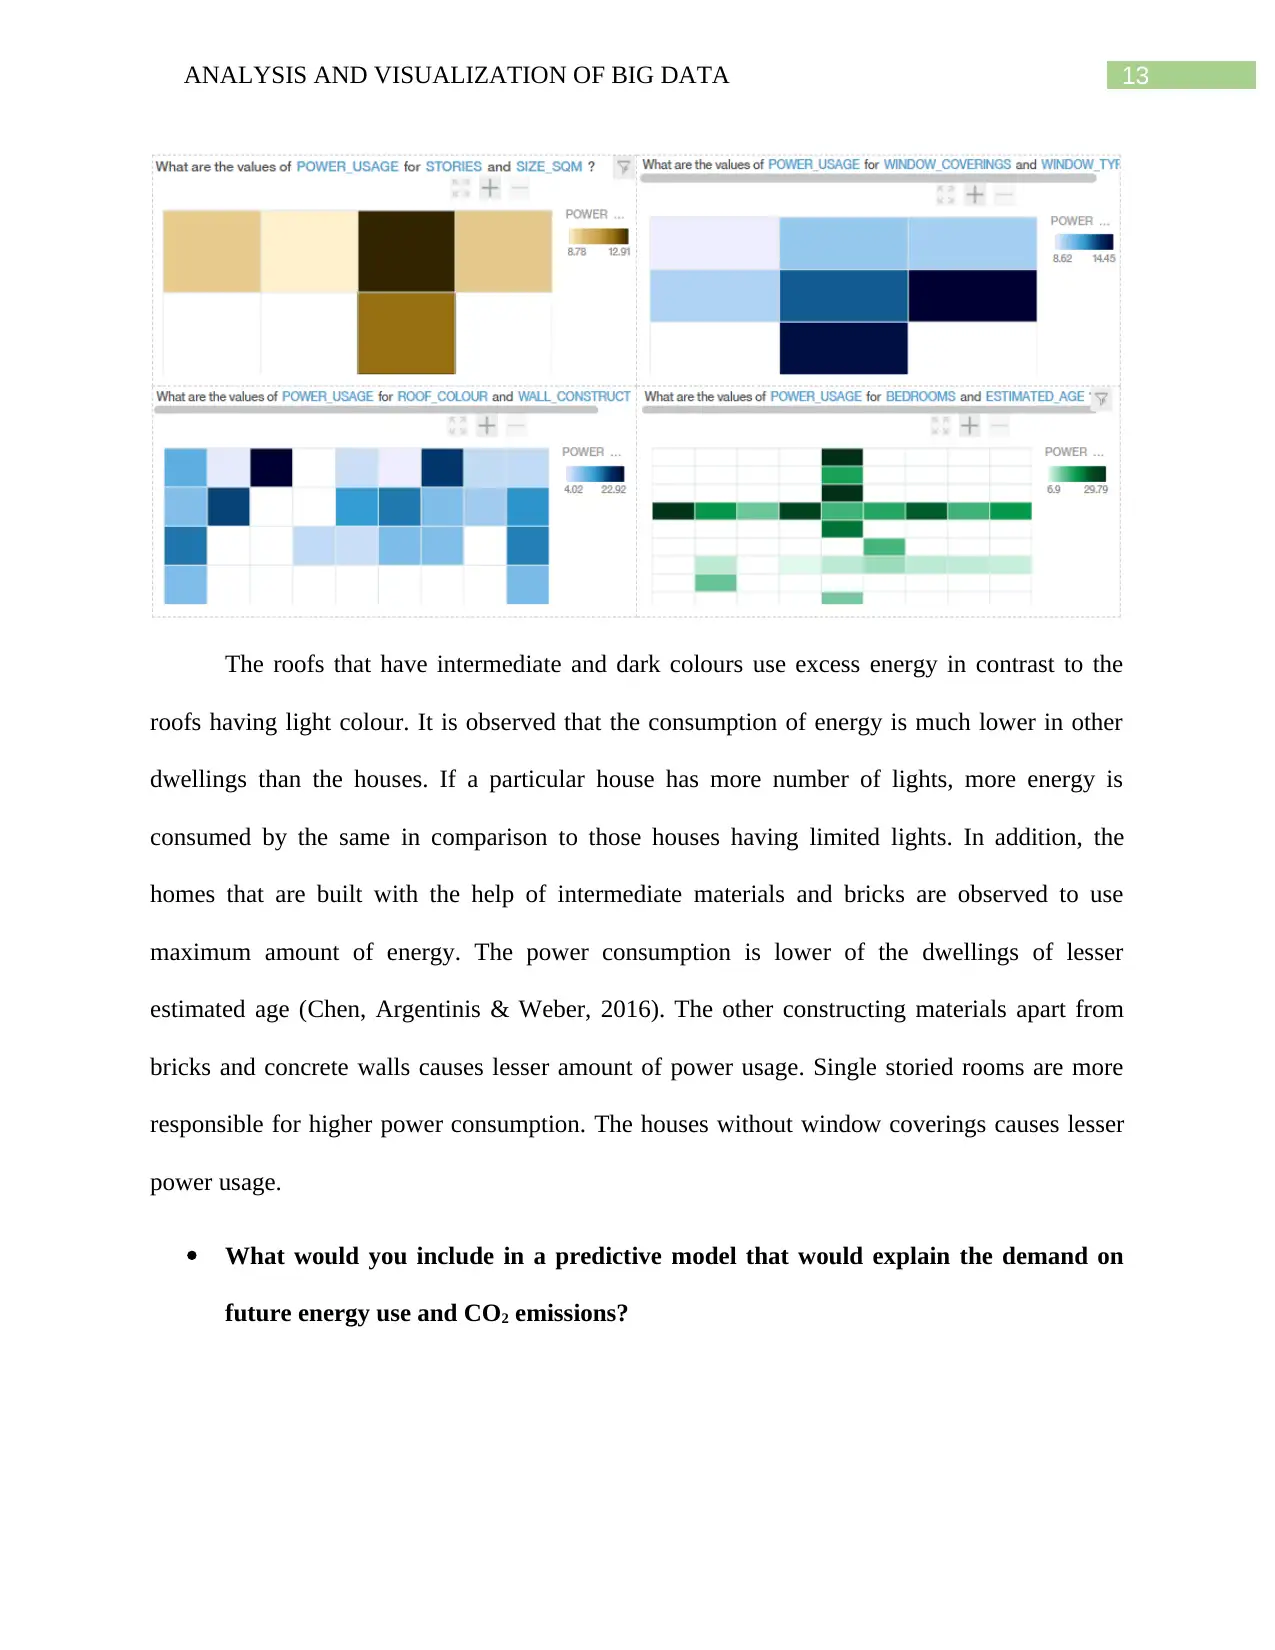
The roofs that have intermediate and dark colours use excess energy in contrast to the
roofs having light colour. It is observed that the consumption of energy is much lower in other
dwellings than the houses. If a particular house has more number of lights, more energy is
consumed by the same in comparison to those houses having limited lights. In addition, the
homes that are built with the help of intermediate materials and bricks are observed to use
maximum amount of energy. The power consumption is lower of the dwellings of lesser
estimated age (Chen, Argentinis & Weber, 2016). The other constructing materials apart from
bricks and concrete walls causes lesser amount of power usage. Single storied rooms are more
responsible for higher power consumption. The houses without window coverings causes lesser
power usage.
What would you include in a predictive model that would explain the demand on
future energy use and CO2 emissions?
14ANALYSIS AND VISUALIZATION OF BIG DATA
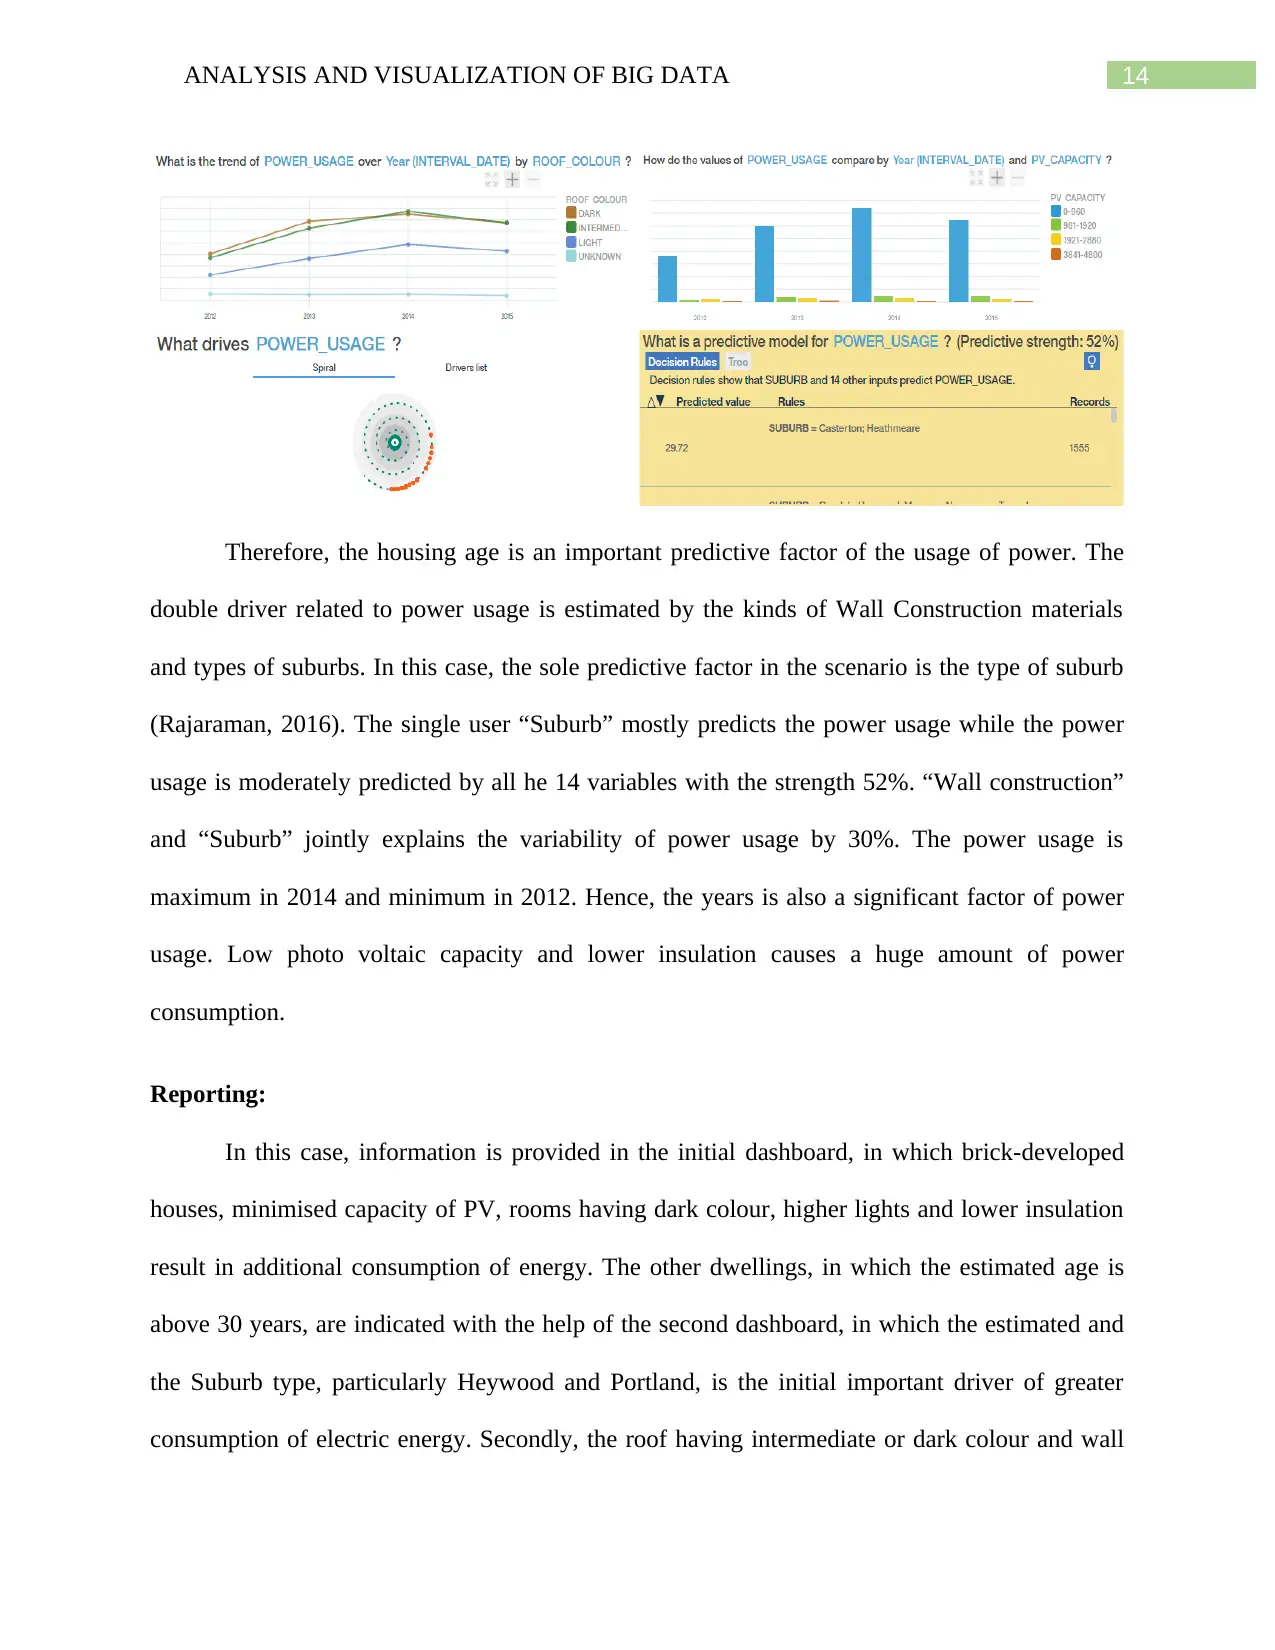
Therefore, the housing age is an important predictive factor of the usage of power. The
double driver related to power usage is estimated by the kinds of Wall Construction materials
and types of suburbs. In this case, the sole predictive factor in the scenario is the type of suburb
(Rajaraman, 2016). The single user “Suburb” mostly predicts the power usage while the power
usage is moderately predicted by all he 14 variables with the strength 52%. “Wall construction”
and “Suburb” jointly explains the variability of power usage by 30%. The power usage is
maximum in 2014 and minimum in 2012. Hence, the years is also a significant factor of power
usage. Low photo voltaic capacity and lower insulation causes a huge amount of power
consumption.
Reporting:
In this case, information is provided in the initial dashboard, in which brick-developed
houses, minimised capacity of PV, rooms having dark colour, higher lights and lower insulation
result in additional consumption of energy. The other dwellings, in which the estimated age is
above 30 years, are indicated with the help of the second dashboard, in which the estimated and
the Suburb type, particularly Heywood and Portland, is the initial important driver of greater
consumption of electric energy. Secondly, the roof having intermediate or dark colour and wall
15ANALYSIS AND VISUALIZATION OF BIG DATA
construction kinds like weatherboard or bricks cause waste of additional energy. Another
important estimation related to consumption of energy is an important estimator of the type of
Suburb. Finally, the spiral dashboard chart denotes that Wall Construction and Suburb type are
two significant combined drivers and the Suburb type and dwelling follow them.
With the help of dashboard, it is possible to carry out grouping, accumulation,
visualisation and organising of research project for gaining an insight of expectations, well-being
and basic level actual situation (Tsoi et al., 2018). Therefore, dashboards help in effective
indication like tools used for tracking metric and advanced solutions related to business
intelligence of real time so that informed decisions could be undertaken to accomplish future
targets (Kambatla et al., 2014).
Recommendation:
Particularly, the buildings developed with the help of bricks and concrete blocks in
“Heywood” and “Portland” suburbs use greater electric energy consumption. The officials
involved in the project need to concentrate regarding the increasing consciousness of individuals
in the regions. Moreover, the project team needs to recommend the individuals in redeveloping
the older buildings to new ones, since the buildings having greater projected age results in higher
consumption of electric energy. Such consumption of high energy has impact on environment in
the form of emission of carbon dioxide (Vogel et al., 2014). Based on the above evaluation, it is
to be borne in mind that the stakeholders and the project managers need to keep track of the
rooms with dark colour having lower capacity of PV would use additional electric energy in near
future. The light coloured roof without window coverings is preferable. Not only that, the
dwellings with higher insulation of small size rooms are to be adopted by the concerned people.
Secure Best Marks with AI Grader
Need help grading? Try our AI Grader for instant feedback on your assignments.
16ANALYSIS AND VISUALIZATION OF BIG DATA
Reflection:
From this study, it has been found that there are various causes and importance for
consumption of electric energy of various suburbs. In addition, the report covers brief overview
of the trend as well as consumption of energy year by year. As a result, adequate elaboration has
been provided regarding the two formulated research questions. Moreover, the effective
recommendations have been provided from the perspectives of the stakeholders as well as the
project managers. The accumulation of data for evaluation has consumed plenty of time and it is
a laborious task (Wakeling et al., 2015). This has been evaluated with the help of team analysis
and officials’ contribution enabled in representing the actual scenario along with reasons of
wastage of energy and heavy emission of carbon dioxide in a clear manner. The group evaluation
has been strengthened further with the help of digital dashboards (Zakir, Seymour & Berg,
2015). Finally, IBM Watson Analytics is selected as the technique of data analysis for arriving at
the final outcome.
17ANALYSIS AND VISUALIZATION OF BIG DATA
References:
Campbell, K. M., Nonez, R. Y., Saha, B., & Zhong, X. S. (2015). U.S. Patent No. 8,957,908.
Washington, DC: U.S. Patent and Trademark Office.
Chen, Y., Argentinis, J. E., & Weber, G. (2016). IBM Watson: how cognitive computing can be
applied to big data challenges in life sciences research. Clinical therapeutics, 38(4), 688-701.
Derico, A., Leader, A. C., Kather, R., Engineer, O. S. A., & West, D. (2017). Make Data Simple:
IBM Watson Data Platform & Data Science Experience.
Hoyt, R. E., Snider, D., Thompson, C., & Mantravadi, S. (2016). IBM Watson analytics:
automating visualization, descriptive, and predictive statistics. JMIR public health and
surveillance, 2(2).
Joshi, K., Masurkar, S., Tawde, A., & Gharat, J. (2017). Business Intelligence (BI) Dashboard
Utility.
Kambatla, K., Kollias, G., Kumar, V., & Grama, A. (2014). Trends in big data analytics. Journal
of Parallel and Distributed Computing, 74(7), 2561-2573.
Rajaraman, V. (2016). Big data analytics. Resonance, 21(8), 695-716.
Tsai, C. W., Lai, C. F., Chao, H. C., & Vasilakos, A. V. (2016). Big data analytics. In Big Data
Technologies and Applications(pp. 13-52). Springer, Cham.
Tsoi, K. K., Chan, F. C., Hirai, H. W., Keung, G. K., Kuo, Y. H., Tai, S., & Meng, H. M. (2018).
Data Visualization with IBM Watson Analytics for Global Cancer Trends Comparison from
World Health Organization. International Journal of Healthcare Information Systems and
Informatics (IJHISI), 13(1), 45-54.
18ANALYSIS AND VISUALIZATION OF BIG DATA
Vogel, A., Hehn, D., Zietzschmann, M., Kunstein, A.M., Henkel, S., Gottlieb, S., Tsognov, A. &
Maier, S., SAP, SE. (2014). Personalized dashboard architecture for displaying data display
applications. U.S. Patent 8,713,446.
Wakeling, S., Clough, P. D., Wyper, J., & Balmain, A. (2015). Graph literacy and business
intelligence: Investigating user understanding of dashboard data visualizations. Business
Intelligence Journal, 20(4), 8-19.
Zakir, J., Seymour, T., & Berg, K. (2015). BIG DATA ANALYTICS. Issues in Information
Systems, 16(2).
1 out of 19


Your All-in-One AI-Powered Toolkit for Academic Success.
+13062052269
info@desklib.com
Available 24*7 on WhatsApp / Email
![[object Object]](/_next/static/media/star-bottom.7253800d.svg)
Unlock your academic potential
© 2024 | Zucol Services PVT LTD | All rights reserved.