Analytics: Questions with Answers
Added on 2023-03-30
13 Pages1710 Words92 Views
Analytics 1
Business Analytics
Name of Author
Name of Class
Name of Professor
Name of School
State and City of School
Date
Business Analytics
Name of Author
Name of Class
Name of Professor
Name of School
State and City of School
Date
Analytics 2
Questions with Answers
Solution 1
There will be two explanations of how the confusion matrix is used in classification.
a. In a case where there is an unequal number of observations or maybe if the observations
are more than two, there can be a misleading sense when trying out your classification
accuracy. This, therefore, requires the confusion matrix which is proficiency for
recapitulating the effectiveness of a classification or categorization algorithm.
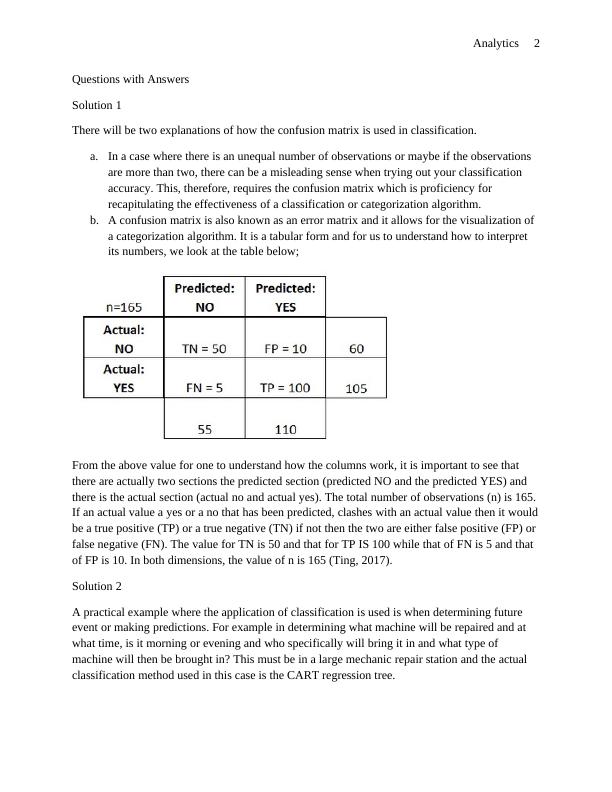
b. A confusion matrix is also known as an error matrix and it allows for the visualization of
a categorization algorithm. It is a tabular form and for us to understand how to interpret
its numbers, we look at the table below;
From the above value for one to understand how the columns work, it is important to see that
there are actually two sections the predicted section (predicted NO and the predicted YES) and
there is the actual section (actual no and actual yes). The total number of observations (n) is 165.
If an actual value a yes or a no that has been predicted, clashes with an actual value then it would
be a true positive (TP) or a true negative (TN) if not then the two are either false positive (FP) or
false negative (FN). The value for TN is 50 and that for TP IS 100 while that of FN is 5 and that
of FP is 10. In both dimensions, the value of n is 165 (Ting, 2017).
Solution 2
A practical example where the application of classification is used is when determining future
event or making predictions. For example in determining what machine will be repaired and at
what time, is it morning or evening and who specifically will bring it in and what type of
machine will then be brought in? This must be in a large mechanic repair station and the actual
classification method used in this case is the CART regression tree.
Questions with Answers
Solution 1
There will be two explanations of how the confusion matrix is used in classification.
a. In a case where there is an unequal number of observations or maybe if the observations
are more than two, there can be a misleading sense when trying out your classification
accuracy. This, therefore, requires the confusion matrix which is proficiency for
recapitulating the effectiveness of a classification or categorization algorithm.
b. A confusion matrix is also known as an error matrix and it allows for the visualization of
a categorization algorithm. It is a tabular form and for us to understand how to interpret
its numbers, we look at the table below;
From the above value for one to understand how the columns work, it is important to see that
there are actually two sections the predicted section (predicted NO and the predicted YES) and
there is the actual section (actual no and actual yes). The total number of observations (n) is 165.
If an actual value a yes or a no that has been predicted, clashes with an actual value then it would
be a true positive (TP) or a true negative (TN) if not then the two are either false positive (FP) or
false negative (FN). The value for TN is 50 and that for TP IS 100 while that of FN is 5 and that
of FP is 10. In both dimensions, the value of n is 165 (Ting, 2017).
Solution 2
A practical example where the application of classification is used is when determining future
event or making predictions. For example in determining what machine will be repaired and at
what time, is it morning or evening and who specifically will bring it in and what type of
machine will then be brought in? This must be in a large mechanic repair station and the actual
classification method used in this case is the CART regression tree.
Analytics 3
The next scenario is in the classification of what marks will be scored by what student who is
newly introduced into the class based on a set of predictive entries. The method that is used in
this scenario is KNN clustering.
Solution 3
Oversampling is a method which is applied on a dataset in the sense to correct cases where the
chances of success of a dataset are very low. This happens in an imbalanced dataset. Examples of
areas that we are to discuss here are for example the credit card usage frauds and the next one is
the manufacturing defects where there is a very low percentage of acceptance compared to the
total number of products that are produced. As you have seen there is a very small percentage of
the minority class in such scenarios. This case requires oversampling and in this case, the
percentage of the minority class is to be raised by replication. In this case, there will be no
information loss. The effect that is with this type of creating a balanced dataset is that it is prone
to overfitting as it involves copying and recopying the same data points (Abdi and Hashemi,
2015).
Solution 4
The explanatory variables and the categorical variables can be represented in numbers and this
basically is what logistic regression totally understands and runs easily. Looking at the
explanatory variable there are low, average and high entries and these can be codded with 1, 2
and three respectively whereas the data entries for variable X2 is marked by numbers 4, 5 and 6
respectively. There will be a total of two coefficients whereby one represents the coefficient for
the dependent variable and one is the y-intercept.
Solution 5
Starting from the predictor variables, we have five predictor variables in total. These will be the
variables that will be used in predicting the types of customers that would spend more than
$1000. These variables are; Age, Gender, Family size, Membership, Discount card type. The
Age variable has empty cells that need to be filled in order to help run the accurate analysis. The
method used to fill the cells is the above function in excel.
Steps
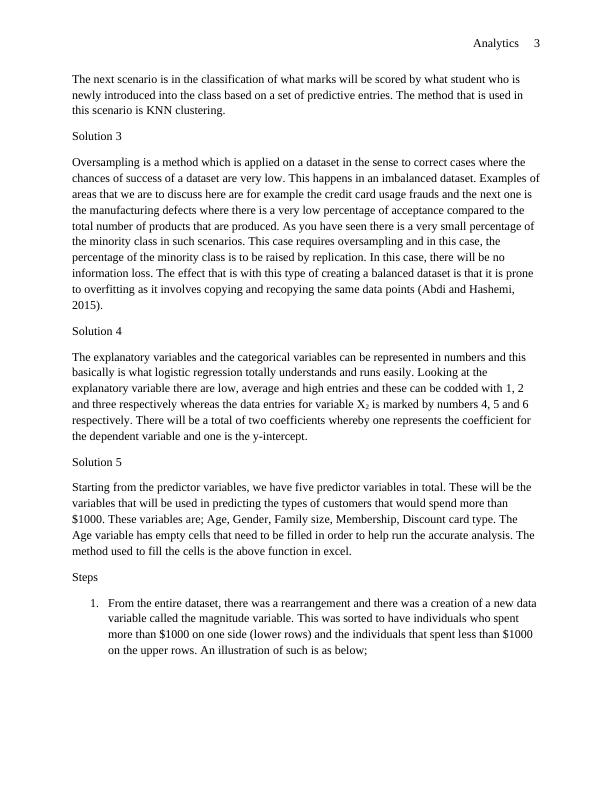
1. From the entire dataset, there was a rearrangement and there was a creation of a new data
variable called the magnitude variable. This was sorted to have individuals who spent
more than $1000 on one side (lower rows) and the individuals that spent less than $1000
on the upper rows. An illustration of such is as below;
The next scenario is in the classification of what marks will be scored by what student who is
newly introduced into the class based on a set of predictive entries. The method that is used in
this scenario is KNN clustering.
Solution 3
Oversampling is a method which is applied on a dataset in the sense to correct cases where the
chances of success of a dataset are very low. This happens in an imbalanced dataset. Examples of
areas that we are to discuss here are for example the credit card usage frauds and the next one is
the manufacturing defects where there is a very low percentage of acceptance compared to the
total number of products that are produced. As you have seen there is a very small percentage of
the minority class in such scenarios. This case requires oversampling and in this case, the
percentage of the minority class is to be raised by replication. In this case, there will be no
information loss. The effect that is with this type of creating a balanced dataset is that it is prone
to overfitting as it involves copying and recopying the same data points (Abdi and Hashemi,
2015).
Solution 4
The explanatory variables and the categorical variables can be represented in numbers and this
basically is what logistic regression totally understands and runs easily. Looking at the
explanatory variable there are low, average and high entries and these can be codded with 1, 2
and three respectively whereas the data entries for variable X2 is marked by numbers 4, 5 and 6
respectively. There will be a total of two coefficients whereby one represents the coefficient for
the dependent variable and one is the y-intercept.
Solution 5
Starting from the predictor variables, we have five predictor variables in total. These will be the
variables that will be used in predicting the types of customers that would spend more than
$1000. These variables are; Age, Gender, Family size, Membership, Discount card type. The
Age variable has empty cells that need to be filled in order to help run the accurate analysis. The
method used to fill the cells is the above function in excel.
Steps
1. From the entire dataset, there was a rearrangement and there was a creation of a new data
variable called the magnitude variable. This was sorted to have individuals who spent
more than $1000 on one side (lower rows) and the individuals that spent less than $1000
on the upper rows. An illustration of such is as below;
Analytics 4
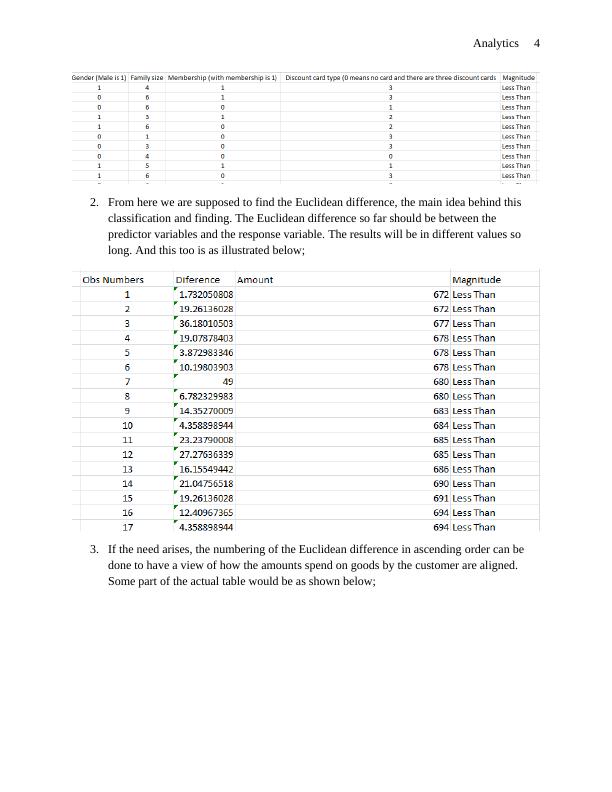
2. From here we are supposed to find the Euclidean difference, the main idea behind this
classification and finding. The Euclidean difference so far should be between the
predictor variables and the response variable. The results will be in different values so
long. And this too is as illustrated below;
3. If the need arises, the numbering of the Euclidean difference in ascending order can be
done to have a view of how the amounts spend on goods by the customer are aligned.
Some part of the actual table would be as shown below;
End of preview
Want to access all the pages? Upload your documents or become a member.
Related Documents
Business Analytics Assignment (Solved)lg...
|12
|1793
|236
A confusion matrix is a table that is often used to describe thelg...
|2
|302
|301
Weka: Data Mining and Machine Learning Topic 2022lg...
|13
|1214
|16
Constraint : Monotone or Anti-monotone Convertiblelg...
|10
|1582
|23
Business Analytics Assignment Samplelg...
|27
|3864
|76
FIT 3152: Data Analytics Assignmentlg...
|29
|3405
|427