logo

Analyzing the Macroeconomic Performance of Australia

23 Pages4820 Words68 Views
   

Added on  2023-01-04

About This Document

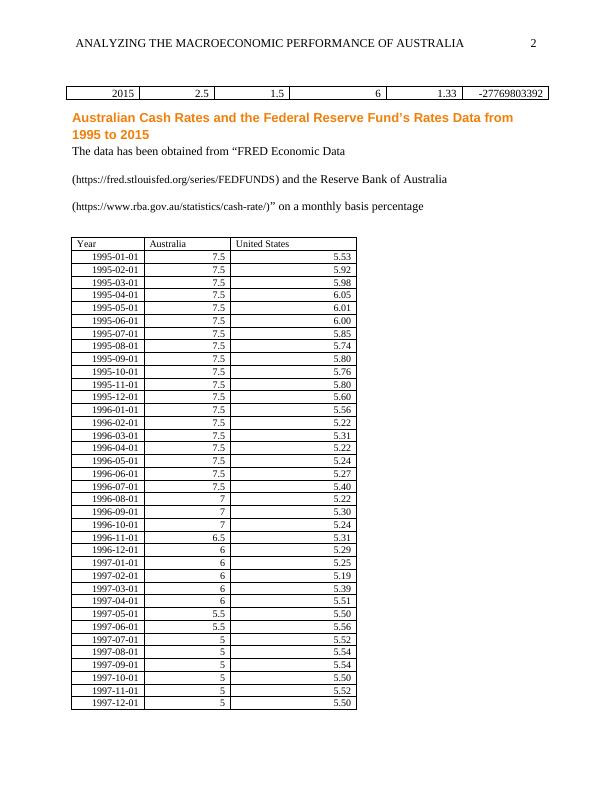
This report analyzes the macroeconomic performance of Australia by evaluating its various macroeconomic indicators such as real GDP growth rate, inflation, unemployment, and exchange rates. It discusses the country's economic performance, its ranking in the Asia-Pacific region, and the factors contributing to its success. The report also provides data on key macroeconomic indicators from 1995 to 2015 and examines the relationship between these indicators. Based on the analysis, the report concludes that Australia's economic performance is good and predicts better results in the future.

Analyzing the Macroeconomic Performance of Australia

   Added on 2023-01-04

ShareRelated Documents
ANALYZING THE MACROECONOMIC PERFORMANCE OF AUSTRALIA i
ANALYZING THE MACROECONOMIC PERFORMANCE OF AUSTRALIA
Student Name
Institution Affiliation
Facilitator
Course
Date
Analyzing the Macroeconomic Performance of Australia_1
ANALYZING THE MACROECONOMIC PERFORMANCE OF AUSTRALIA ii
Executive Summary
Australia is among the wealthier nations not only in the region of Asia-Pacific but also in the
whole world. It is among the world top richest economies and consists of a large economy which
is a mixed-market in nature (Groenewegen and McFarlane 2014, p.69). The Australian economy
is open in most of its sectors and hence the nation embraces a free economy. In accordance with
the 2019 Index, Australia is ranked position 5 considering the economic freedom performance
with a score of more than 80. The nation has continued to maintain its excellent scores in labor
and trade freedom, fiscal health and government integrity but its efficiency of the judiciary has
declined to some extent as compared to that of the previous years. In terms of economic
performance, Australia has been performing well for the last decade recording positive economic
growth rates though at reduced rates for some years. The nation has shown great resilient to
unfavorable economic conditions and even during the 2008 to 2009 global financial crisis, the
nation was able to keep its economic growth rate positive as compared to many economies
around the world. Considering the Asia-Pacific region, Australia among the 43 nations in the
region, is ranked position 4 in terms of economic performance. The Australian economic
performance has been kept above the expected average performance both at the regional as well
as the world level. This has been possible due to its sound economic policies which foster the
nation’s economic activity and its highly skilled readily available labor force (Courvisanos, Jain
and Mardaneh 2016, p.629). The nation’s viable business environment has continued to attract
many investors into the economy both domestically and internationally (Simon 2010, p.47). This
report has analyzed the Australian economic performance by evaluating its various
macroeconomic indicators which include the real gross domestic product growth rate and the
Analyzing the Macroeconomic Performance of Australia_2
ANALYZING THE MACROECONOMIC PERFORMANCE OF AUSTRALIA iii
inflation, unemployment and exchange rates. Based on the analyzed macroeconomic indicators,
the Australian economic performance is good and better results are anticipated in the future.
Analyzing the Macroeconomic Performance of Australia_3
ANALYZING THE MACROECONOMIC PERFORMANCE OF AUSTRALIA iv
Table of Contents
Executive Summary.........................................................................................................................ii
Australian Key Macroeconomic Indicators Data from 1995 to 2015..............................................1
Australian Data on Real GDP Growth Rates, Inflation Rates, Unemployment Rates, Exchange
Rates and Net Exports Data from 1995 to 2015..........................................................................1
Australian Cash Rates and the Federal Reserve Fund’s Rates Data from 1995 to 2015.............2
Australian Real GDP Growth Rates and Inflation Rates Relationship............................................7
Australian Real GDP Growth Rates and Unemployment Rates Relationship..............................10
Australian Net Exports and the Exchange Rates against the US dollar Relationship...................12
Australian Cash Rates and the Federal Reserve Fund’s Rates Relationship.................................14
Economic Explanations Based on the Report................................................................................15
A prediction of the Australian Macroeconomic Outlook..............................................................16
Conclusion.....................................................................................................................................16
References......................................................................................................................................18
Analyzing the Macroeconomic Performance of Australia_4
ANALYZING THE MACROECONOMIC PERFORMANCE OF AUSTRALIA 1
Australian Key Macroeconomic Indicators Data from 1995 to 2015
Australian Data on Real GDP Growth Rates, Inflation Rates, Unemployment
Rates, Exchange Rates and Net Exports Data from 1995 to 2015
The Real GDP data has been obtained from the “International Monetary Fund
(https://www.imf.org/external/datamapper/NGDP_RPCH@WEO/OEMDC/ADVEC/WEOWORLD),
Inflation Rates from International Monetary Fund
(https://www.imf.org/external/datamapper/PCPIPCH@WEO/OEMDC/AUS), Unemployment Rates
from International Monetary Fund
(https://www.imf.org/external/datamapper/LUR@WEO/OEMDC/ADVEC/WEOWORLD), Exchange
Rates from World Bank (https://data.worldbank.org/indicator/pa.nus.fcrf), and Net Exports from
World Bank (https://data.worldbank.org/indicator/BN.GSR.GNFS.CD?view=chart)”.
Year
Real GDP
Growth Rate
(Annual %)
Inflation
Rates (Annual
%)
Unemployment
Rate (Annual %)
Exchange
Rate against
the US Dollar
Net Exports
Value ($)
1995 2.8 4.6 8.5 1.35 -5240428241
1996 4.2 2.7 8.5 1.28 -533267382.7
1997 4.6 0.2 8.4 1.35 1646368836
1998 4.7 0.9 7.7 1.59 -6467569674
1999 4.4 1.4 6.9 1.55 -10082425327
2000 3 4.5 6.3 1.72 -4278715480
2001 2.6 4.4 6.8 1.93 2098010276
2002 4.2 3 6.4 1.84 -4719220381
2003 2.7 2.7 5.9 1.54 -14416671533
2004 4.3 2.3 5.4 1.36 -19188702455
2005 2.9 2.7 5 1.31 -14812982447
2006 2.8 3.6 4.8 1.33 -12281113878
2007 4.4 2.4 4.4 1.20 -22837087761
2008 2.7 4.3 4.3 1.19 -13745224204
2009 1.9 1.8 5.6 1.28 -10035658716
2010 2.4 2.9 5.2 1.09 6185600684
2011 2.8 3.4 5.1 0.97 12563182829
2012 3.9 1.7 5.2 0.97 -21442502739
2013 2.1 2.5 5.7 1.04 -7420878112
2014 2.6 2.5 6.1 1.11 -9083612608
Analyzing the Macroeconomic Performance of Australia_5
ANALYZING THE MACROECONOMIC PERFORMANCE OF AUSTRALIA 2
2015 2.5 1.5 6 1.33 -27769803392
Australian Cash Rates and the Federal Reserve Fund’s Rates Data from
1995 to 2015
The data has been obtained from “FRED Economic Data
(https://fred.stlouisfed.org/series/FEDFUNDS) and the Reserve Bank of Australia
(https://www.rba.gov.au/statistics/cash-rate/)” on a monthly basis percentage
Year Australia United States
1995-01-01 7.5 5.53
1995-02-01 7.5 5.92
1995-03-01 7.5 5.98
1995-04-01 7.5 6.05
1995-05-01 7.5 6.01
1995-06-01 7.5 6.00
1995-07-01 7.5 5.85
1995-08-01 7.5 5.74
1995-09-01 7.5 5.80
1995-10-01 7.5 5.76
1995-11-01 7.5 5.80
1995-12-01 7.5 5.60
1996-01-01 7.5 5.56
1996-02-01 7.5 5.22
1996-03-01 7.5 5.31
1996-04-01 7.5 5.22
1996-05-01 7.5 5.24
1996-06-01 7.5 5.27
1996-07-01 7.5 5.40
1996-08-01 7 5.22
1996-09-01 7 5.30
1996-10-01 7 5.24
1996-11-01 6.5 5.31
1996-12-01 6 5.29
1997-01-01 6 5.25
1997-02-01 6 5.19
1997-03-01 6 5.39
1997-04-01 6 5.51
1997-05-01 5.5 5.50
1997-06-01 5.5 5.56
1997-07-01 5 5.52
1997-08-01 5 5.54
1997-09-01 5 5.54
1997-10-01 5 5.50
1997-11-01 5 5.52
1997-12-01 5 5.50
Analyzing the Macroeconomic Performance of Australia_6

End of preview

Want to access all the pages? Upload your documents or become a member.

Related Documents
Analysis of Australian Macroeconomic Performance
|25
|5048
|20

Macroeconomics Performance of Australia
|14
|4190
|34

Evaluation of Macroeconomic Performance of Australia and New Zealand
|16
|3932
|350

Comparative Analysis of Macroeconomic Performance of Australia and USA
|21
|4999
|495

The Current Australian Macro-Economy Analysis
|15
|3308
|57

Economics Assignment: GDP Growth
|22
|4253
|230