Analysis of Australian Macroeconomic Performance
Added on 2023-01-03
25 Pages5048 Words20 Views
AUSTRALIAN MACROECONOMIC PERFORMANCE i
AN ANALYSIS OF THE AUSTRALIAN MACROECONOMIC PERFORMANCE
Student Name
Institution Affiliation
Facilitator
Course
Date
AN ANALYSIS OF THE AUSTRALIAN MACROECONOMIC PERFORMANCE
Student Name
Institution Affiliation
Facilitator
Course
Date
AUSTRALIAN MACROECONOMIC PERFORMANCE ii
Executive Summary
The Australian economy is among the largest and richest economies in the world. Australian is
situated in the Asia-Pacific which has 43 nations. Australia highly embraces business, trade,
monetary, labor, investment and financial freedom which reflect the level of trade freedom in the
nation (Uy, Yi and Zhang 2013, p.667). Australia occupies position 5 according to the 2019
Index in terms of economic freedom having a score of 80.9. Trade and labor freedom, as well as
government integrity and fiscal health, have highly improved hence maintaining the nation’s
score of economic freedom while its efficiency of the judiciary slightly deteriorated. Australia
has been experiencing economic growth almost for the last decade and also the nation was lucky
enough to record a positive economic growth though at a reduced rate during the 2008 to 2009
global financial crisis (Kenc and Dibooglu 2010, p.3). The nation has a current economic growth
of 2.3 percent which is relatively a good economic growth as compared to many nations. In
terms of economic performance, Australia occupies position 4 out of the 43 nations in the region
of Asia-Pacific. Australian sound macroeconomic goals and policies, as well as highly skilled
labor force, have highly contributed towards the nation’s better economic performance and hence
the nation remains a center of attraction for many investors both domestically and internationally
(McDonald and Morling 2011, p.1). The Australian economic performance is well above that
anticipated both at the regional and world levels. In this report, an analysis of the Australian
macroeconomic performance has been done based on various macroeconomic indicators which
include unemployment, inflation and exchange rates as well as the real gross domestic product
growth rate has been done. The overall macroeconomic performance assists existing businesses,
the government and also the prospective investors to make their goals with great certainty.
AUSTRALIAN MACROECONOMIC PERFORMANCE iii
Table of Contents
Executive Summary....................................................................................................................................ii
Australian macroeconomic data from the year 1995 to 2015.......................................................................1
Australian Real Gross Domestic Product Growth Rates from 1995 to 2015............................................1
Australian Inflation Rates for the period 1995 to 2015............................................................................1
Australian Unemployment Rates for the period 1995 to 2015.................................................................2
Australian Exchange Rates for the period 1995 to 2015..........................................................................3
Australian Net Exports for the period 1995 to 2015................................................................................3
Australian Cash Rates and the Federal Reserve Fund’s Rates for the period 1995 to 2015 monthly data
(%)...........................................................................................................................................................4
Relationship between the Australian Real GDP growth rates and inflation rates.........................................9
Relationship between the Australian Real GDP growth rates and unemployment rates............................12
Relationship between the Australian net exports and the exchange rates..................................................13
The Australian cash rates relationship with the Federal Reserve Fund’s rates...........................................16
Australian Macroeconomic Outlook Prediction.........................................................................................18
Conclusion.................................................................................................................................................19
References.................................................................................................................................................20
AUSTRALIAN MACROECONOMIC PERFORMANCE 1
Australian macroeconomic data from the year 1995 to 2015
This report uses data on various named Australian macroeconomic indicators from the year 1995
to 2015 as shown below.
Australian Real Gross Domestic Product Growth Rates from 1995 to 2015
Year Real GDP Growth Rate (Annual %)
1995 2.8
1996 4.2
1997 4.6
1998 4.7
1999 4.4
2000 3
2001 2.6
2002 4.2
2003 2.7
2004 4.3
2005 2.9
2006 2.8
2007 4.4
2008 2.7
2009 1.9
2010 2.4
2011 2.8
2012 3.9
2013 2.1
2014 2.6
2015 2.5
“Source: International Monetary Fund
(https://www.imf.org/external/datamapper/NGDP_RPCH@WEO/OEMDC/ADVEC/WEOWORLD)”
Australian Inflation Rates for the period 1995 to 2015
Year Inflation Rates (Annual %)
1995 4.6
1996 2.7
1997 0.2
1998 0.9
1999 1.4
2000 4.5
2001 4.4
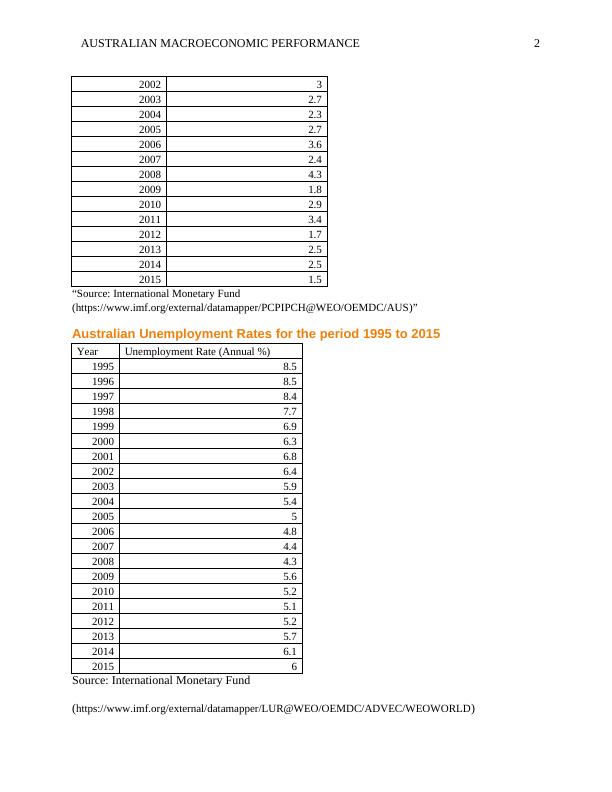
AUSTRALIAN MACROECONOMIC PERFORMANCE 2
2002 3
2003 2.7
2004 2.3
2005 2.7
2006 3.6
2007 2.4
2008 4.3
2009 1.8
2010 2.9
2011 3.4
2012 1.7
2013 2.5
2014 2.5
2015 1.5
“Source: International Monetary Fund
(https://www.imf.org/external/datamapper/PCPIPCH@WEO/OEMDC/AUS)”
Australian Unemployment Rates for the period 1995 to 2015
Year Unemployment Rate (Annual %)
1995 8.5
1996 8.5
1997 8.4
1998 7.7
1999 6.9
2000 6.3
2001 6.8
2002 6.4
2003 5.9
2004 5.4
2005 5
2006 4.8
2007 4.4
2008 4.3
2009 5.6
2010 5.2
2011 5.1
2012 5.2
2013 5.7
2014 6.1
2015 6
Source: International Monetary Fund
(https://www.imf.org/external/datamapper/LUR@WEO/OEMDC/ADVEC/WEOWORLD)
AUSTRALIAN MACROECONOMIC PERFORMANCE 3
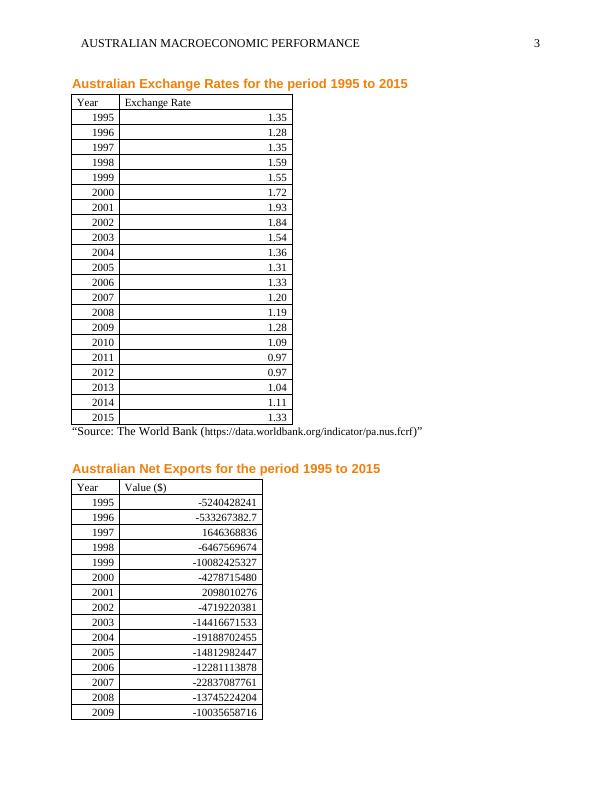
Australian Exchange Rates for the period 1995 to 2015
Year Exchange Rate
1995 1.35
1996 1.28
1997 1.35
1998 1.59
1999 1.55
2000 1.72
2001 1.93
2002 1.84
2003 1.54
2004 1.36
2005 1.31
2006 1.33
2007 1.20
2008 1.19
2009 1.28
2010 1.09
2011 0.97
2012 0.97
2013 1.04
2014 1.11
2015 1.33
“Source: The World Bank (https://data.worldbank.org/indicator/pa.nus.fcrf)”
Australian Net Exports for the period 1995 to 2015
Year Value ($)
1995 -5240428241
1996 -533267382.7
1997 1646368836
1998 -6467569674
1999 -10082425327
2000 -4278715480
2001 2098010276
2002 -4719220381
2003 -14416671533
2004 -19188702455
2005 -14812982447
2006 -12281113878
2007 -22837087761
2008 -13745224204
2009 -10035658716
End of preview
Want to access all the pages? Upload your documents or become a member.
Related Documents
Analyzing the Macroeconomic Performance of Australialg...
|23
|4820
|68
Macroeconomics Performance of Australialg...
|14
|4190
|34
Australian Economic Growth Analysis: 2005-2018lg...
|11
|2064
|70
Evaluation of Macroeconomic Performance of Australia and New Zealandlg...
|16
|3932
|350
The Current Australian Macro-Economy Analysislg...
|15
|3308
|57
Macroeconomic Performance of Australialg...
|13
|3860
|298