Solution to HA1011 Applied Quantitative Methods Assignment 2
VerifiedAdded on 2023/04/03
|13
|1105
|155
Homework Assignment
AI Summary
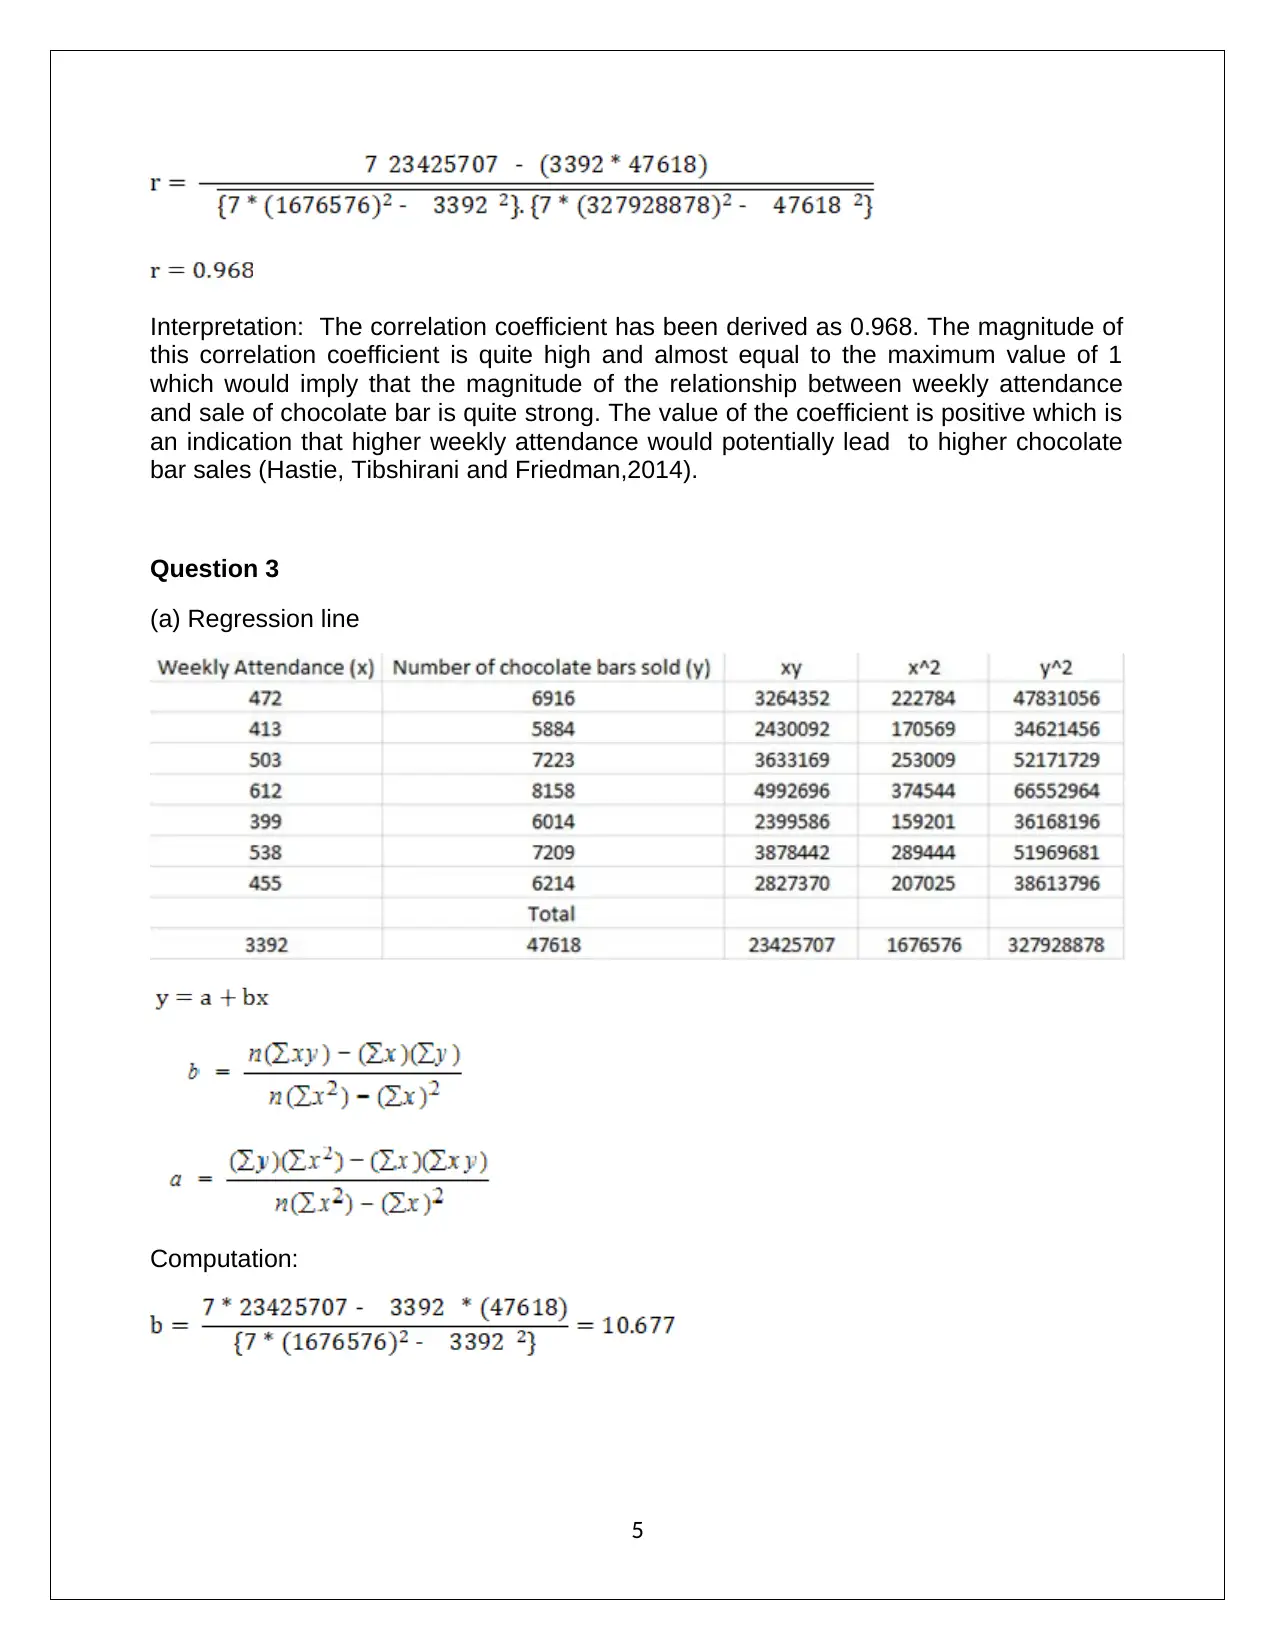
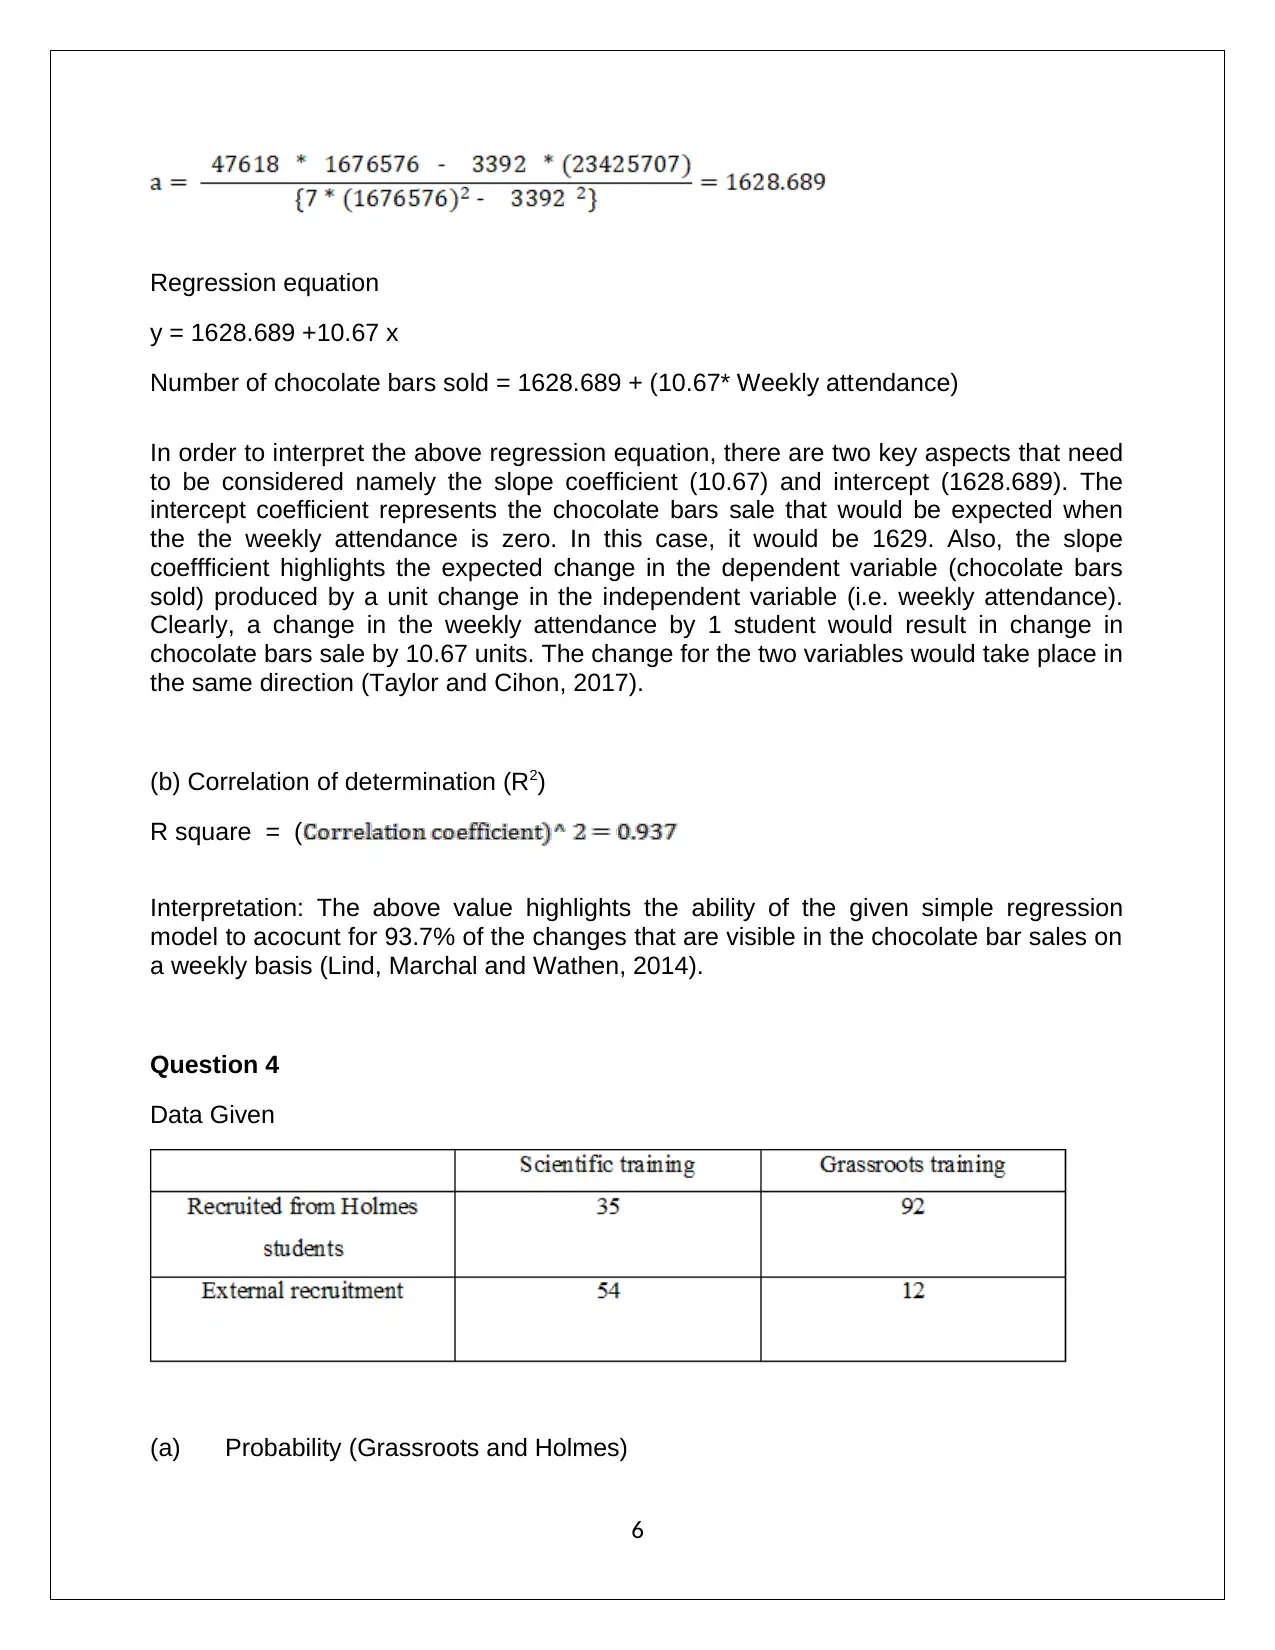
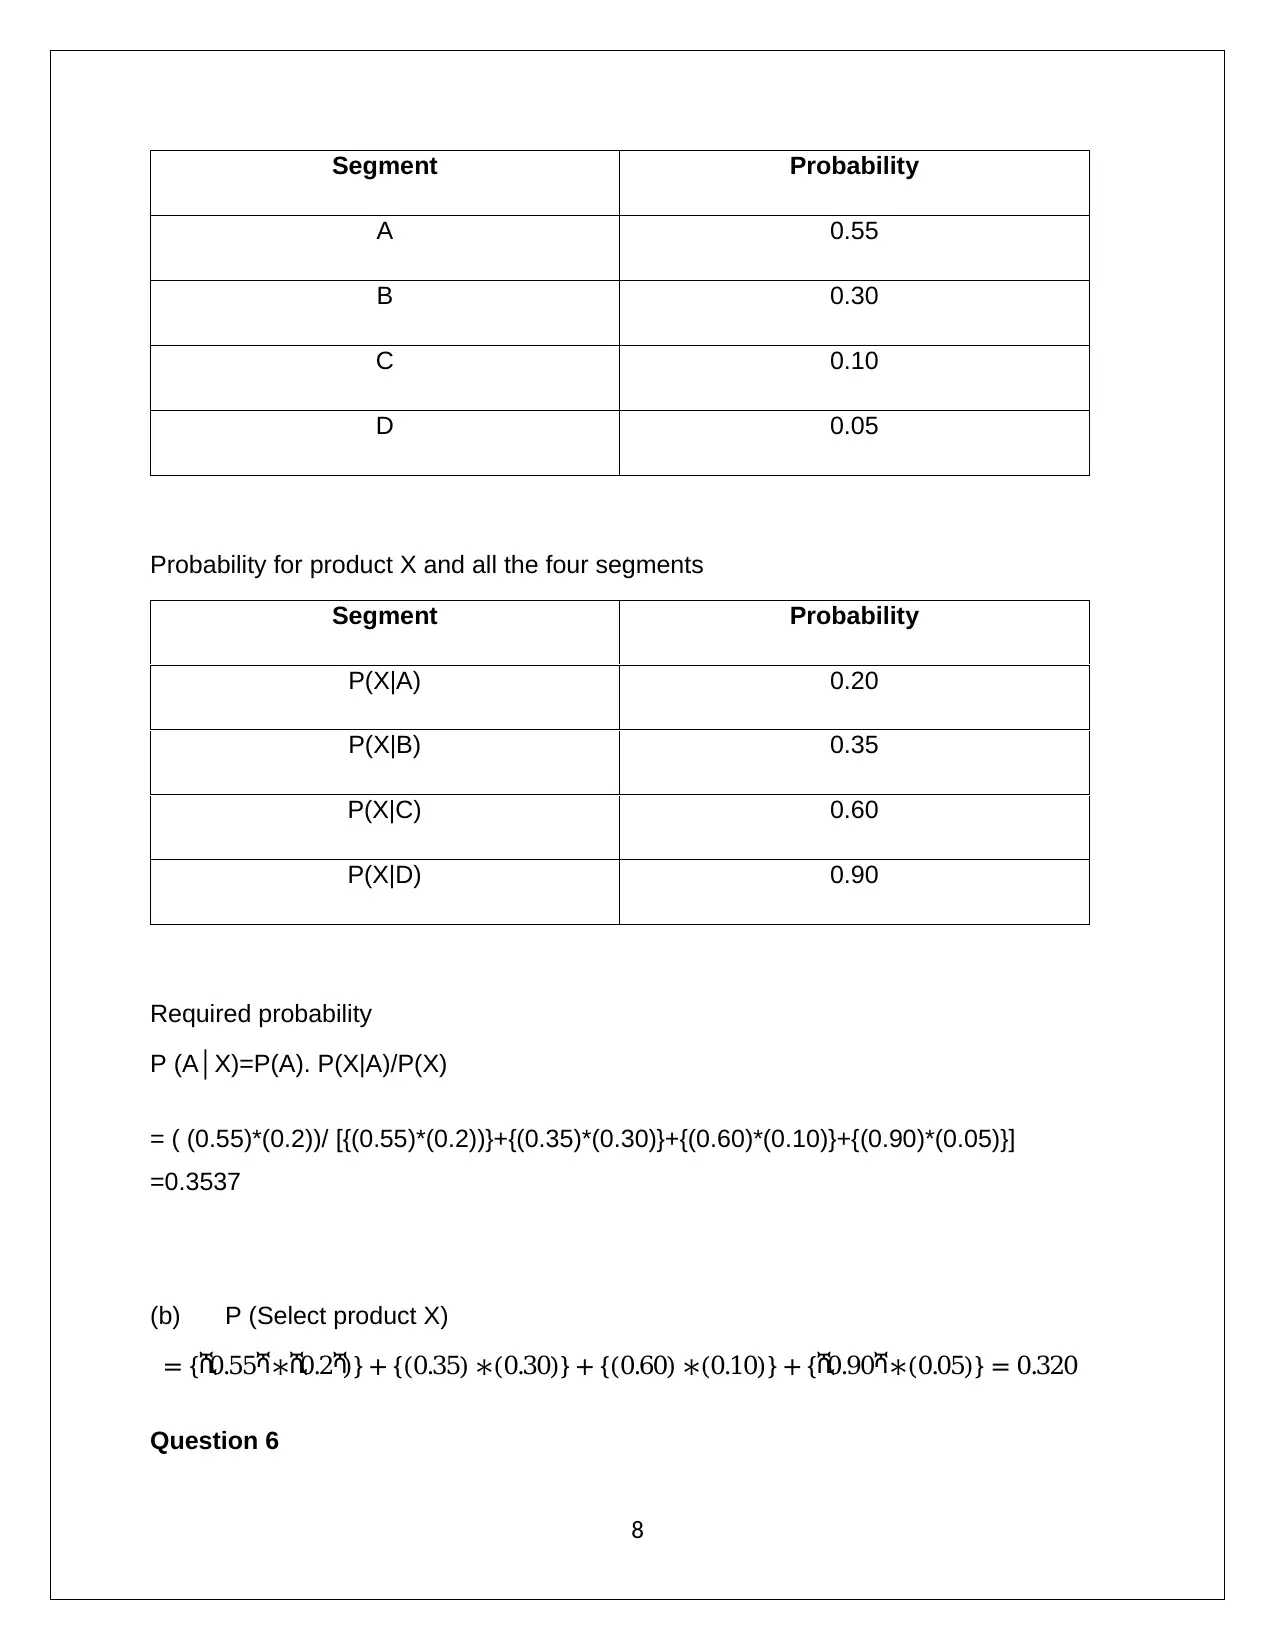
This assignment solution covers various quantitative methods, including frequency distribution, histogram creation, and calculations of mean, median, mode, standard deviation, and interquartile range. It interprets correlation coefficients and develops a regression equation to model the relationship between weekly attendance and chocolate bar sales. The solution also includes probability calculations for different events and applies binomial and Poisson distributions. Furthermore, it addresses normal distribution assumptions and calculates probabilities related to apartment sales and investor willingness. The document is a comprehensive guide to understanding and applying quantitative methods in a business context, made available for students on Desklib, where they can find more solved assignments and study resources.

1 out of 13
Related Documents


Your All-in-One AI-Powered Toolkit for Academic Success.
+13062052269
info@desklib.com
Available 24*7 on WhatsApp / Email
![[object Object]](/_next/static/media/star-bottom.7253800d.svg)
Copyright © 2020–2026 A2Z Services. All Rights Reserved. Developed and managed by ZUCOL.