Apply Principles of Statistics Process
Added on 2020-02-03
21 Pages4722 Words35 Views
APPLY PRINCIPLES OF
STATISTICS PROCESS
CONTROL
1
STATISTICS PROCESS
CONTROL
1
Table of Contents
Q1.........................................................................................................................................................3
Q2.........................................................................................................................................................4
Q3.........................................................................................................................................................4
Q4.........................................................................................................................................................5
A. Calculation of mean.....................................................................................................................5
B. Calculation of median..................................................................................................................5
C. Calculation of standard deviation................................................................................................6
D. Plotting a scatter line chart of the country versus value..............................................................7
E. Distribution of the data.................................................................................................................7
Q5.........................................................................................................................................................8
Defining variation and difference between common & special cause of variations........................8
Q6.........................................................................................................................................................8
1 Constructing a run chart.................................................................................................................8
2 Determining mean and draw it on the line.....................................................................................8
3 Add upper and lower limit to the graph.........................................................................................9
4. Analysis of the chart...................................................................................................................10
Q7.......................................................................................................................................................11
A. Standard distribution curve........................................................................................................11
B. Standard deviation......................................................................................................................12
Q8.......................................................................................................................................................12
Q9.......................................................................................................................................................13
A. Importance of setting targets and limits in business processes..................................................13
B. Determination of targets and limits with examples...................................................................13
Q10.....................................................................................................................................................14
1. Calculation of mean, mode and median.....................................................................................14
2. Calculation of median & mode...................................................................................................15
3. Calculation of mean and median................................................................................................16
4. Computation of mean, mode & median......................................................................................17
5. Calculation of mean, range and standard deviation....................................................................18
6. Calculation of range & standard deviation.................................................................................18
REFERENCES...................................................................................................................................21
2
Q1
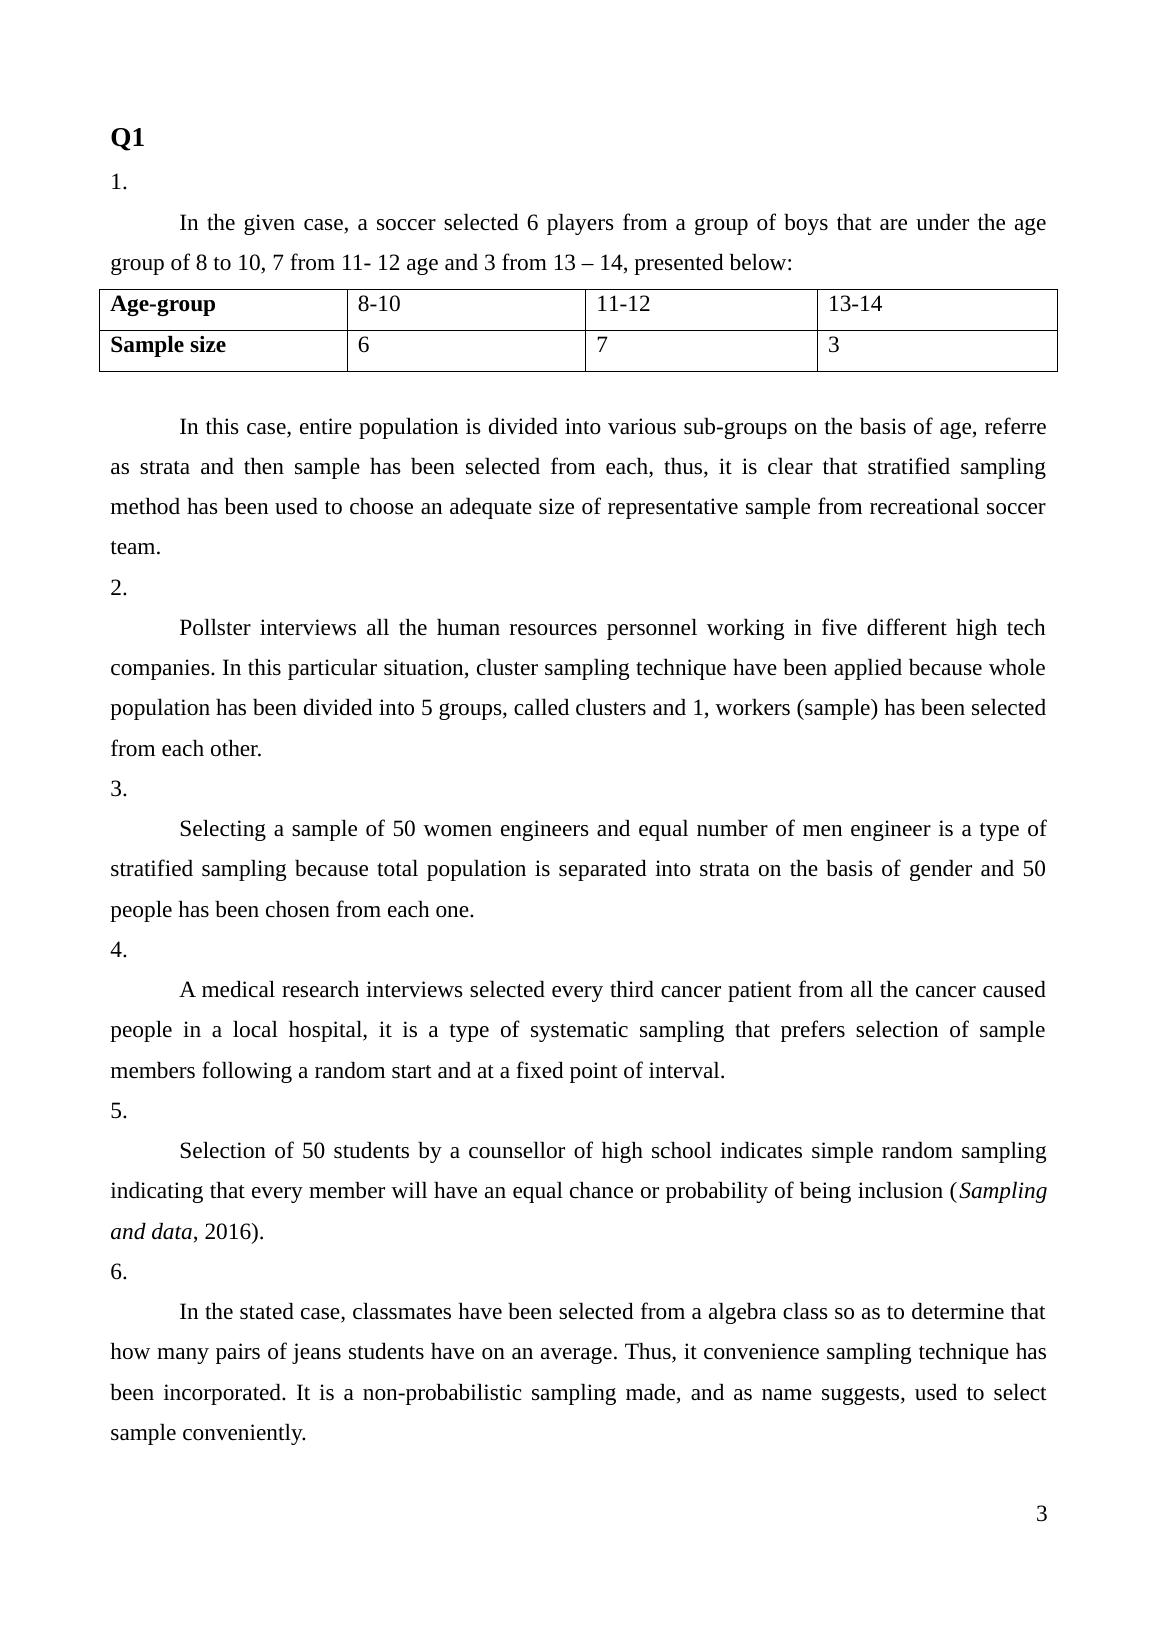
1.
In the given case, a soccer selected 6 players from a group of boys that are under the age
group of 8 to 10, 7 from 11- 12 age and 3 from 13 – 14, presented below:
Age-group 8-10 11-12 13-14
Sample size 6 7 3
In this case, entire population is divided into various sub-groups on the basis of age, referre
as strata and then sample has been selected from each, thus, it is clear that stratified sampling
method has been used to choose an adequate size of representative sample from recreational soccer
team.
2.
Pollster interviews all the human resources personnel working in five different high tech
companies. In this particular situation, cluster sampling technique have been applied because whole
population has been divided into 5 groups, called clusters and 1, workers (sample) has been selected
from each other.
3.
Selecting a sample of 50 women engineers and equal number of men engineer is a type of
stratified sampling because total population is separated into strata on the basis of gender and 50
people has been chosen from each one.
4.
A medical research interviews selected every third cancer patient from all the cancer caused
people in a local hospital, it is a type of systematic sampling that prefers selection of sample
members following a random start and at a fixed point of interval.
5.
Selection of 50 students by a counsellor of high school indicates simple random sampling
indicating that every member will have an equal chance or probability of being inclusion (Sampling
and data, 2016).
6.
In the stated case, classmates have been selected from a algebra class so as to determine that
how many pairs of jeans students have on an average. Thus, it convenience sampling technique has
been incorporated. It is a non-probabilistic sampling made, and as name suggests, used to select
sample conveniently.
3
Q2
As per the stated scenario, Federation University is planned to conduct a survey to analyse
the average money that a part-time students spend on their books. In such respect, there are total
10000 part-time students; however, it is an impossible task to gather information from each and
every student. In such situation, random sampling method is considered as the best sampling
method over convenience and other sampling because, in this, every unit have an equal chance of
being selection in the sample (Siegel, 2016).. This sample will be definitely representative sample
because in this, sample of an adequate size can be selected comprising different disciplines such as
chemistry, English, history, nursing, mathematics, psychology & many others and provides accurate
results of amount spend by part-time students on the course books.
Q3
A
In order to find out the grade point average, using all honor students as the sample is not
considered as representative sample because it choose only high mark awarded people. However, in
order to find out GPA, it must be find out by accumulating the final grades of all the members
divided by the number of grading awarded by the university.
B
Here, investigator has used systematic sampling stood outside the supermarket and surveyed
every 20th child who were under the age of 10 year, therefore, it can be considered as a
representative sample for the survey.
C
It is founded as an appropriate representative sample because in this, cluster has been
designed using simple random sampling technique on the basis of state and then survey has been
performed by Australian politician in every cluster. Thus, in such case, the result drawn will be
provide correct answer about the average annual income of the adults in Australia.
D
It is not a representative sample because in order to determine the proportion of people who
are using public transport as a mean to work, interviewer sits on a bench in the Melbourne Botanical
Garden and interviewed 10 people, cannot be said as an appropriate technique (Jaggia and et.al.,
2016).
E
It is considered as a suitable sampling method and representative also, because in order to
find out an average cost of staying in a hotel for 2 days, researcher has surveyed 100 hospitals using
4
simple random sampling to eliminate biasness.
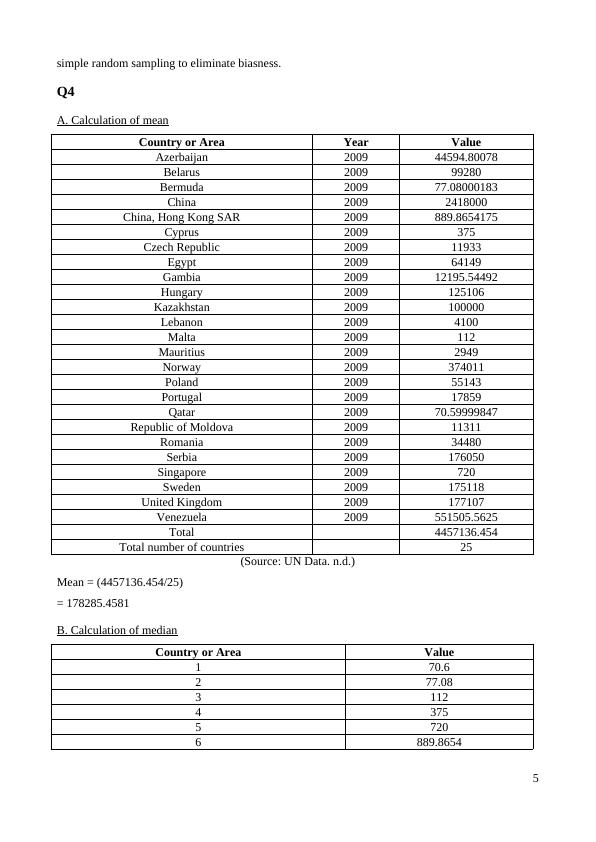
Q4
A. Calculation of mean
Country or Area Year Value
Azerbaijan 2009 44594.80078
Belarus 2009 99280
Bermuda 2009 77.08000183
China 2009 2418000
China, Hong Kong SAR 2009 889.8654175
Cyprus 2009 375
Czech Republic 2009 11933
Egypt 2009 64149
Gambia 2009 12195.54492
Hungary 2009 125106
Kazakhstan 2009 100000
Lebanon 2009 4100
Malta 2009 112
Mauritius 2009 2949
Norway 2009 374011
Poland 2009 55143
Portugal 2009 17859
Qatar 2009 70.59999847
Republic of Moldova 2009 11311
Romania 2009 34480
Serbia 2009 176050
Singapore 2009 720
Sweden 2009 175118
United Kingdom 2009 177107
Venezuela 2009 551505.5625
Total 4457136.454
Total number of countries 25
(Source: UN Data. n.d.)
Mean = (4457136.454/25)
= 178285.4581
B. Calculation of median
Country or Area Value
1 70.6
2 77.08
3 112
4 375
5 720
6 889.8654
5
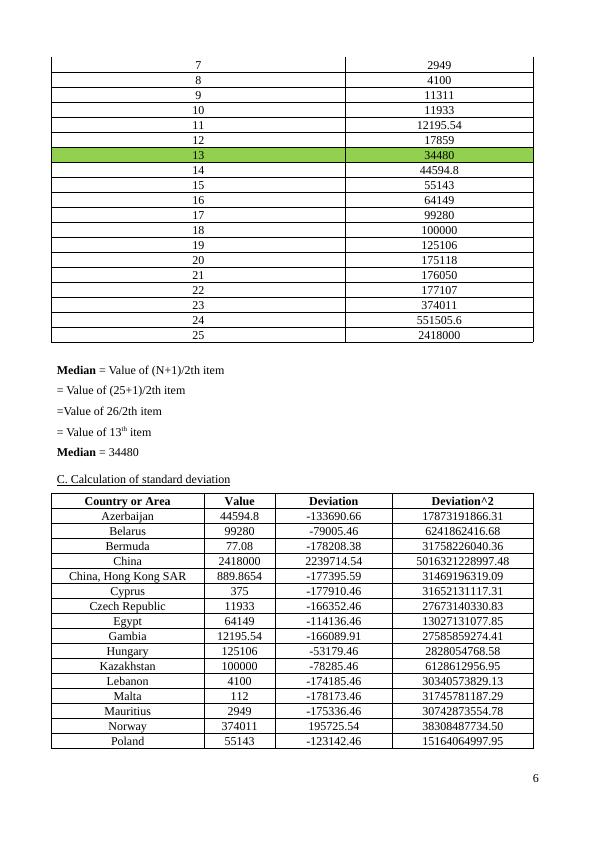
7 2949
8 4100
9 11311
10 11933
11 12195.54
12 17859
13 34480
14 44594.8
15 55143
16 64149
17 99280
18 100000
19 125106
20 175118
21 176050
22 177107
23 374011
24 551505.6
25 2418000
Median = Value of (N+1)/2th item
= Value of (25+1)/2th item
=Value of 26/2th item
= Value of 13th item
Median = 34480
C. Calculation of standard deviation
Country or Area Value Deviation Deviation^2
Azerbaijan 44594.8 -133690.66 17873191866.31
Belarus 99280 -79005.46 6241862416.68
Bermuda 77.08 -178208.38 31758226040.36
China 2418000 2239714.54 5016321228997.48
China, Hong Kong SAR 889.8654 -177395.59 31469196319.09
Cyprus 375 -177910.46 31652131117.31
Czech Republic 11933 -166352.46 27673140330.83
Egypt 64149 -114136.46 13027131077.85
Gambia 12195.54 -166089.91 27585859274.41
Hungary 125106 -53179.46 2828054768.58
Kazakhstan 100000 -78285.46 6128612956.95
Lebanon 4100 -174185.46 30340573829.13
Malta 112 -178173.46 31745781187.29
Mauritius 2949 -175336.46 30742873554.78
Norway 374011 195725.54 38308487734.50
Poland 55143 -123142.46 15164064997.95
6
End of preview
Want to access all the pages? Upload your documents or become a member.
Related Documents
MDM4U Evaluating Research Assignmentlg...
|4
|1530
|58
Exam Quesitons and Answers Related to Statisticslg...
|11
|1028
|30
Assignment Report on Business Data Analysislg...
|17
|2276
|39
Basic Business Statistics Assignment Reportlg...
|12
|2266
|40
Assignment about state of Coloradolg...
|4
|592
|20
Statistics for Business Phuc Thang Nguyenlg...
|7
|1646
|371