Exam Quesitons and Answers Related to Statistics
Added on 2022-08-17
11 Pages1028 Words30 Views
Running head: STATISTICS
Statistics
Name of the Student
Name of the University
Author Note
Statistics
Name of the Student
Name of the University
Author Note
STATISTICS
1
Table of Contents
Answer to question 1.......................................................................................................................2
Answer to question 2:......................................................................................................................2
Answer to question 3:......................................................................................................................2
Answer to question 4:......................................................................................................................2
Answer to question 5.......................................................................................................................3
Answer to question 6.......................................................................................................................3
Answer to question 7:......................................................................................................................3
Answer to question 8.......................................................................................................................4
Answer to 9......................................................................................................................................4
Answer to question 10.....................................................................................................................6
Answer to question 11.....................................................................................................................6
Answer to 12....................................................................................................................................7
STATISTICS
2
Answer to question 1
a. Experimental
b. Observation
C. Observational
Answer to question 2:
a. Inferential statistics
b. Descriptive statistics
c. Descriptive statistics
d. Inferential statistics
Answer to question 3:
Two levels of measurements for Blood type is nominal variable and age is ordinal variable.
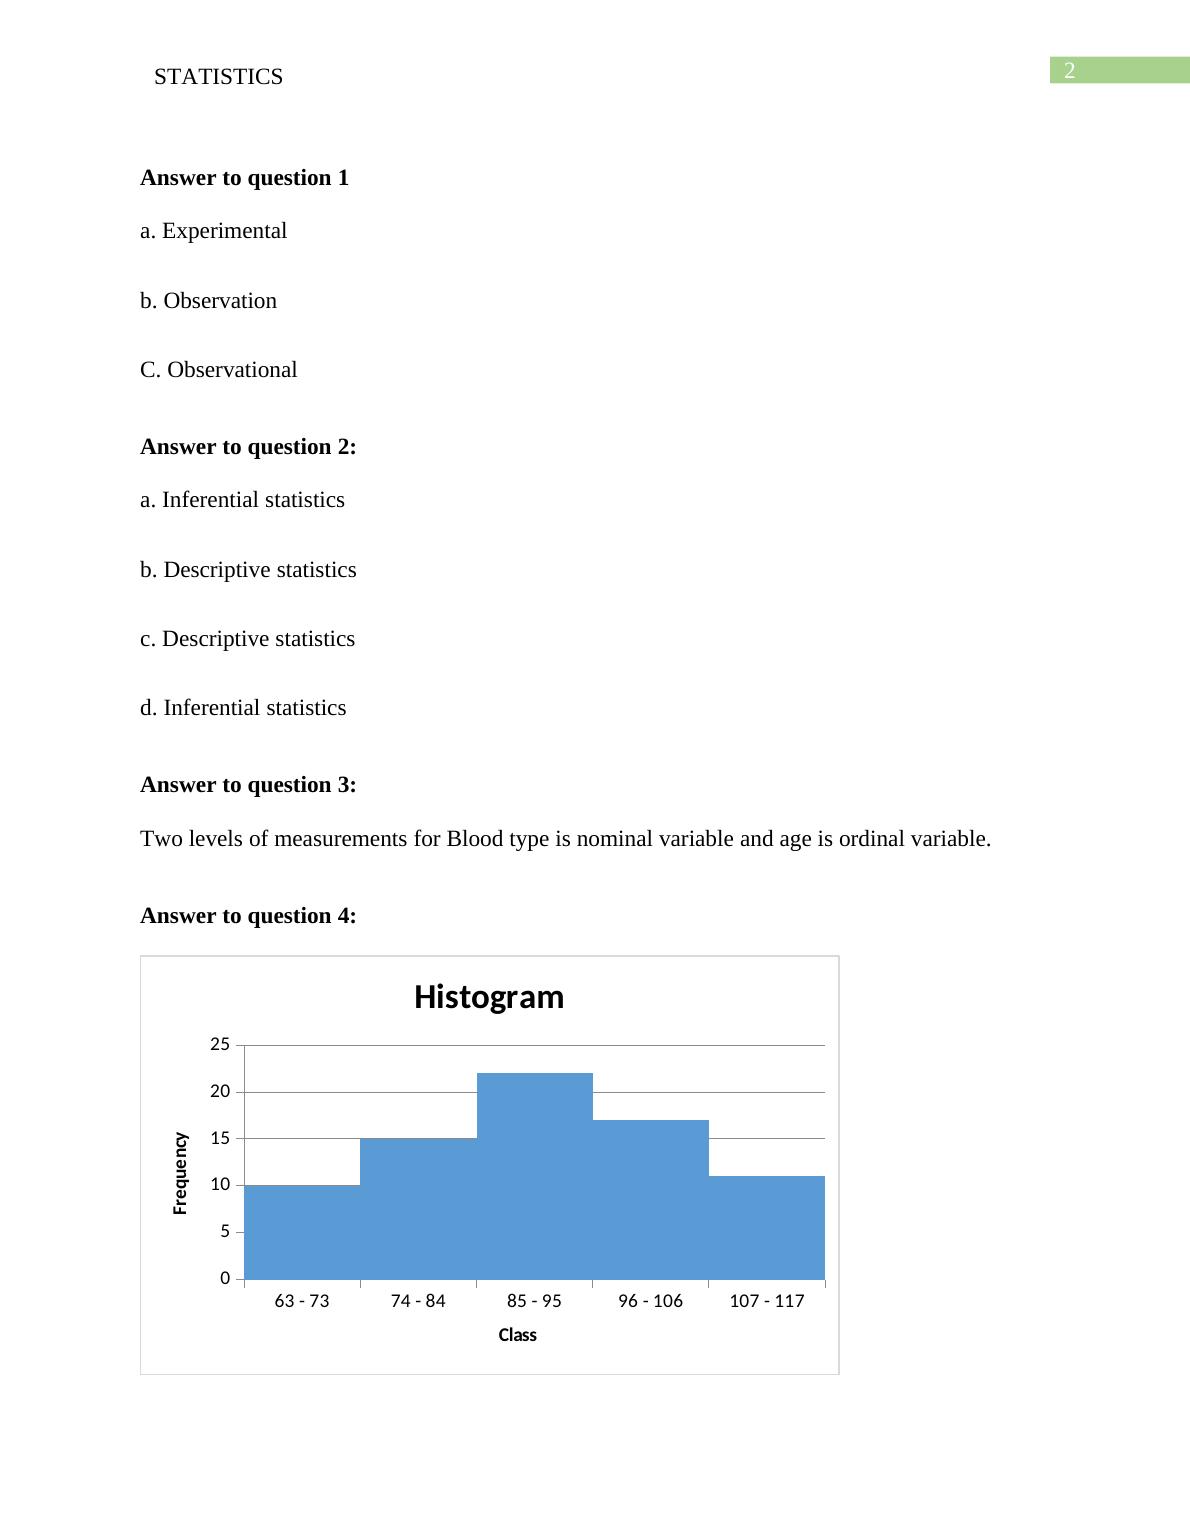
Answer to question 4:
63 - 73 74 - 84 85 - 95 96 - 106 107 - 117
0
5
10
15
20
25
Histogram
Class
Frequency
2
Answer to question 1
a. Experimental
b. Observation
C. Observational
Answer to question 2:
a. Inferential statistics
b. Descriptive statistics
c. Descriptive statistics
d. Inferential statistics
Answer to question 3:
Two levels of measurements for Blood type is nominal variable and age is ordinal variable.
Answer to question 4:
63 - 73 74 - 84 85 - 95 96 - 106 107 - 117
0
5
10
15
20
25
Histogram
Class
Frequency
STATISTICS
3
Source: (as created by the author1)
Answer to question 5
a. qualitative variable
b. quantitative variable
c. qualitative variable
Answer to question 6
a. In case of Simple Random Sampling, each of the six apartments out of hundred apartments
will be assigned with a number between 1 and 100, after which 6 of those numbers would be
randomly chosen2.
b. In terms of the cluster sampling, the statistician divides the whole population into clusters and
each clustered would be assigned with equal probability. The total population size of 100
apartments will be separated into groups by assigning the same average members for each group.
c. In terms of stratified sampling, a sample is chosen from the population in such a way that
selected sample contains the characteristics of the population. Here, the population of 100
apartments can be stratified into subgroups by number of rooms available in the room, like,
single and duplex flat.
1 Semke, Lemler and Thapa, An experimental modal channel reduction procedure using a pareto chart. In Topics in
Modal Analysis II (Springer 2014)
2 Tipton, Hedges, Vaden-Kiernan, Borman, Sullivan and Caverly, ’Sample selection in randomized experiments: A
new method using propensity score stratified sampling’ (2014) Journal of Research on Educational Effectiveness
14.
End of preview
Want to access all the pages? Upload your documents or become a member.
Related Documents
BDA 1305AFE : Business Data Analysislg...
|12
|838
|11
Statistics for Business Decisionlg...
|11
|1637
|3
Statistics Homework Questions - Deskliblg...
|15
|2447
|499
Statistical Economics | Assignmentlg...
|5
|490
|17
Business Data Analysislg...
|9
|1076
|43
Desklib Study Material: IQR Technique, Stratified Sampling, Data Types, Research Methodslg...
|8
|1771
|76