Applying Mathematics: Assessment Two - Climate Change Data Analysis
VerifiedAdded on 2019/09/26
|10
|1624
|337
Homework Assignment
AI Summary
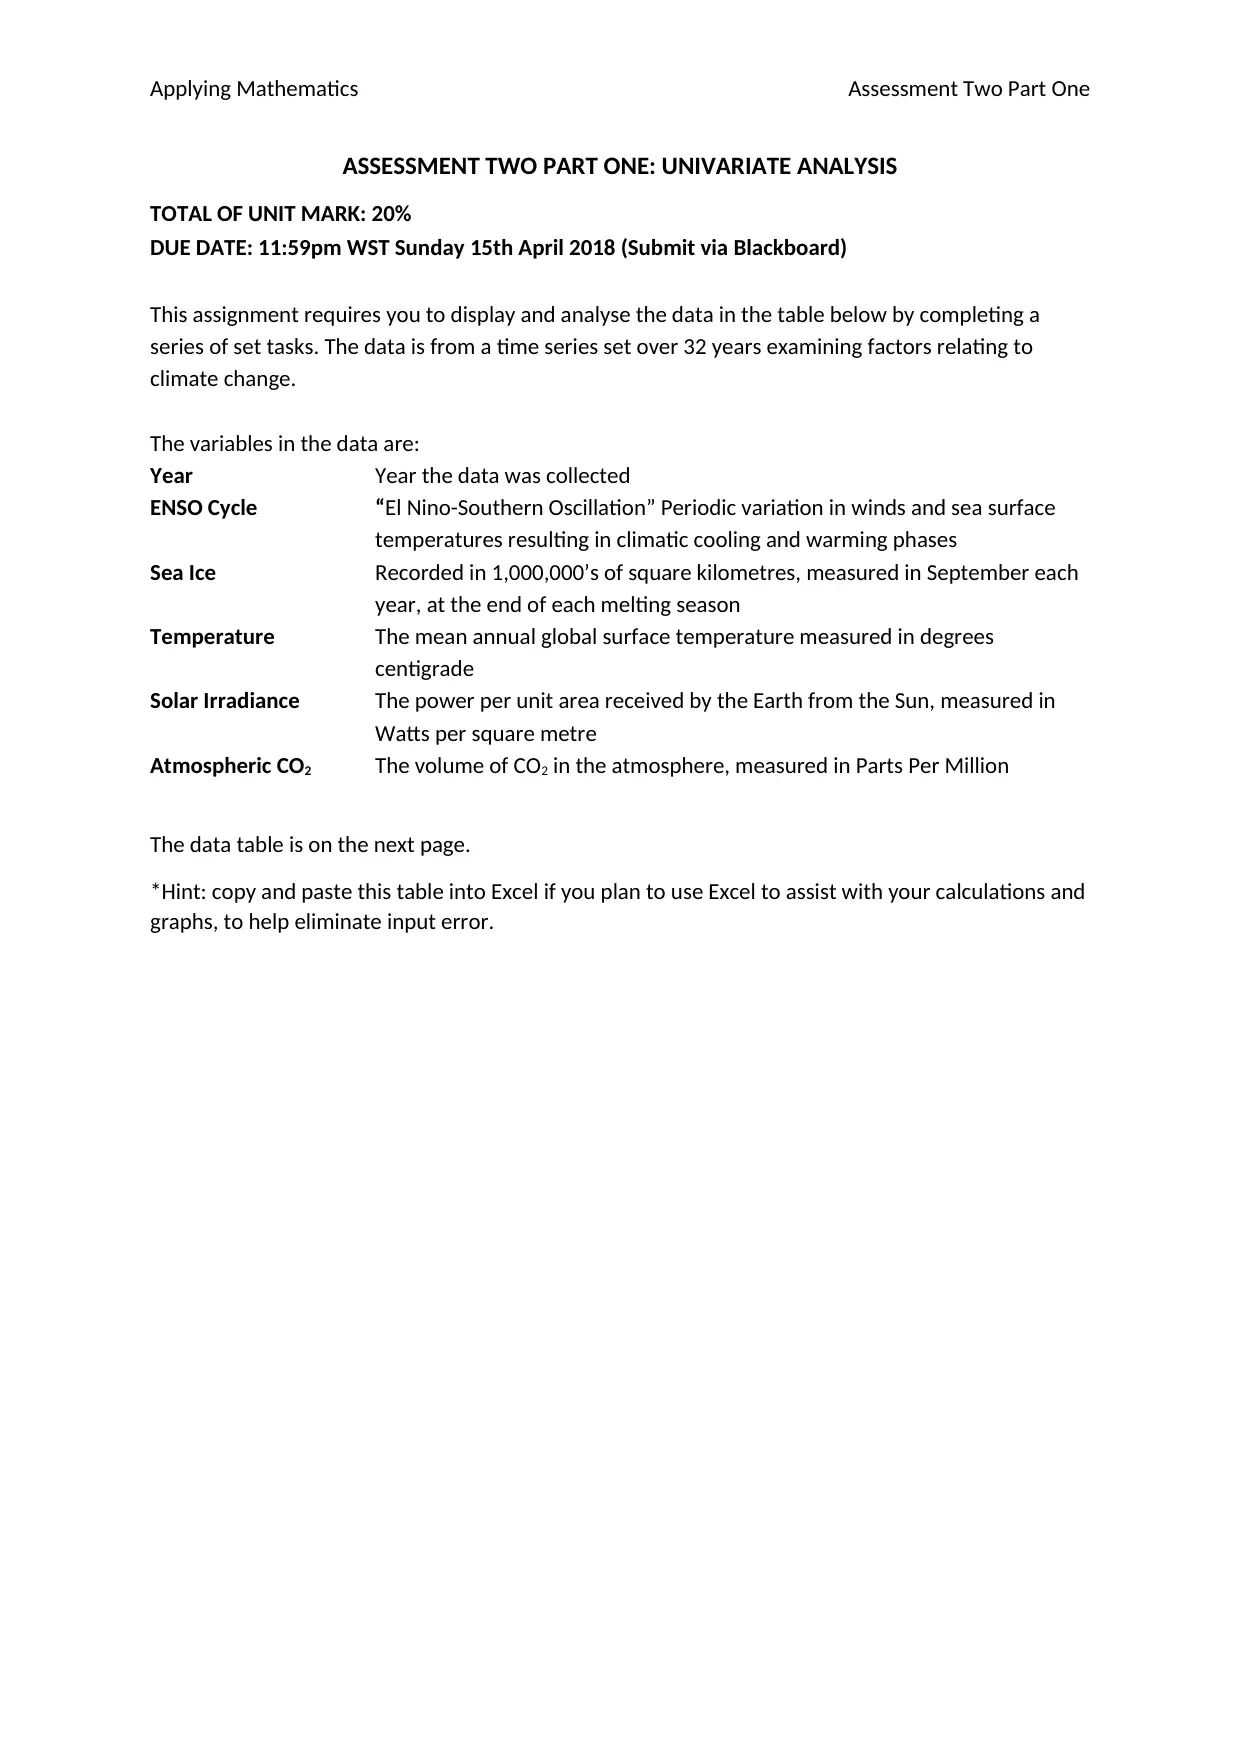
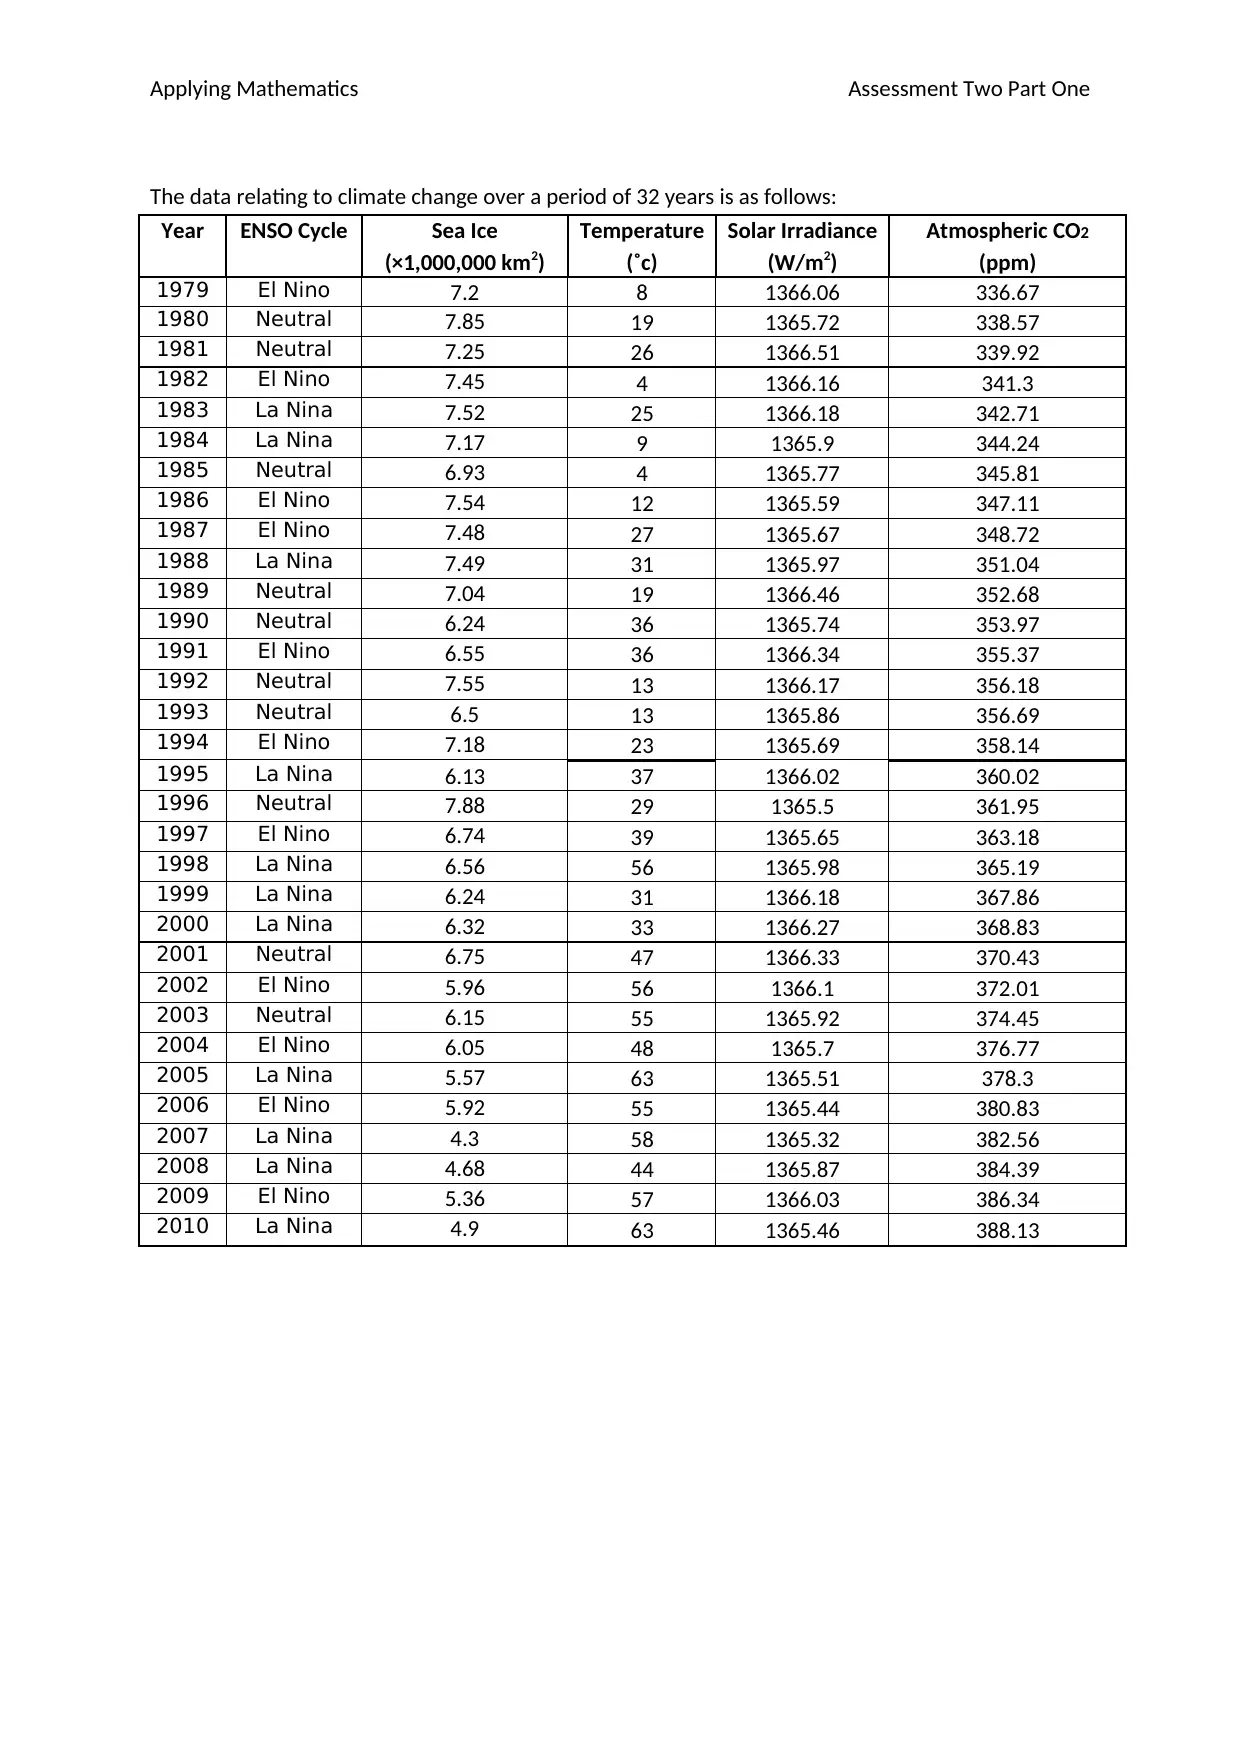
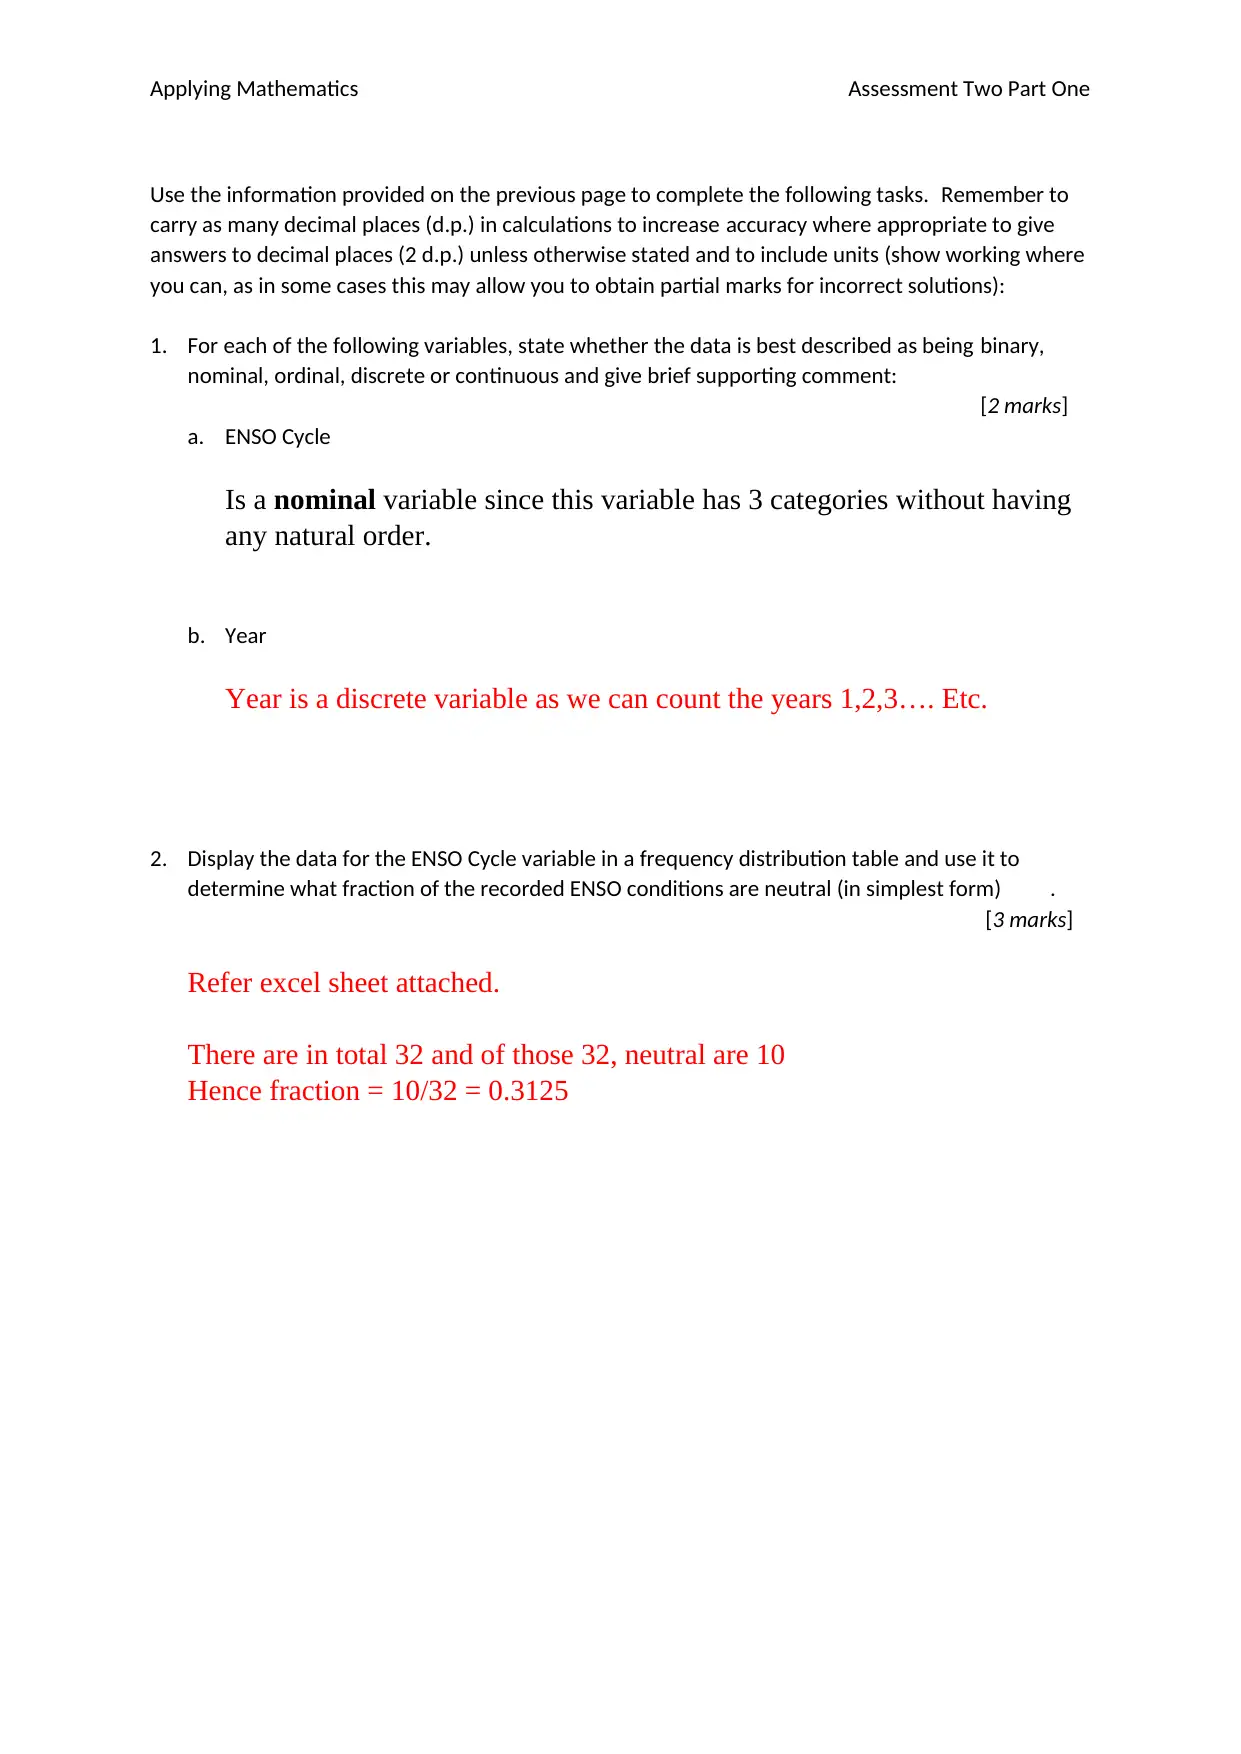
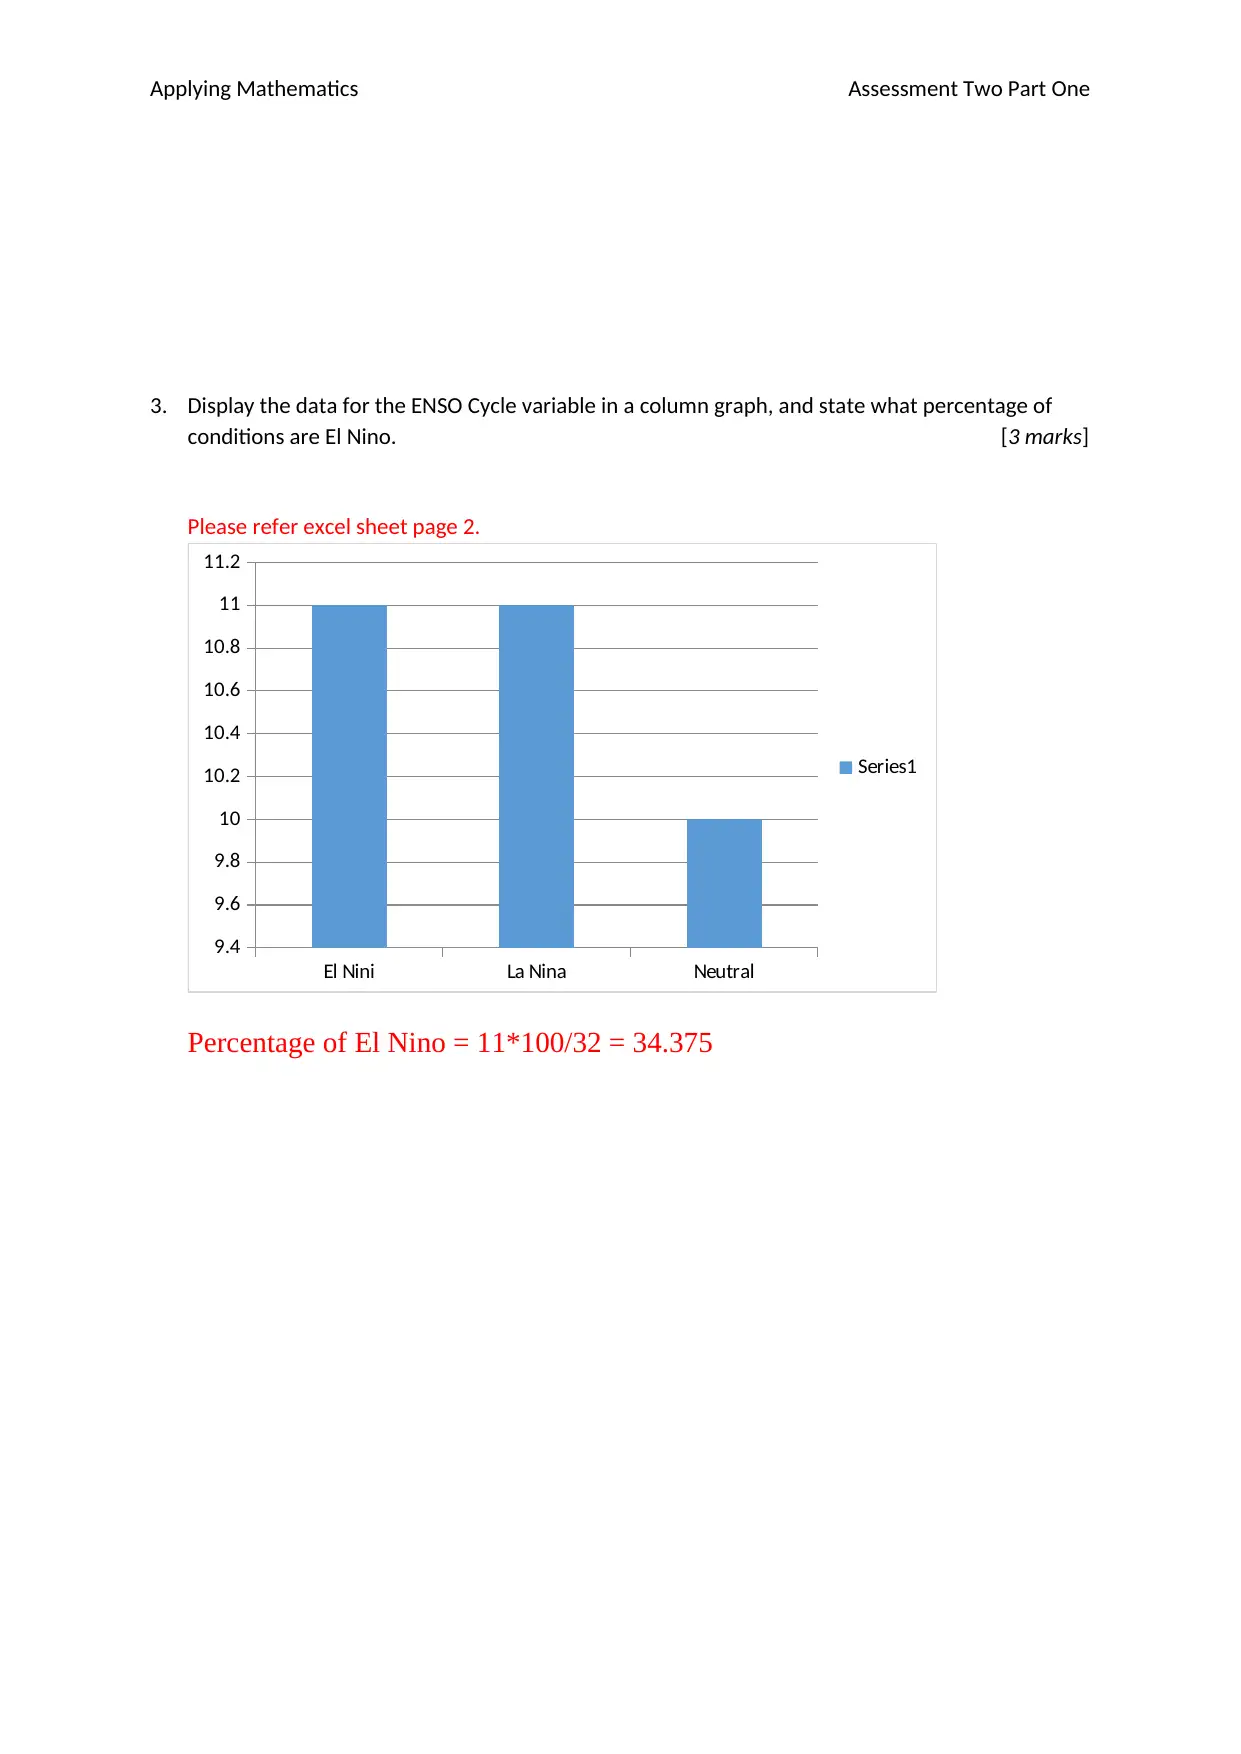
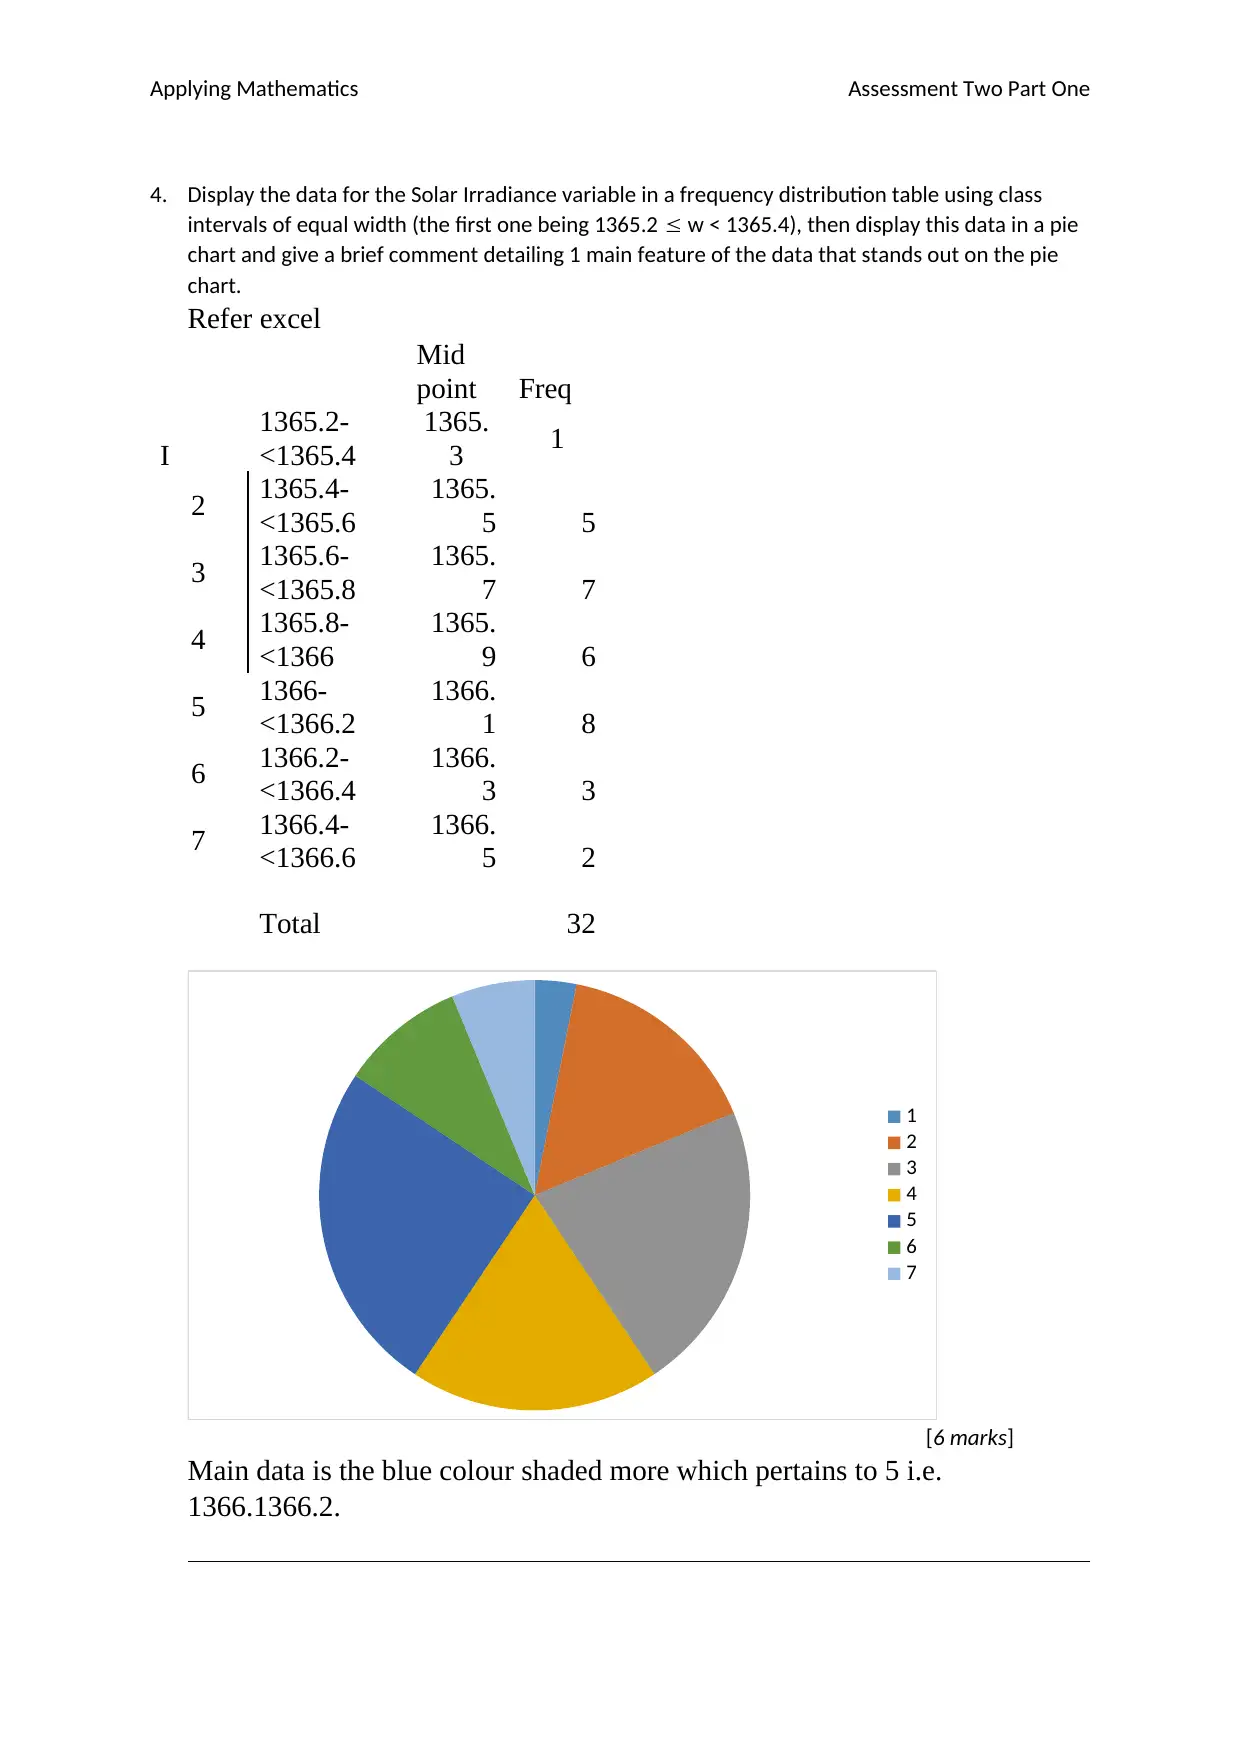
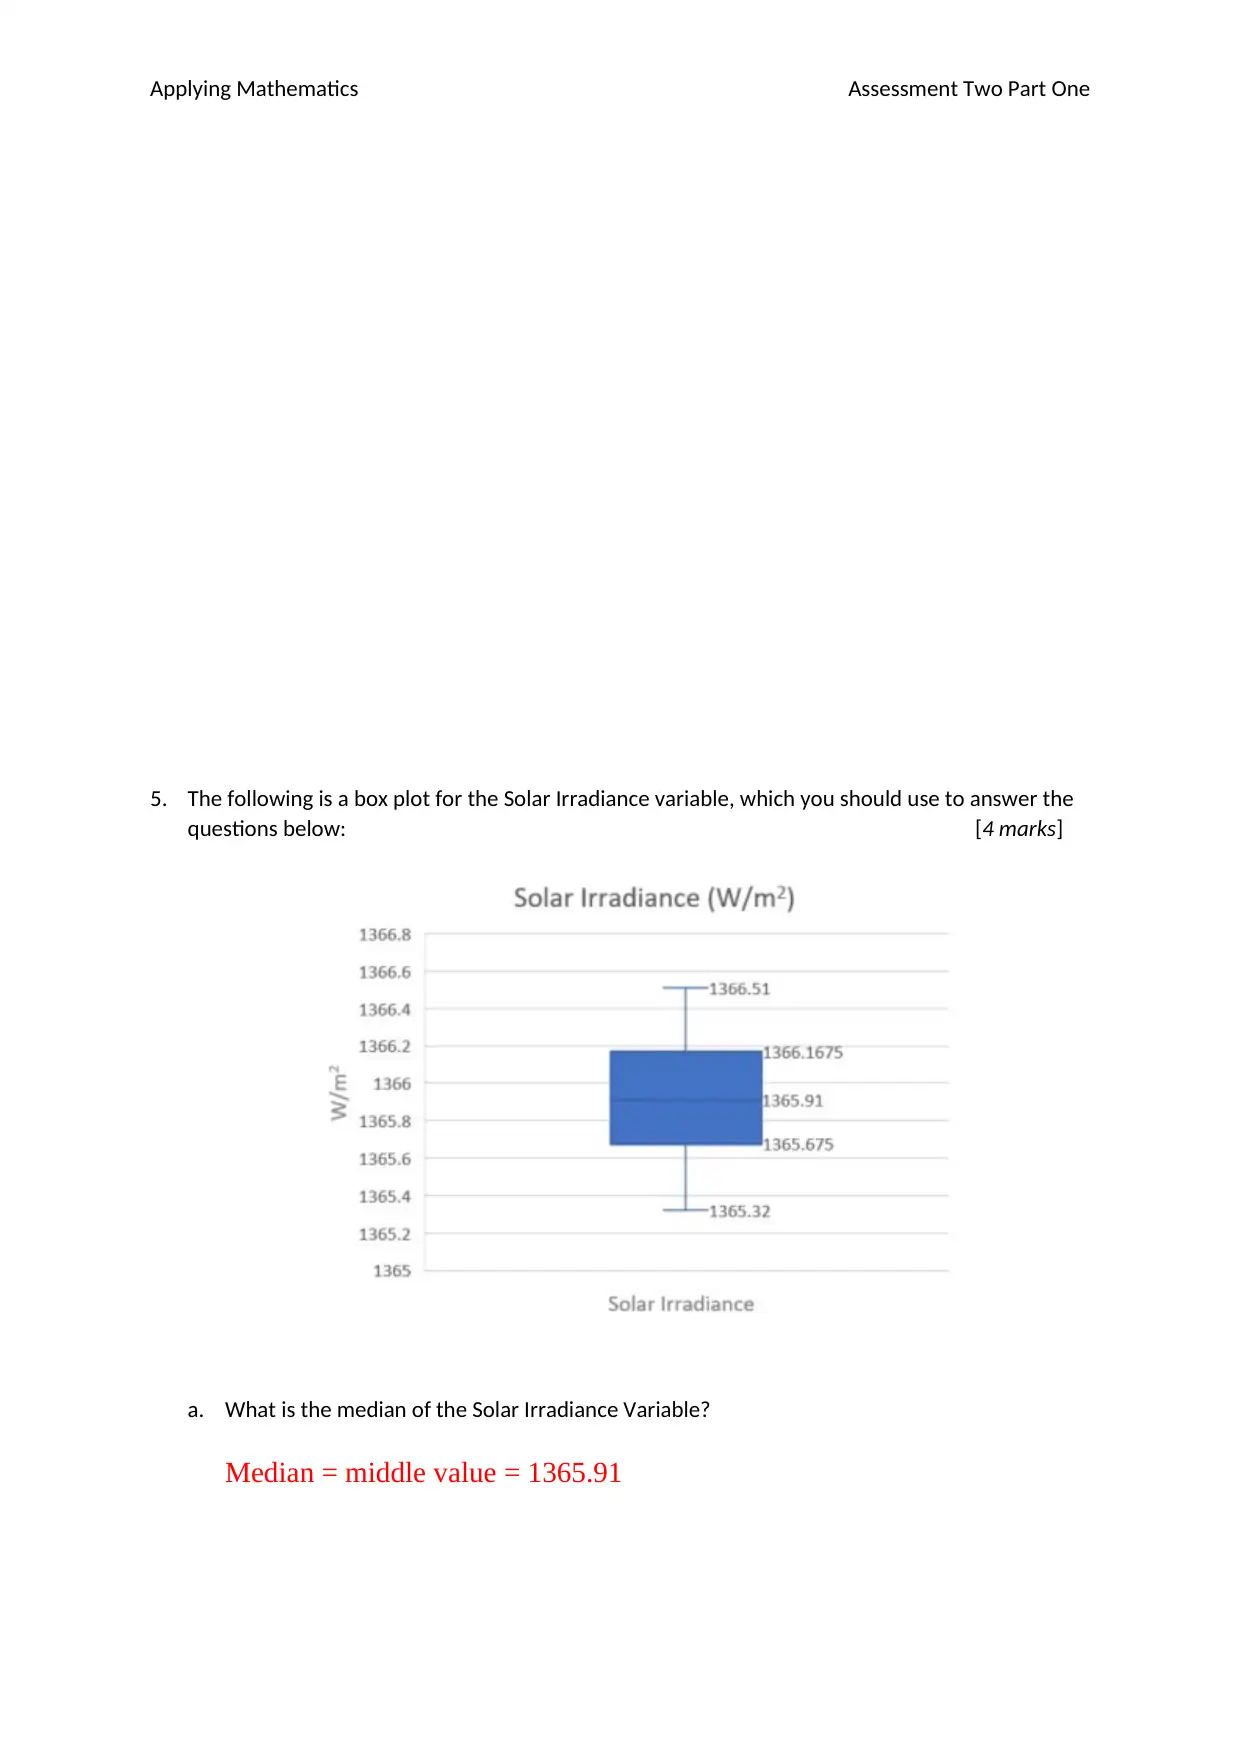
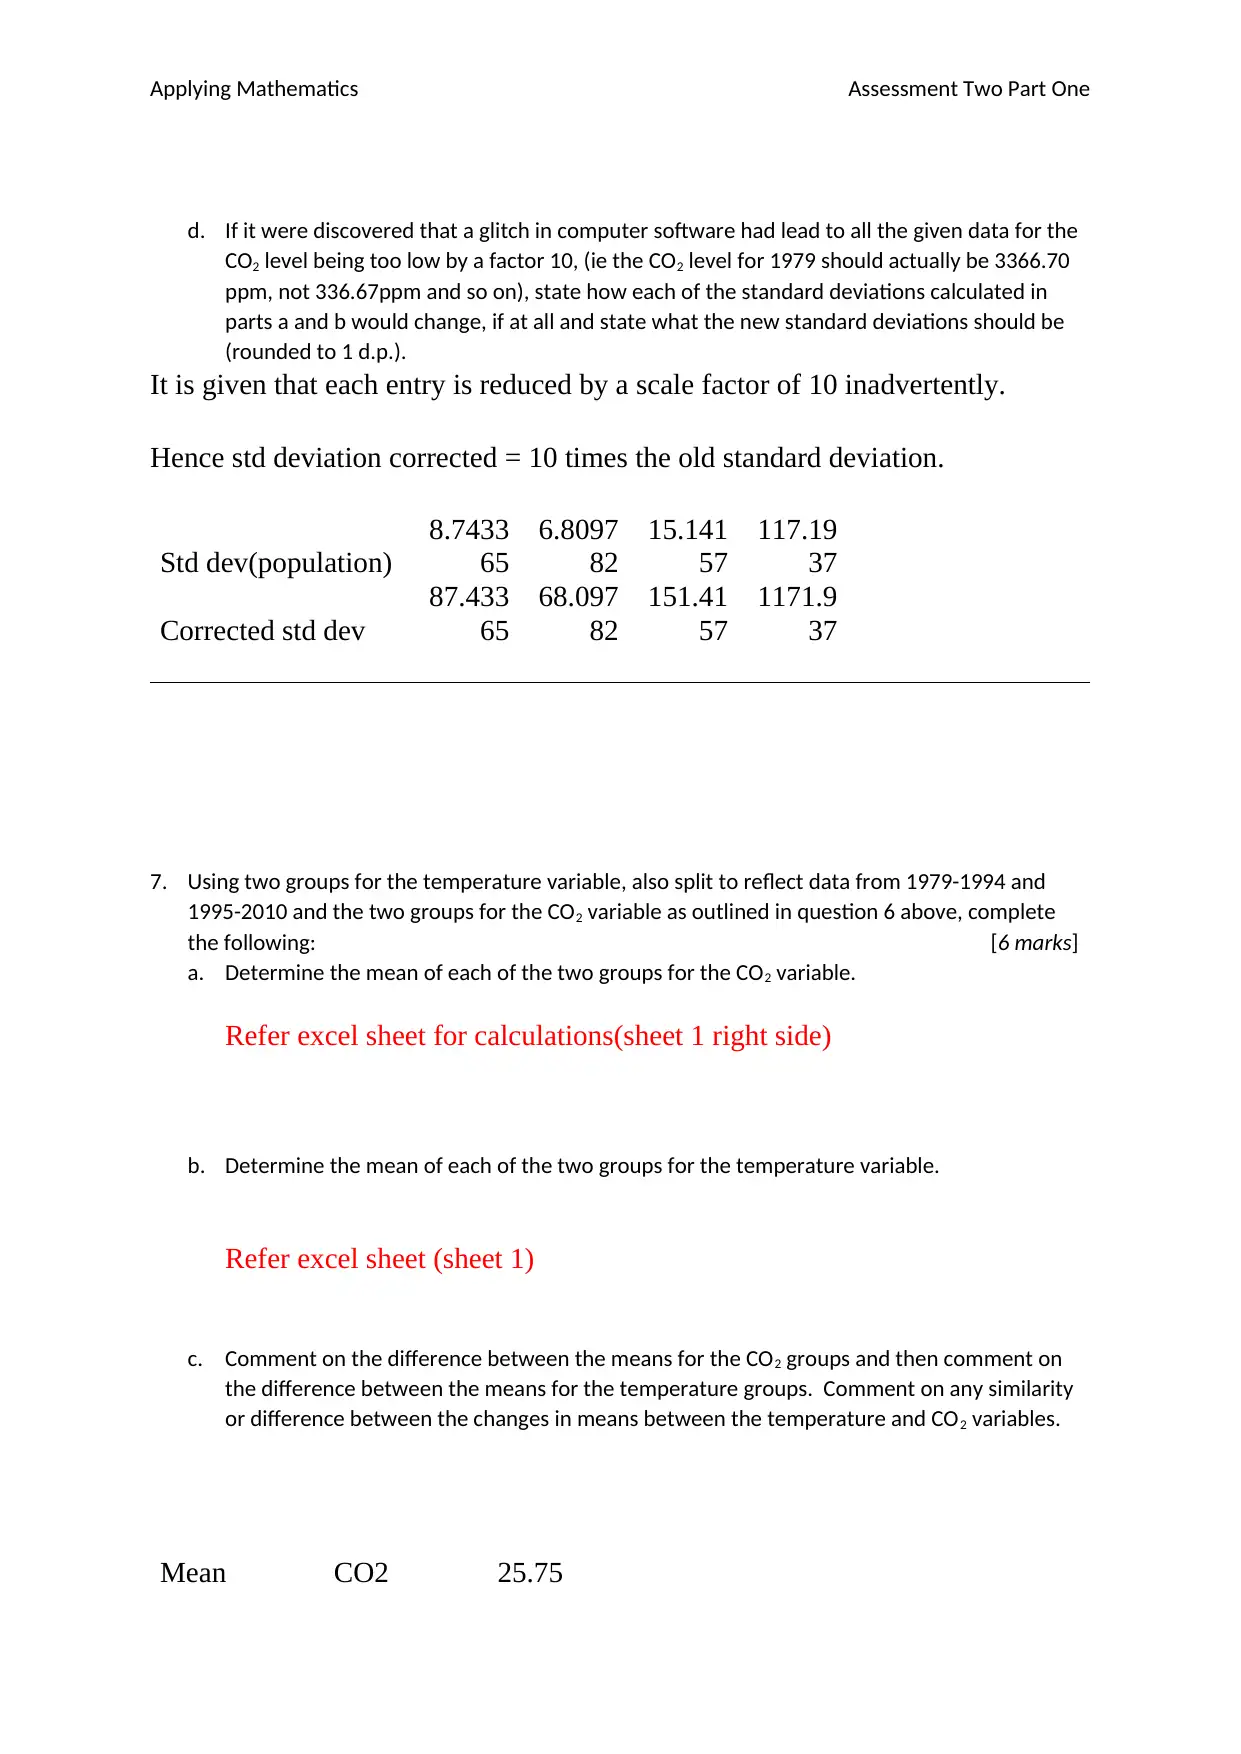
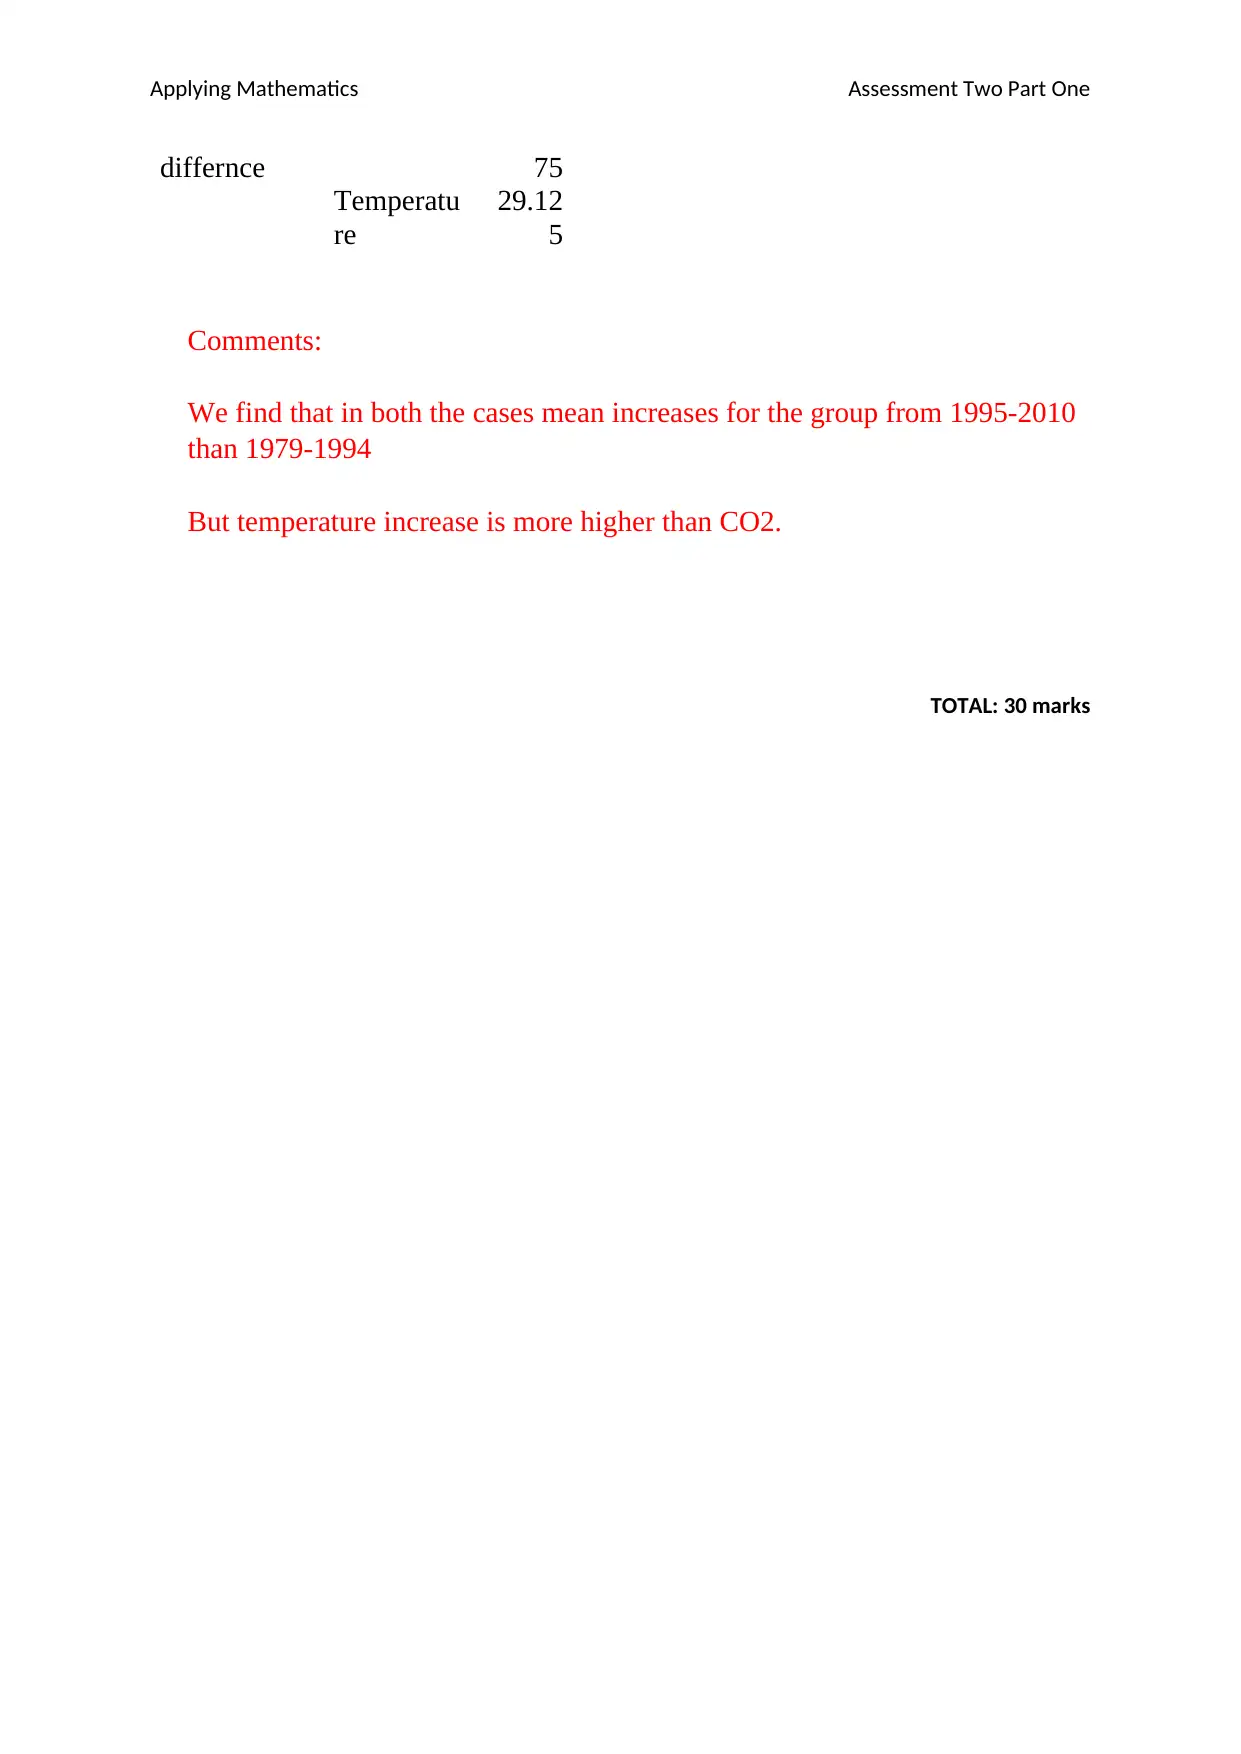
This assignment analyzes a climate change dataset spanning 32 years, examining variables like ENSO cycle, sea ice, temperature, solar irradiance, and atmospheric CO2. The tasks include identifying variable types, constructing frequency distributions, and creating column graphs. The assignment requires calculations of percentages, and the creation of frequency tables and pie charts for solar irradiance data, with comments on data features. Box plots are used to determine the median, interquartile range, and outliers for solar irradiance. The assignment also involves calculating and comparing population standard deviations for CO2 levels across two time periods (1979-1994 and 1995-2010), including adjustments for a data scaling error. Finally, the mean for both CO2 and temperature variables are calculated across the same two time periods, and the changes in the means are compared, revealing insights into climate trends and data analysis techniques.
1 out of 10


Your All-in-One AI-Powered Toolkit for Academic Success.
+13062052269
info@desklib.com
Available 24*7 on WhatsApp / Email
![[object Object]](/_next/static/media/star-bottom.7253800d.svg)
Copyright © 2020–2026 A2Z Services. All Rights Reserved. Developed and managed by ZUCOL.