Advantages of Payoff Matrix and Decision Trees
VerifiedAdded on 2023/03/20
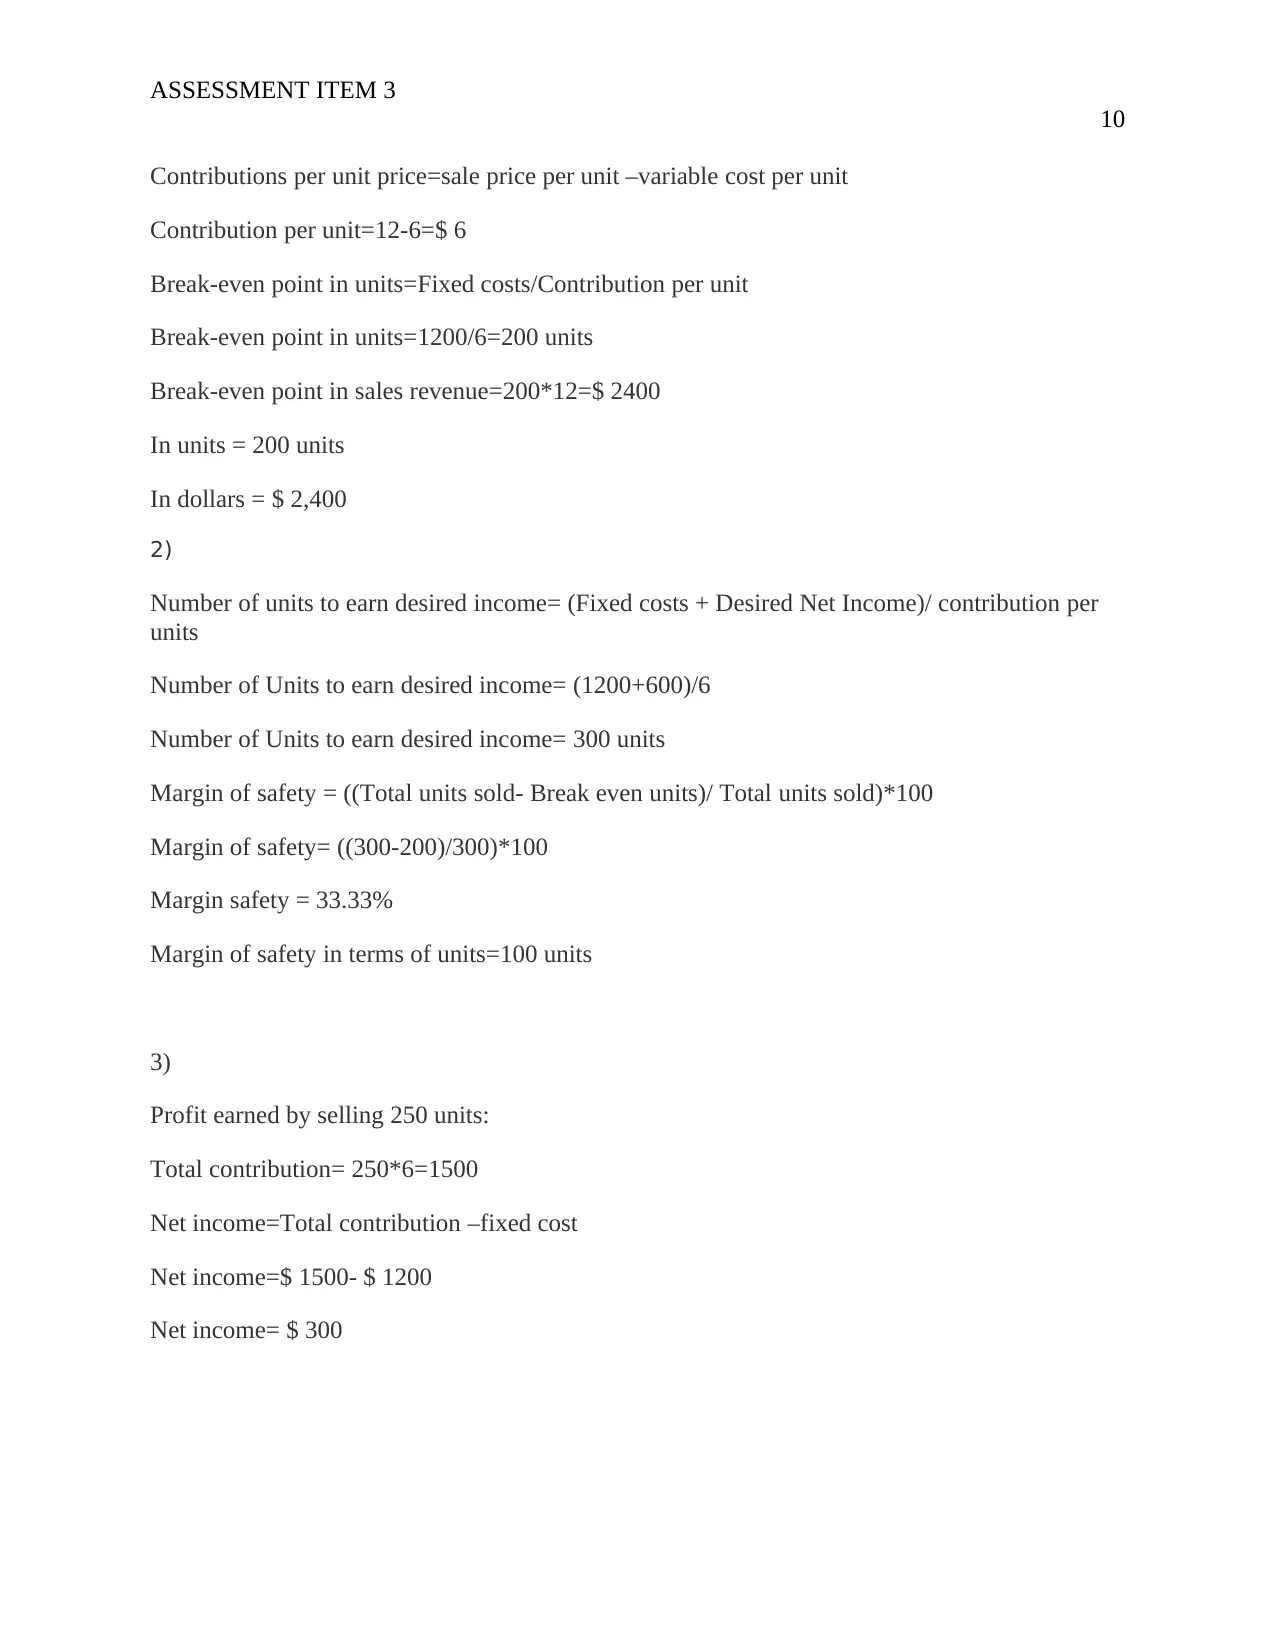
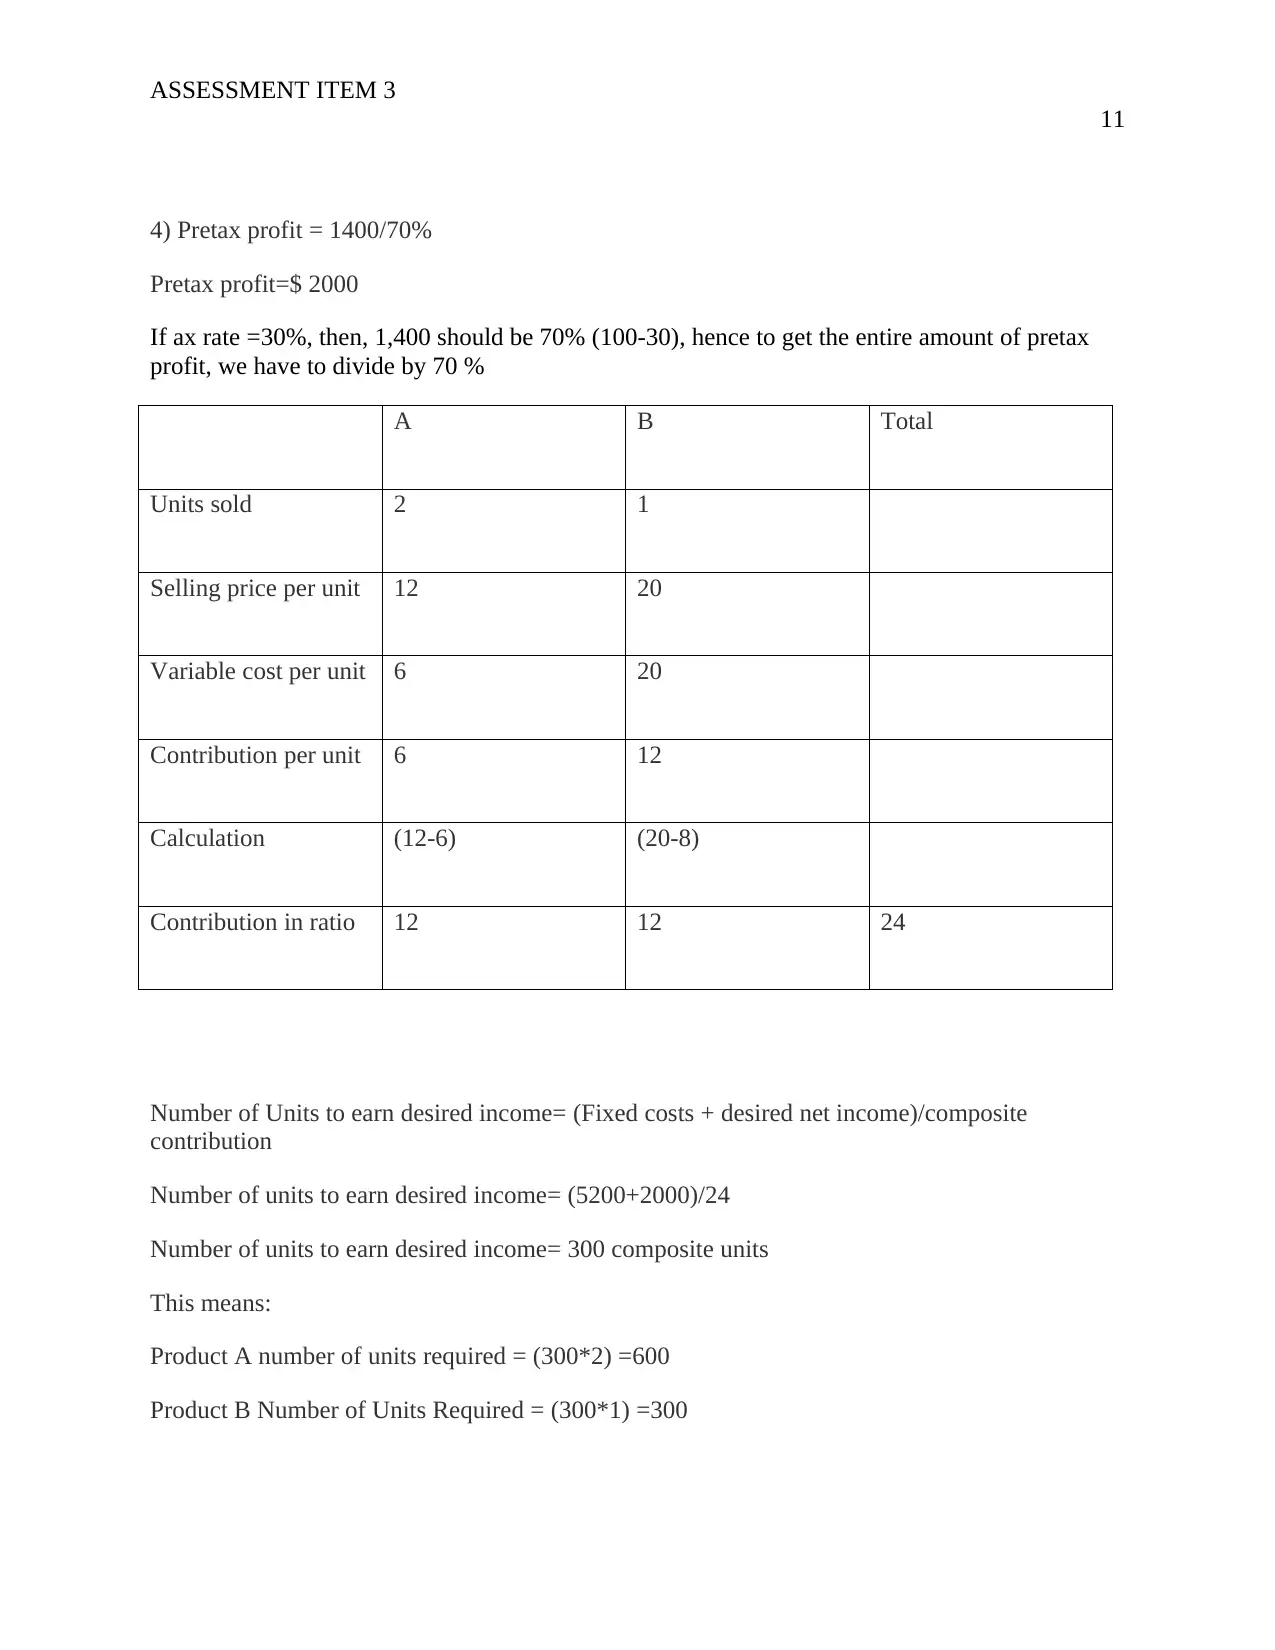
|12
|1301
|70
AI Summary
This document discusses the advantages of using payoff matrix and decision trees in decision making. It explains the steps required to develop a payoff matrix and highlights the benefits of decision trees. The document also compares the advantages of both methods and explains why decision trees are preferred over payoff matrix. References are provided for further reading.
Contribute Materials
Your contribution can guide someone’s learning journey. Share your
documents today.
![Document Page](https://desklib.com/media/document/docfile/pages/assessment-item-3-1-n12a/2024/09/12/d67a64ac-228e-4268-84c4-45d6a1061220-page-1.webp)
Running head: ASSESSMENT ITEM 3
1
Assessment Item 3
Name
Institution
1
Assessment Item 3
Name
Institution
Secure Best Marks with AI Grader
Need help grading? Try our AI Grader for instant feedback on your assignments.
![Document Page](https://desklib.com/media/document/docfile/pages/assessment-item-3-1-n12a/2024/09/12/444b3573-ce5a-426f-b4ab-e8ddaacbe178-page-2.webp)
ASSESSMENT ITEM 3
2
Assessment Item 3
Question 1
a). Advantages of payoff matrix
Payoff matrix encompasses stimulating an individual to determine the disadvantages and the
advantages of a behavior or action together with the disadvantages and advantages of not
undertaking the behavior or action (Parks & Hulbert. 2015).
It can be utilized to assist an individual choose whether to halt smoking marijuana.
Steps required in developing the payoff matrix
Understand objects and identify the decision situation (Dufournaud. 2012).
Determine the alternatives.
Model and decompose the problem.
Select the ideal alternative.
Execute the selected alternative.
b). Advantages of decision trees
1. They absolutely undertake feature selection or screening (Kingsford, C., & Salzberg, 2018).
2. They need comparatively small effort for preparation of data
3. Nonlinear associations between parameters do not influence the performance of the tree.
Decision trees are preferred to payoff matrix because it is easy to explain to executives and easy
to interpret (Quinlan, J. R. 2017).
C.) (1)
Event 1 Event 2
Probability 0.6 0.4
Alternative 1 50,000 -40,000
Alternative 2 30,000 -20,000
![Document Page](https://desklib.com/media/document/docfile/pages/assessment-item-3-1-n12a/2024/09/12/918029ff-7768-4443-9f81-03d11ed6363b-page-3.webp)
ASSESSMENT ITEM 3
3
Alternative 3 0 0
EMV (alternative) = ($ 50,000)(0.6) + (-$ 40,000)(0.4)
= $ 14,000
EMV (alternative) = ($ 30,000)(0.6)+ (- 20,000)(0.4)
= $ 10,000
EMV (alternative 3) = 0
The ideal option is to buy the, the large robot
2.) The decision that is optimistic. These are 50,000, 30,000, and 0.
The decision is to buy the large robot (alternative 1).
Event Event
Probability 0.6 0.4
Alternative 1 50,000 -40,000
Alternative 2 30,000 -20,000
Alternative 3 0 0
3). The decision that is pessimist. These are -40,000, -20,000, and 0.
The decision is to do nothing.
4). Laplace criterion
Average (alternative 1) = [$ 50,000 + (-40,000)]/2
Average (alternative 2) = [$ 30,000 + (- $ 20,000)]/2
=$ 5,000
Average (alternative 3) = 0
5). Criterion of regret
Alternatives Favorable market Unfavorable market Maximum in row
Rob 1 0 40,000 40,000
Rob 2 20,000 20,000 20,000
Nothing 50,000 0 50,000
![Document Page](https://desklib.com/media/document/docfile/pages/assessment-item-3-1-n12a/2024/09/12/f56e6b26-56f0-4936-a9a4-271154e1f8e5-page-4.webp)
ASSESSMENT ITEM 3
4
6). EMV (alternative 1) = ($ 50,000)(0.6) +(-$ 40,000)(0.4)= $14,000
The option that minimizes the maximum opportunity loss is Rob 2.
7). Rob 1 has a maximum opportunity cost of $ 40,000
2a.
Results of survey Favorable market (FM) Unfavorable Market
Positive (P) P (P)FM)-0.9 P(P UM)-0.2
Negative (N) P (N) FM)-0.1 P(N UM)-0.8
P (FM) =0.6 P (UM) = 0.4
Probability revision given a positive survey outcome
State of nature Conditional
probability
Prior prob Joint prob Posterior
probability
FM 0.9 0.6 0.54 0.54/0.62-0.871
UM 0.2 0.4 0.08 0.08/0.62-0.842
Total 0.62 1.00
b). EVSI=$ 23,802-$ 14,000 = 9,802
ENGSI=$ 23,802-$ 5000 = 18,802
d). $ 23,802
3.
Demand Probability No-shows Proba
5 0.05 0 0.15
Secure Best Marks with AI Grader
Need help grading? Try our AI Grader for instant feedback on your assignments.
![Document Page](https://desklib.com/media/document/docfile/pages/assessment-item-3-1-n12a/2024/09/12/6c1f837b-5161-4c67-aac8-ff30967ef196-page-5.webp)
ASSESSMENT ITEM 3
5
6 0.11 1 0.25
7 0.20 2 0.26
8 0.18 3 0.23
9 0.16 4 0.11
10 0.12
11 0.10
12 0.08
5
6 0.11 1 0.25
7 0.20 2 0.26
8 0.18 3 0.23
9 0.16 4 0.11
10 0.12
11 0.10
12 0.08
![Document Page](https://desklib.com/media/document/docfile/pages/assessment-item-3-1-n12a/2024/09/12/0bb76cc6-ef4a-45e1-a301-ebf3c192bb31-page-6.webp)
ASSESSMENT ITEM 3
6
2. I recommend that ABC airlines use “Scenario Manager” to decide the optimal “overbooking
level” to maximize the expected profit.
3. The profitability of ABC airlines is as indicated below
B3: number of accepted reservations = capacity (=6)+ number of overbooking (=3)
B4: actual demand =LOOKUP(RAND(),$D$6:$D$13,$E$6:$E$13)
B5: number of reservations taken =MIN(B3,B4)
B6: number of no shows =LOOKUP(RAND(),$D$16:$D$20,$E$16:$E$20)
B7: number of passengers that show up =B5-B6
![Document Page](https://desklib.com/media/document/docfile/pages/assessment-item-3-1-n12a/2024/09/12/d15dee50-2861-4a7e-83cf-4d08ad513249-page-7.webp)
ASSESSMENT ITEM 3
7
B8: number of seats short =MAX (0,B7-6)
B9: revenue = $79 × actual reservation accepted (=B5)
B10: overbooking cost =B8*(100+79)
B11 : profit = B9-B10-$350
4.
a
7
B8: number of seats short =MAX (0,B7-6)
B9: revenue = $79 × actual reservation accepted (=B5)
B10: overbooking cost =B8*(100+79)
B11 : profit = B9-B10-$350
4.
a
Paraphrase This Document
Need a fresh take? Get an instant paraphrase of this document with our AI Paraphraser
![Document Page](https://desklib.com/media/document/docfile/pages/assessment-item-3-1-n12a/2024/09/12/71a8339b-ff02-4e29-bda4-d1fecb3913c5-page-8.webp)
ASSESSMENT ITEM 3
8
8
![Document Page](https://desklib.com/media/document/docfile/pages/assessment-item-3-1-n12a/2024/09/12/e93bc1b7-cfc5-4ee5-93aa-9787009d0166-page-9.webp)
ASSESSMENT ITEM 3
9
Answer:
1)
9
Answer:
1)
![Document Page](https://desklib.com/media/document/docfile/pages/assessment-item-3-1-n12a/2024/09/12/4e3483c1-d10e-44cc-8cbe-2e6462d68d73-page-10.webp)
ASSESSMENT ITEM 3
10
Contributions per unit price=sale price per unit –variable cost per unit
Contribution per unit=12-6=$ 6
Break-even point in units=Fixed costs/Contribution per unit
Break-even point in units=1200/6=200 units
Break-even point in sales revenue=200*12=$ 2400
In units = 200 units
In dollars = $ 2,400
2)
Number of units to earn desired income= (Fixed costs + Desired Net Income)/ contribution per
units
Number of Units to earn desired income= (1200+600)/6
Number of Units to earn desired income= 300 units
Margin of safety = ((Total units sold- Break even units)/ Total units sold)*100
Margin of safety= ((300-200)/300)*100
Margin safety = 33.33%
Margin of safety in terms of units=100 units
3)
Profit earned by selling 250 units:
Total contribution= 250*6=1500
Net income=Total contribution –fixed cost
Net income=$ 1500- $ 1200
Net income= $ 300
Secure Best Marks with AI Grader
Need help grading? Try our AI Grader for instant feedback on your assignments.
![Document Page](https://desklib.com/media/document/docfile/pages/assessment-item-3-1-n12a/2024/09/12/4a6c5e25-7285-4bed-a565-732a10fb29cd-page-11.webp)
ASSESSMENT ITEM 3
11
4) Pretax profit = 1400/70%
Pretax profit=$ 2000
If ax rate =30%, then, 1,400 should be 70% (100-30), hence to get the entire amount of pretax
profit, we have to divide by 70 %
A B Total
Units sold 2 1
Selling price per unit 12 20
Variable cost per unit 6 20
Contribution per unit 6 12
Calculation (12-6) (20-8)
Contribution in ratio 12 12 24
Number of Units to earn desired income= (Fixed costs + desired net income)/composite
contribution
Number of units to earn desired income= (5200+2000)/24
Number of units to earn desired income= 300 composite units
This means:
Product A number of units required = (300*2) =600
Product B Number of Units Required = (300*1) =300
![Document Page](https://desklib.com/media/document/docfile/pages/assessment-item-3-1-n12a/2024/09/12/2b7514a6-69f3-4ea4-88bc-c1c693e1adf2-page-12.webp)
ASSESSMENT ITEM 3
12
References
Dufournaud, C. M. (2012). On the mutually beneficial cooperative scheme: Dynamic change in
the payoff matrix of international river basin schemes. Water Resources Research, 18(4),
764-772.
Kingsford, C., & Salzberg, S. L. (2018). What are decision trees?. Nature biotechnology, 26(9),
1011.
Parks, C. D., & Hulbert, L. G. (2015). High and low trusters' responses to fear in a payoff
matrix. Journal of conflict resolution, 39(4), 718-730.
Quinlan, J. R. (2017). Simplifying decision trees. International journal of man-machine
studies, 27(3), 221-234.
1 out of 12
Related Documents
![[object Object]](/_next/image/?url=%2F_next%2Fstatic%2Fmedia%2Flogo.6d15ce61.png&w=640&q=75)
Your All-in-One AI-Powered Toolkit for Academic Success.
+13062052269
info@desklib.com
Available 24*7 on WhatsApp / Email
Unlock your academic potential
© 2024 | Zucol Services PVT LTD | All rights reserved.