logo

SPSS Statistics Assignment

The aim of this assignment is to practise using SPSS to analyse data and interpret the results. The assignment requires formatting the results as they would be presented in a research report.

8 Pages2003 Words198 Views
   

Added on  2022-11-30

About This Document

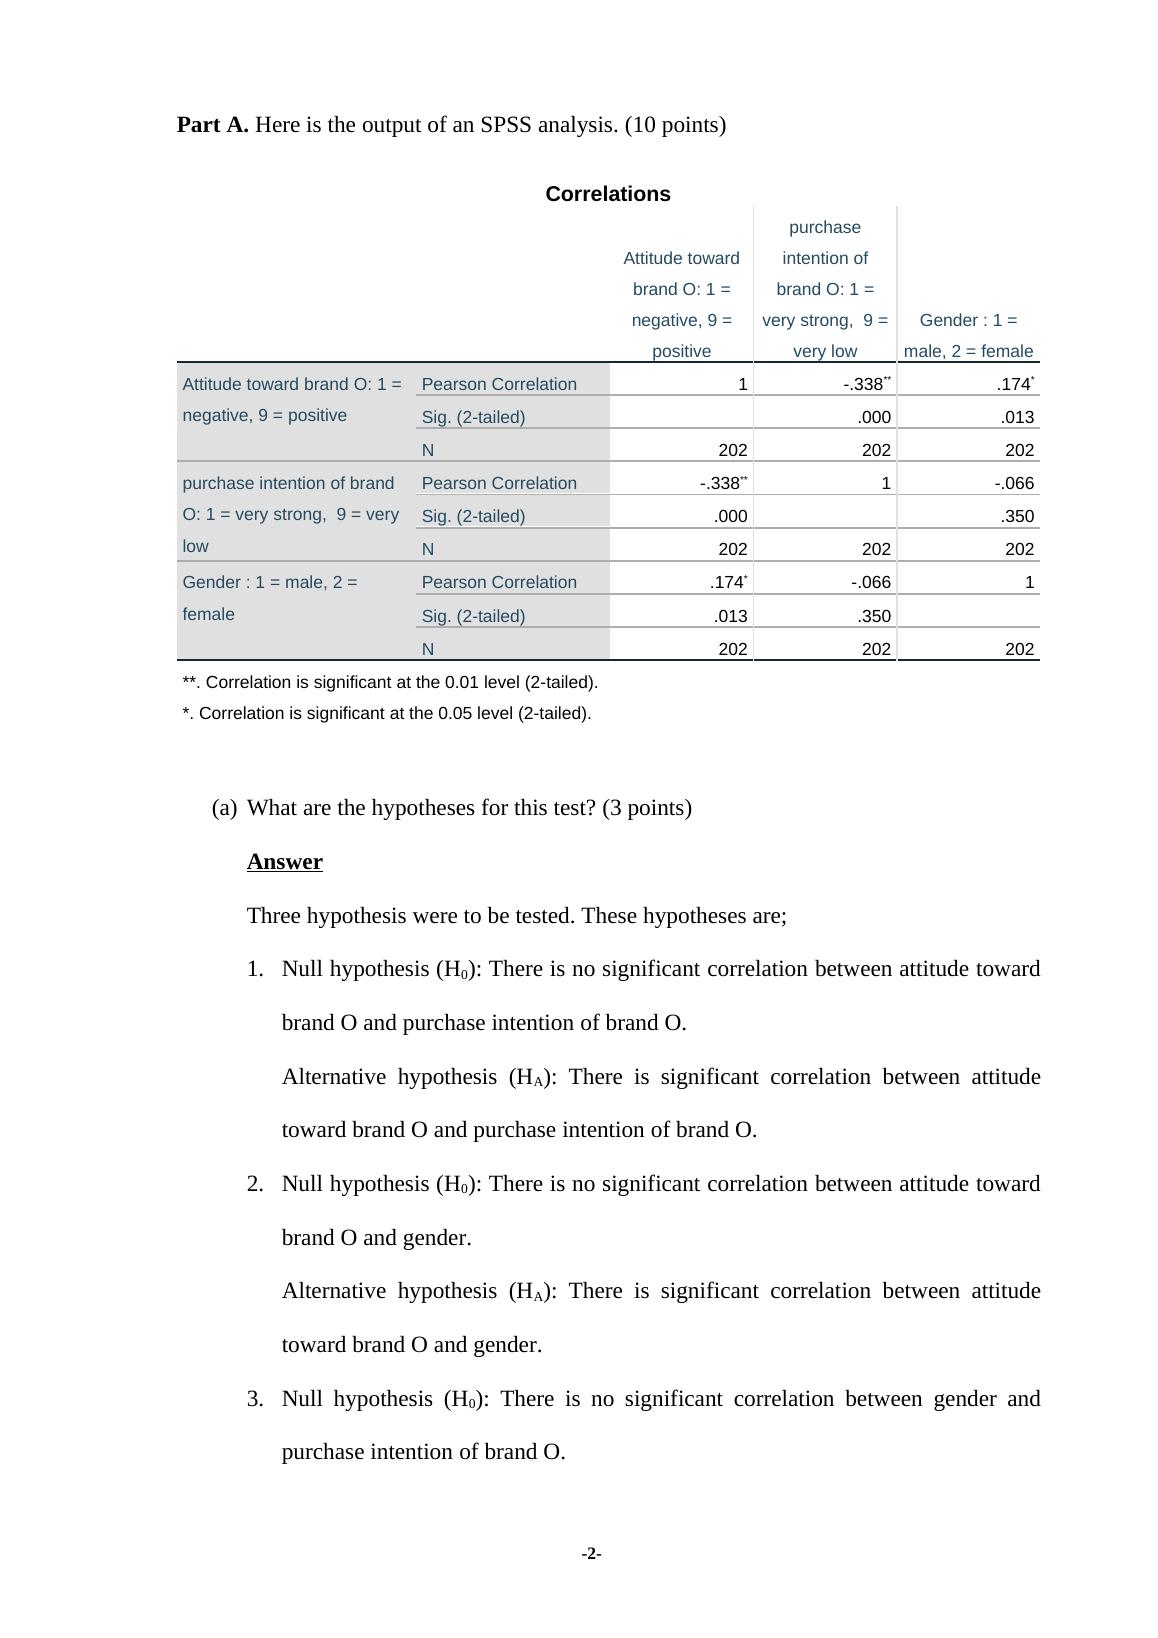
This document is an SPSS Statistics Assignment that includes correlations, hypotheses, and results interpretation. It covers the relationship between attitude toward brand O and purchase intention, gender, and income level. The document also includes a two-way ANOVA analysis on attitude toward brand O based on gender and income level.

SPSS Statistics Assignment

The aim of this assignment is to practise using SPSS to analyse data and interpret the results. The assignment requires formatting the results as they would be presented in a research report.

   Added on 2022-11-30

ShareRelated Documents
Assignment 2
SPSS Statistics Assignment
Student Name:
Instructor Name:
Course Number:
24 April 2019
-1-
SPSS Statistics Assignment_1
Part A. Here is the output of an SPSS analysis. (10 points)
Correlations
Attitude toward
brand O: 1 =
negative, 9 =
positive
purchase
intention of
brand O: 1 =
very strong, 9 =
very low
Gender : 1 =
male, 2 = female
Attitude toward brand O: 1 =
negative, 9 = positive
Pearson Correlation 1 -.338** .174*
Sig. (2-tailed) .000 .013
N 202 202 202
purchase intention of brand
O: 1 = very strong, 9 = very
low
Pearson Correlation -.338** 1 -.066
Sig. (2-tailed) .000 .350
N 202 202 202
Gender : 1 = male, 2 =
female
Pearson Correlation .174* -.066 1
Sig. (2-tailed) .013 .350
N 202 202 202
**. Correlation is significant at the 0.01 level (2-tailed).
*. Correlation is significant at the 0.05 level (2-tailed).
(a) What are the hypotheses for this test? (3 points)
Answer
Three hypothesis were to be tested. These hypotheses are;
1. Null hypothesis (H0): There is no significant correlation between attitude toward
brand O and purchase intention of brand O.
Alternative hypothesis (HA): There is significant correlation between attitude toward
brand O and purchase intention of brand O.
2. Null hypothesis (H0): There is no significant correlation between attitude toward
brand O and gender.
Alternative hypothesis (HA): There is significant correlation between attitude toward
brand O and gender.
3. Null hypothesis (H0): There is no significant correlation between gender and
purchase intention of brand O.
-2-
SPSS Statistics Assignment_2
Alternative hypothesis (HA): There is significant correlation between gender and
purchase intention of brand O.
(b) Report the results and interpret the results (7 points).
Answer
In the first hypothesis, a Pearson product-moment correlation coefficient was performed
to investigate the relationship between attitude toward brand O and purchase intention of
brand O. There was a weak but significant negative correlation between the two
variables, r = -0.338, n = 202, p = 0.000. This implies that an increase in the attitude
toward brand O levels would result to an increase in the levels of purchase intention of
the brand (brand O).
In the second hypothesis, again a Pearson product-moment correlation coefficient was
performed to investigate the relationship between attitude toward brand O and gender.
There was a weak but significant positive correlation between the two variables, r =
0.174, n = 202, p = 0.013. This implies that a female is likely to a high attitude score
toward brand O as compared to the males.
Lastly, the third hypothesis used a Pearson product-moment correlation coefficient to
assess the relationship between gender and purchase intention of brand O. There was a
weak and very insignificant negative correlation between the two variables, r = -0.066, n
= 202, p = 0.350. This implies that gender does not significantly relate with the purchase
intention of brand O.
-3-
SPSS Statistics Assignment_3

End of preview

Want to access all the pages? Upload your documents or become a member.

Related Documents
Computation using SPSS Tools and Techniques
|8
|1484
|108

Comprehensive Healthcare Application - Assignment
|12
|1669
|35

Statistics: Confirmatory and Exploratory Analysis
|9
|1486
|41

A Study of Pattern and Attitude of Customers in Online Marketing
|11
|1719
|50

SPSS Online Exam
|5
|540
|50

Business Statistics
|8
|1540
|24