Statistics Assignment 2
VerifiedAdded on 2023/01/11
|8
|1606
|60
AI Summary
This assignment includes questions on hypothesis testing, correlation coefficient, and types of hypothesis tests. It also covers the effectiveness of Echinacea as a treatment for colds. Get help with Statistics Assignment 2 on Desklib.
Contribute Materials
Your contribution can guide someone’s learning journey. Share your
documents today.
Assignment NO. 2 week9-week14
Student Full Name:___________________________________ .
Student ID:__________________________________________ .
CRN No:____________________________________________ .
STATISTICS
(STAT-101)
Pre-MBA
Due Date: April 06, 2019
Total Marks: 7
Branch: _____________________________________________.
Student Full Name:___________________________________ .
Student ID:__________________________________________ .
CRN No:____________________________________________ .
STATISTICS
(STAT-101)
Pre-MBA
Due Date: April 06, 2019
Total Marks: 7
Branch: _____________________________________________.
Secure Best Marks with AI Grader
Need help grading? Try our AI Grader for instant feedback on your assignments.
STATISTICS (STAT-101) Pre MBA
Attempt all the Questions (1 mark each):
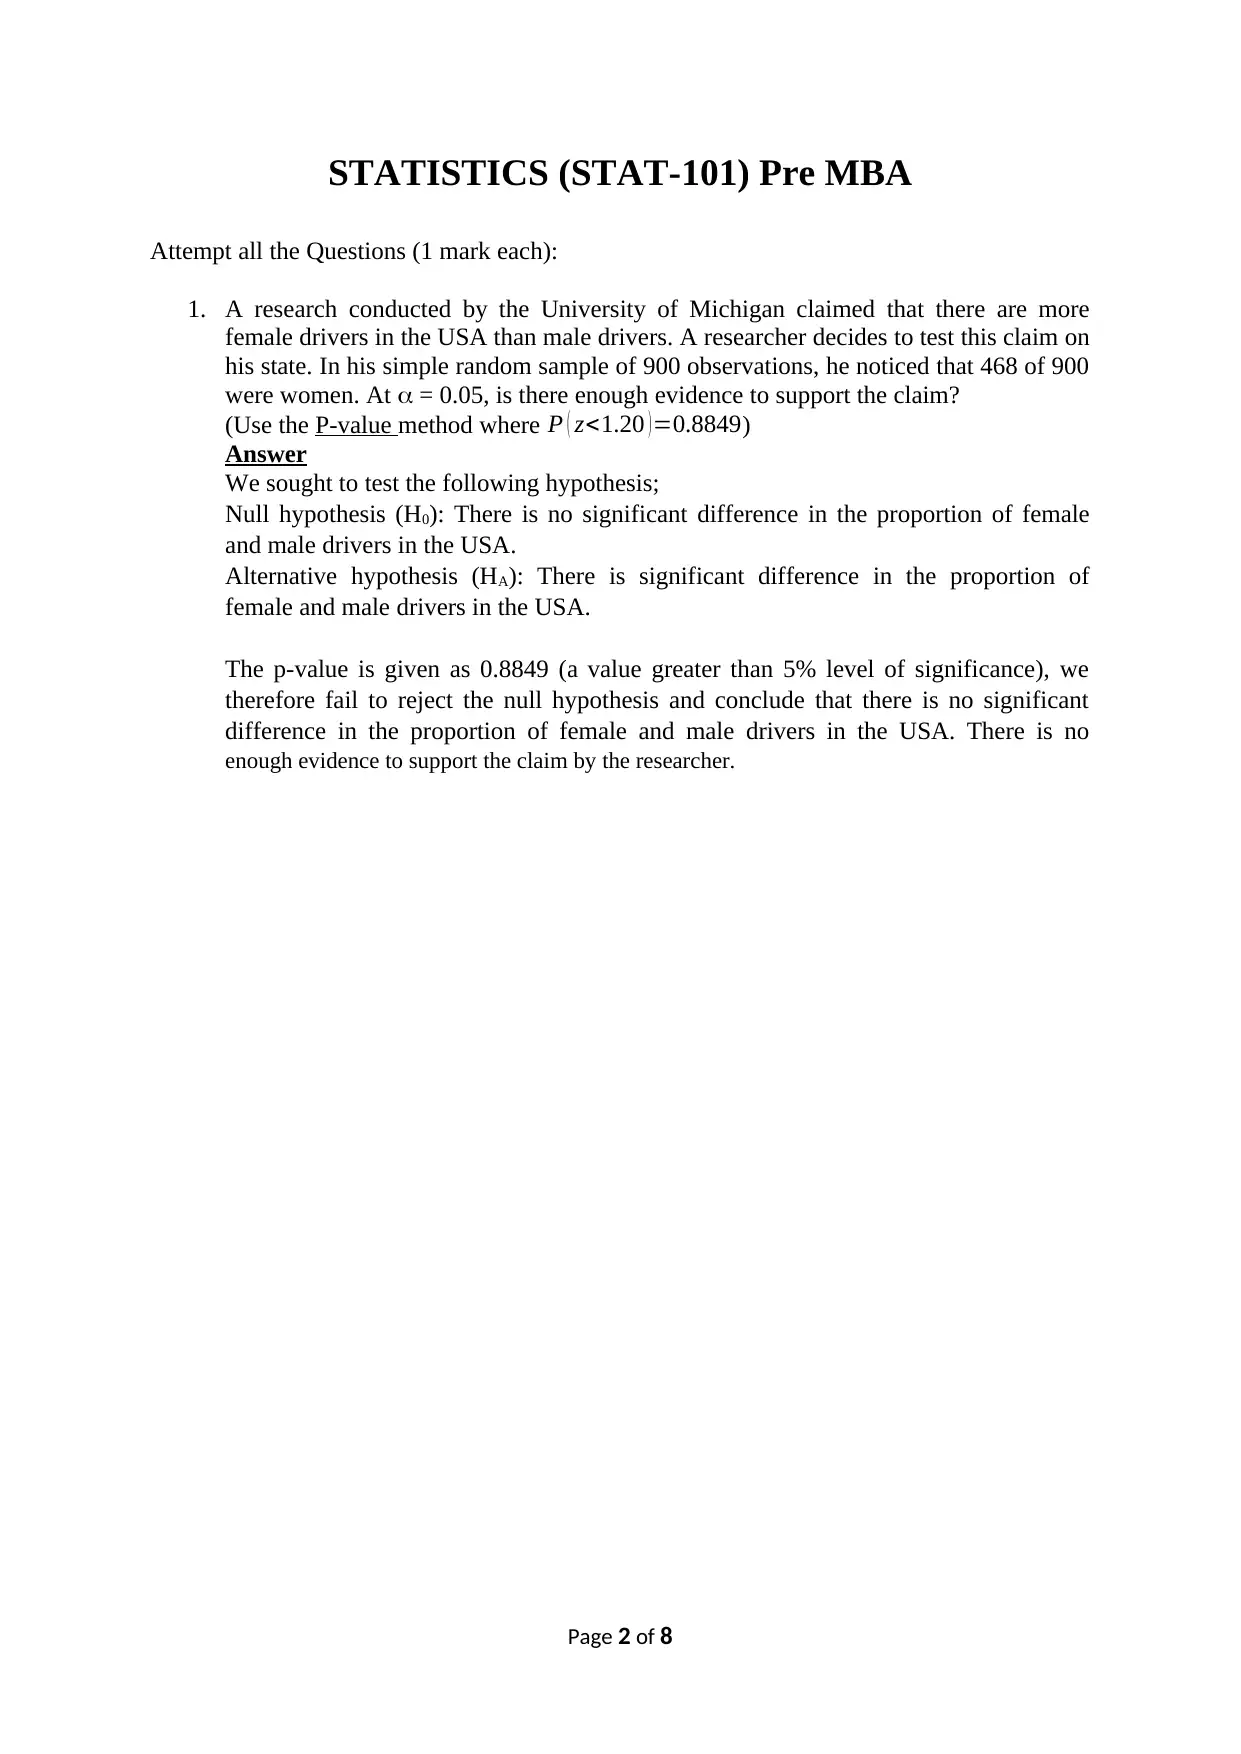
1. A research conducted by the University of Michigan claimed that there are more
female drivers in the USA than male drivers. A researcher decides to test this claim on
his state. In his simple random sample of 900 observations, he noticed that 468 of 900
were women. At = 0.05, is there enough evidence to support the claim?
(Use the P-value method where P ( z<1.20 )=0.8849)
Answer
We sought to test the following hypothesis;
Null hypothesis (H0): There is no significant difference in the proportion of female
and male drivers in the USA.
Alternative hypothesis (HA): There is significant difference in the proportion of
female and male drivers in the USA.
The p-value is given as 0.8849 (a value greater than 5% level of significance), we
therefore fail to reject the null hypothesis and conclude that there is no significant
difference in the proportion of female and male drivers in the USA. There is no
enough evidence to support the claim by the researcher.
Page 2 of 8
Attempt all the Questions (1 mark each):
1. A research conducted by the University of Michigan claimed that there are more
female drivers in the USA than male drivers. A researcher decides to test this claim on
his state. In his simple random sample of 900 observations, he noticed that 468 of 900
were women. At = 0.05, is there enough evidence to support the claim?
(Use the P-value method where P ( z<1.20 )=0.8849)
Answer
We sought to test the following hypothesis;
Null hypothesis (H0): There is no significant difference in the proportion of female
and male drivers in the USA.
Alternative hypothesis (HA): There is significant difference in the proportion of
female and male drivers in the USA.
The p-value is given as 0.8849 (a value greater than 5% level of significance), we
therefore fail to reject the null hypothesis and conclude that there is no significant
difference in the proportion of female and male drivers in the USA. There is no
enough evidence to support the claim by the researcher.
Page 2 of 8
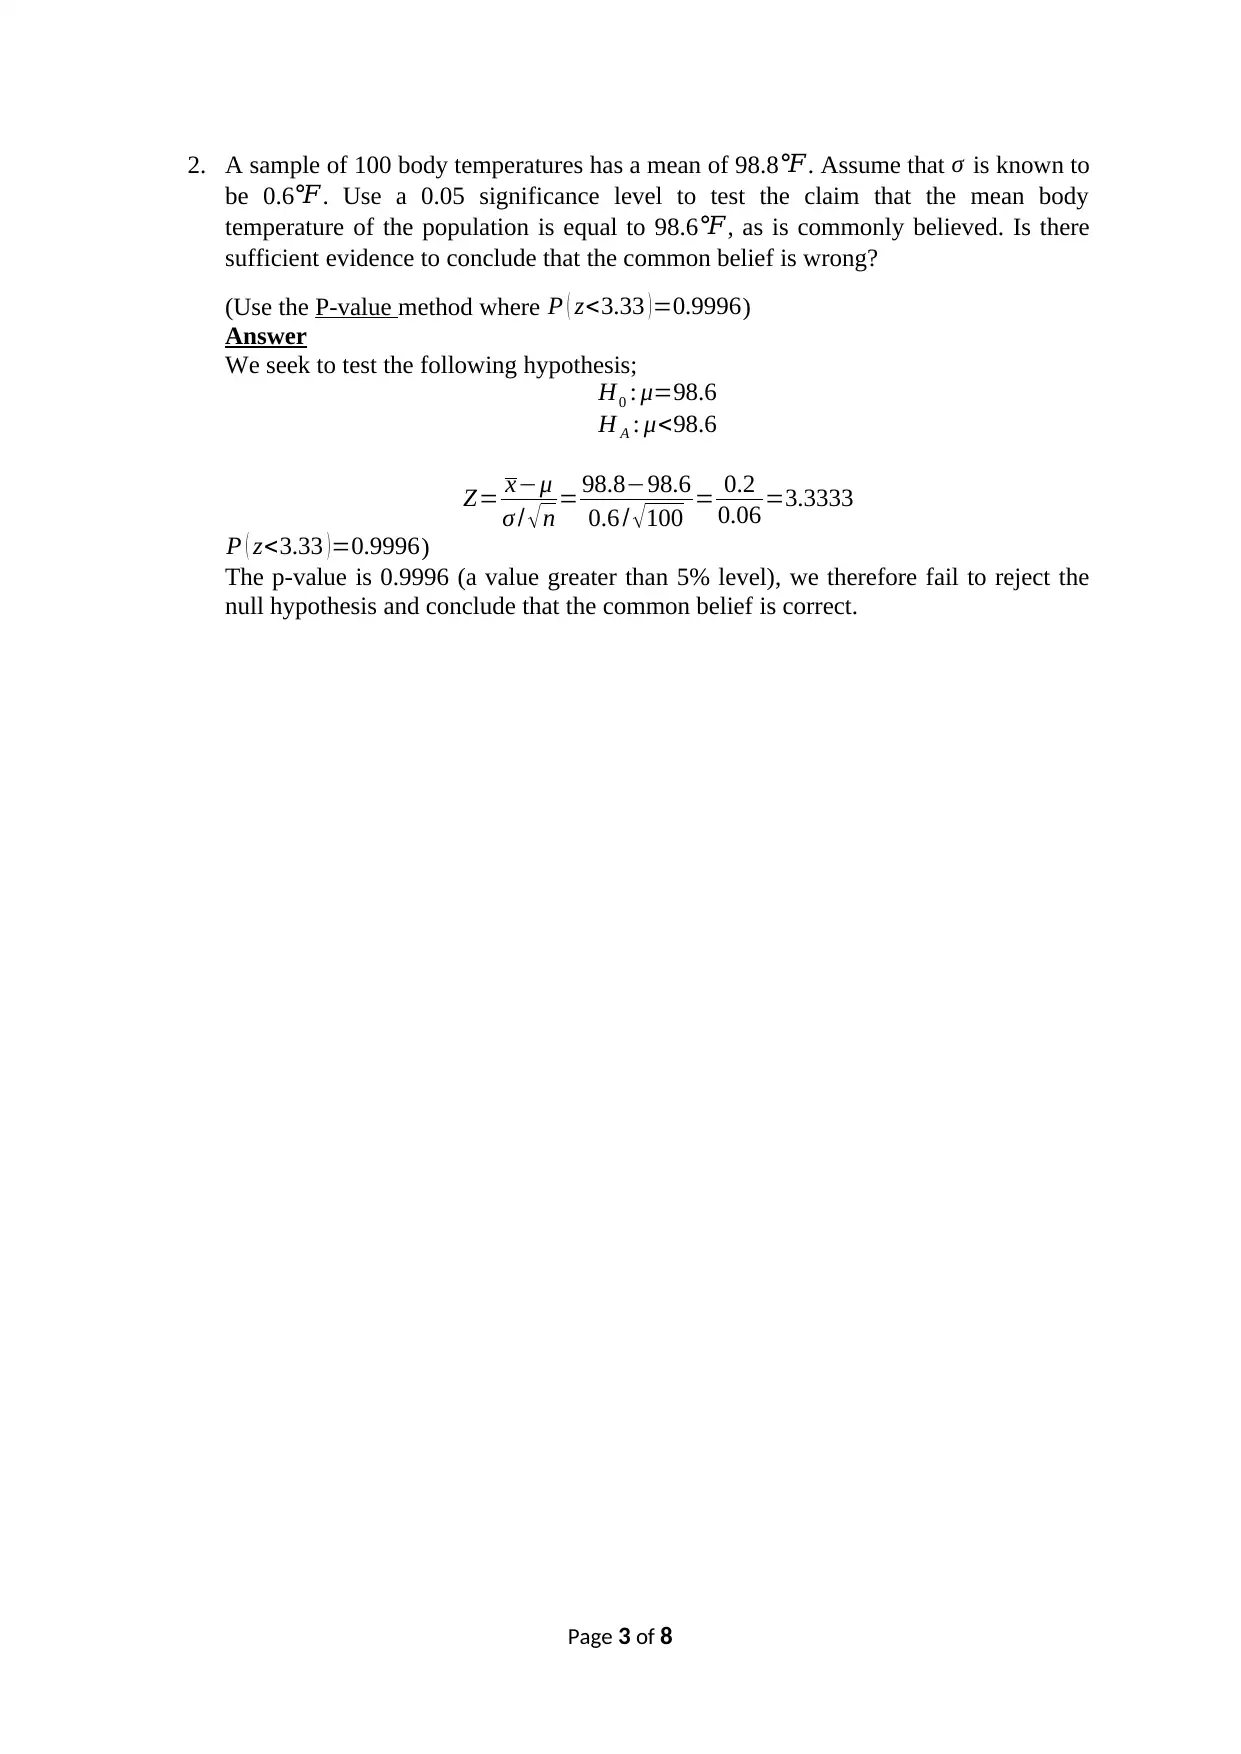
2. A sample of 100 body temperatures has a mean of 98.8℉. Assume that σ is known to
be 0.6℉. Use a 0.05 significance level to test the claim that the mean body
temperature of the population is equal to 98.6℉, as is commonly believed. Is there
sufficient evidence to conclude that the common belief is wrong?
(Use the P-value method where P ( z<3.33 ) =0.9996)
Answer
We seek to test the following hypothesis;
H0 : μ=98.6
H A : μ<98.6
Z= x−μ
σ / √n = 98.8−98.6
0.6 / √100 = 0.2
0.06 =3.3333
P ( z<3.33 )=0.9996)
The p-value is 0.9996 (a value greater than 5% level), we therefore fail to reject the
null hypothesis and conclude that the common belief is correct.
Page 3 of 8
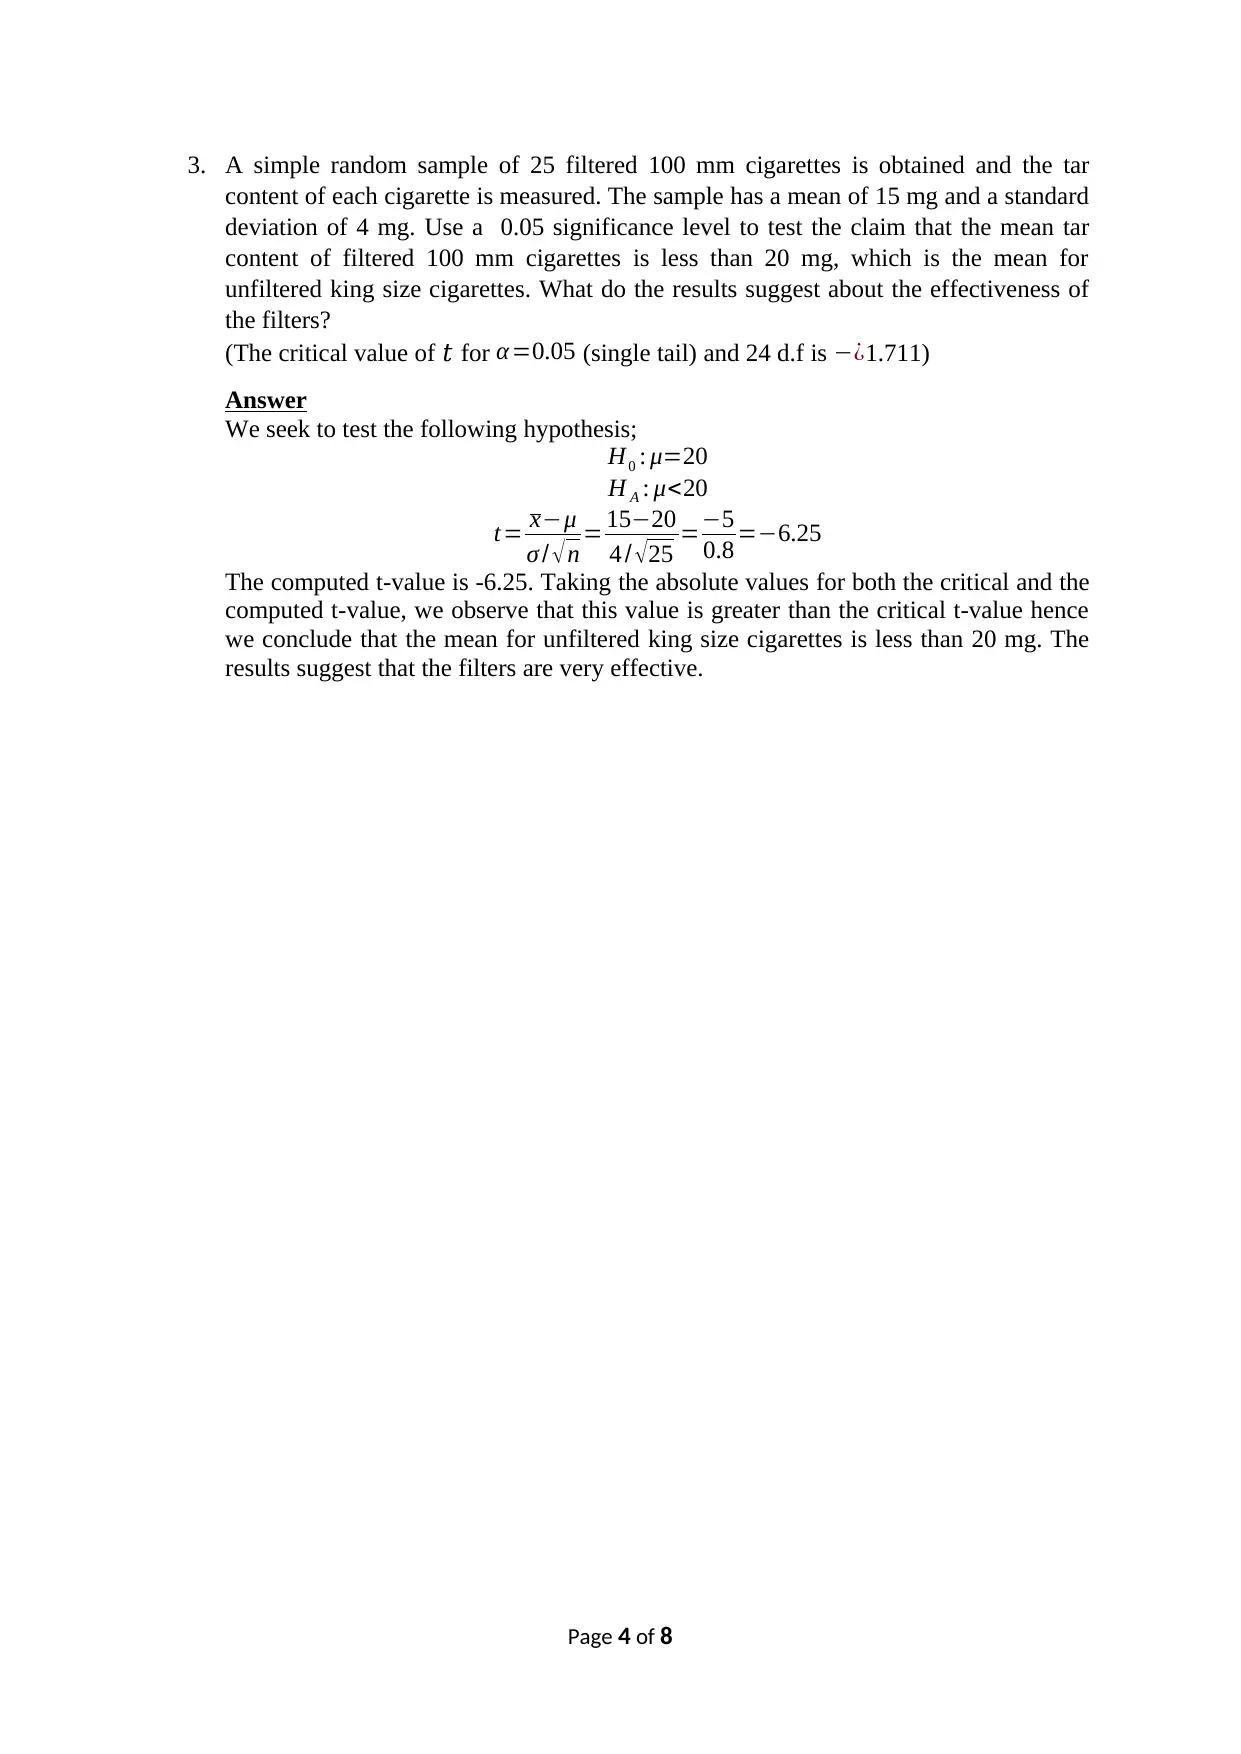
3. A simple random sample of 25 filtered 100 mm cigarettes is obtained and the tar
content of each cigarette is measured. The sample has a mean of 15 mg and a standard
deviation of 4 mg. Use a 0.05 significance level to test the claim that the mean tar
content of filtered 100 mm cigarettes is less than 20 mg, which is the mean for
unfiltered king size cigarettes. What do the results suggest about the effectiveness of
the filters?
(The critical value of 𝑡 for α=0.05 (single tail) and 24 d.f is −¿1.711)
Answer
We seek to test the following hypothesis;
H0 : μ=20
H A : μ<20
t= x−μ
σ / √n = 15−20
4 / √25 =−5
0.8 =−6.25
The computed t-value is -6.25. Taking the absolute values for both the critical and the
computed t-value, we observe that this value is greater than the critical t-value hence
we conclude that the mean for unfiltered king size cigarettes is less than 20 mg. The
results suggest that the filters are very effective.
Page 4 of 8
Secure Best Marks with AI Grader
Need help grading? Try our AI Grader for instant feedback on your assignments.
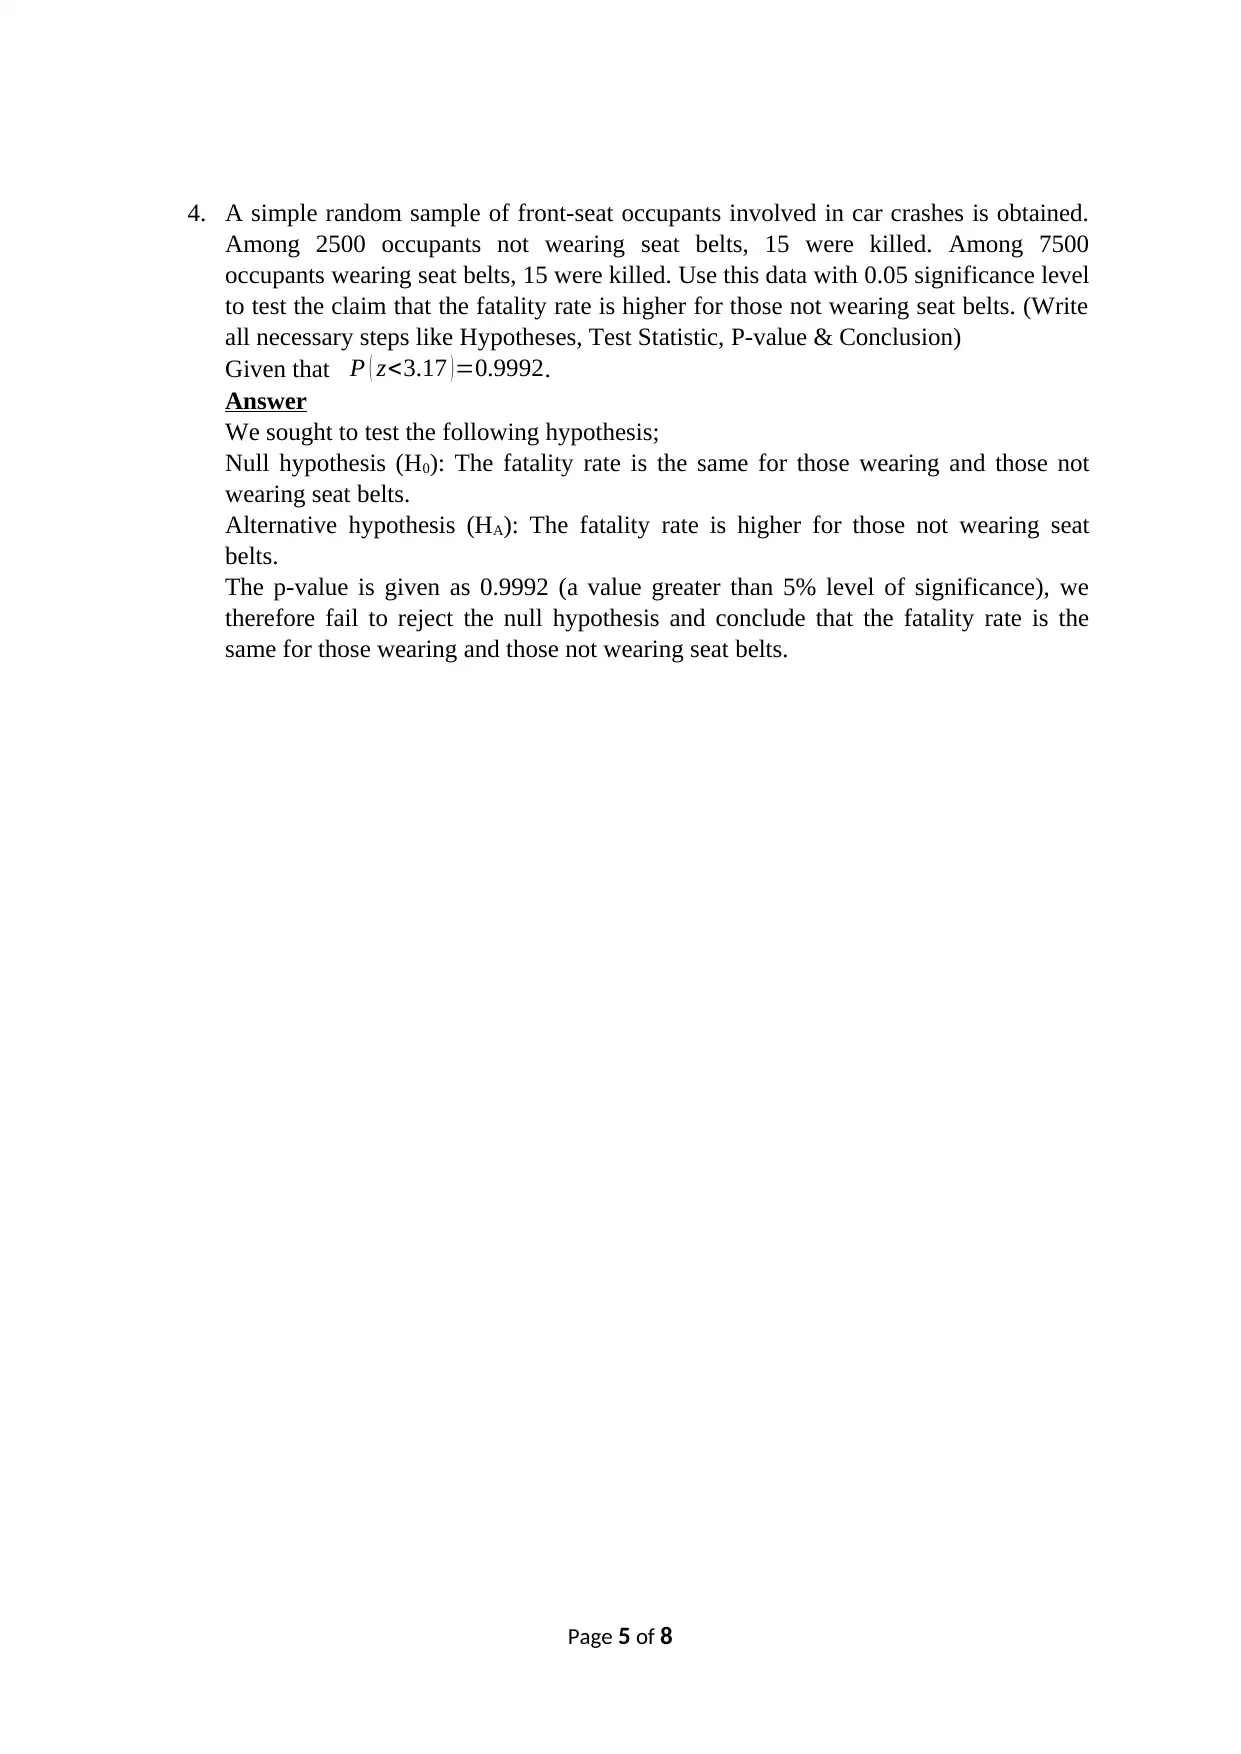
4. A simple random sample of front-seat occupants involved in car crashes is obtained.
Among 2500 occupants not wearing seat belts, 15 were killed. Among 7500
occupants wearing seat belts, 15 were killed. Use this data with 0.05 significance level
to test the claim that the fatality rate is higher for those not wearing seat belts. (Write
all necessary steps like Hypotheses, Test Statistic, P-value & Conclusion)
Given that P ( z<3.17 ) =0.9992.
Answer
We sought to test the following hypothesis;
Null hypothesis (H0): The fatality rate is the same for those wearing and those not
wearing seat belts.
Alternative hypothesis (HA): The fatality rate is higher for those not wearing seat
belts.
The p-value is given as 0.9992 (a value greater than 5% level of significance), we
therefore fail to reject the null hypothesis and conclude that the fatality rate is the
same for those wearing and those not wearing seat belts.
Page 5 of 8
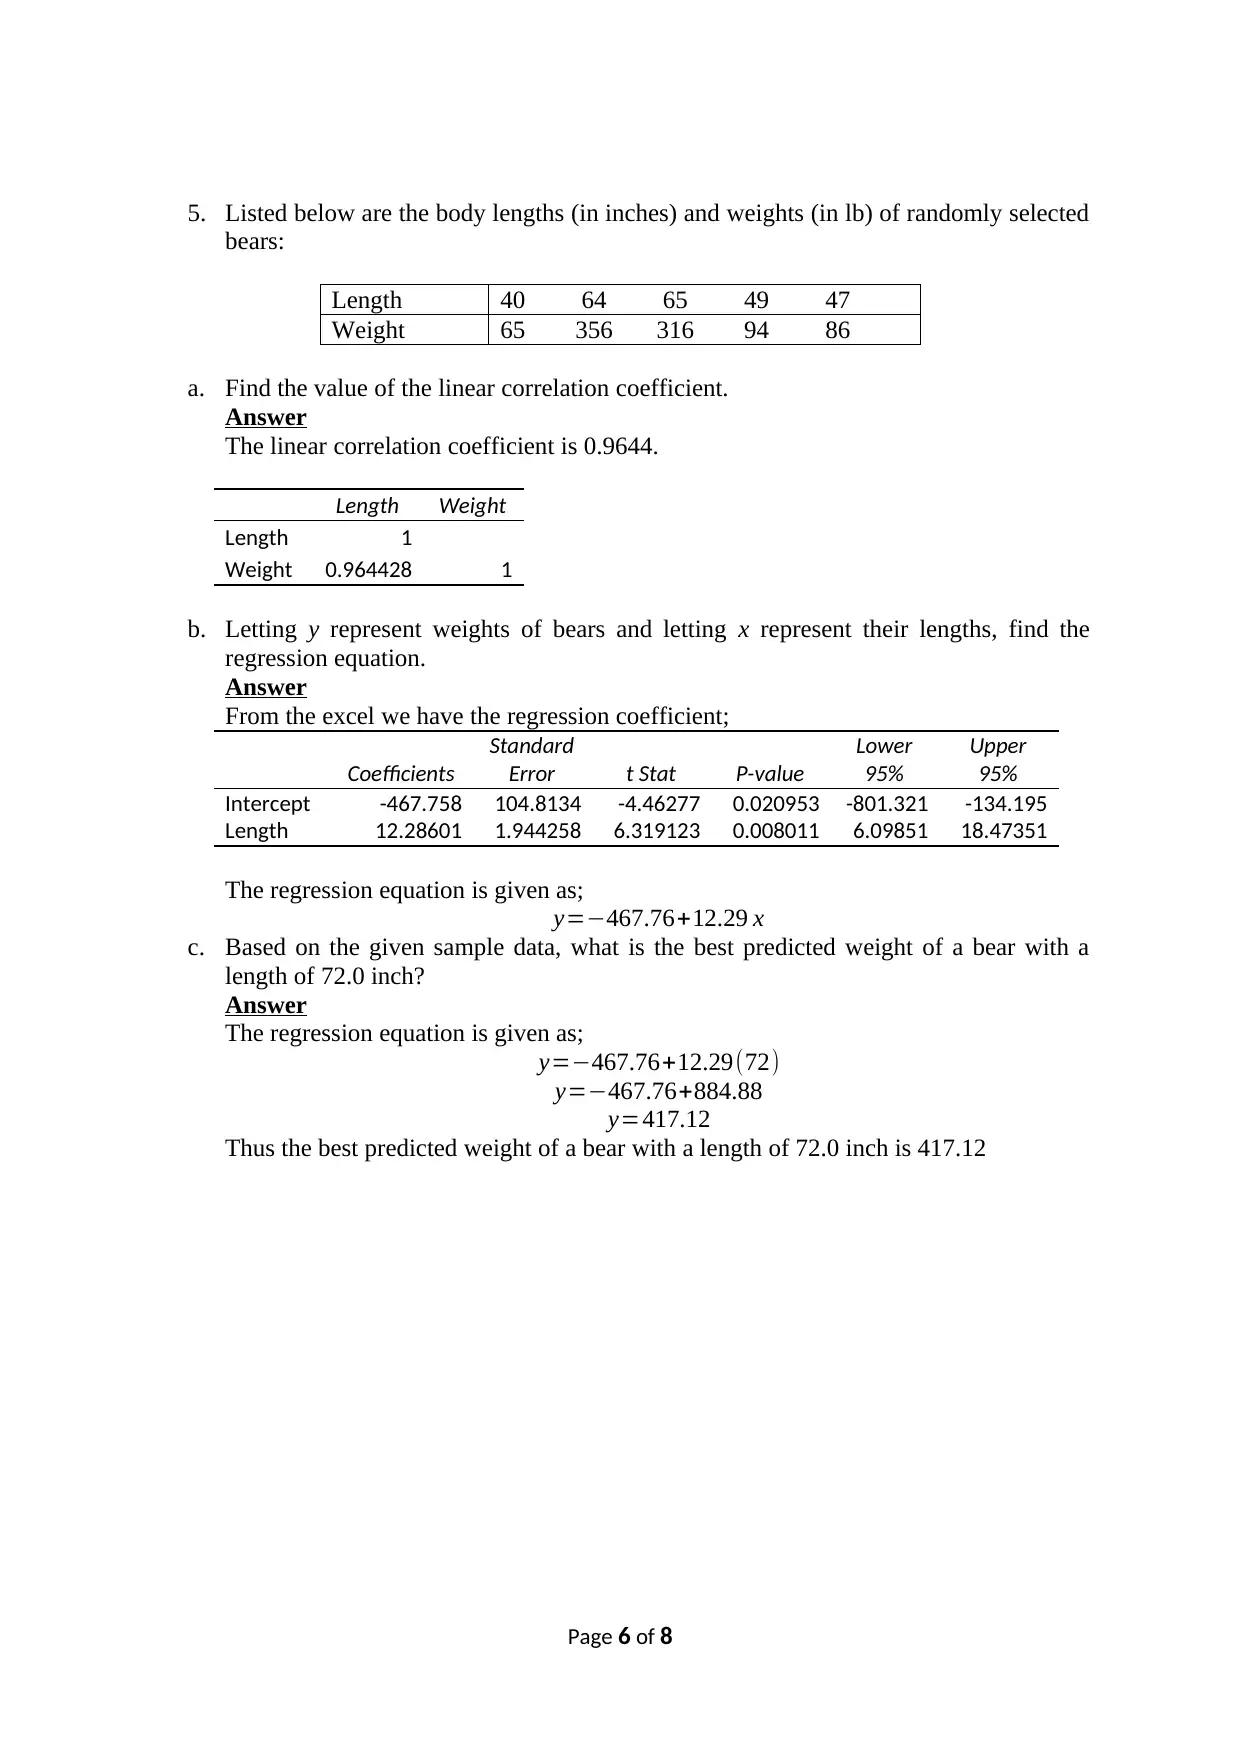
5. Listed below are the body lengths (in inches) and weights (in lb) of randomly selected
bears:
Length 40 64 65 49 47
Weight 65 356 316 94 86
a. Find the value of the linear correlation coefficient.
Answer
The linear correlation coefficient is 0.9644.
Length Weight
Length 1
Weight 0.964428 1
b. Letting y represent weights of bears and letting x represent their lengths, find the
regression equation.
Answer
From the excel we have the regression coefficient;
Coefficients
Standard
Error t Stat P-value
Lower
95%
Upper
95%
Intercept -467.758 104.8134 -4.46277 0.020953 -801.321 -134.195
Length 12.28601 1.944258 6.319123 0.008011 6.09851 18.47351
The regression equation is given as;
y=−467.76+12.29 x
c. Based on the given sample data, what is the best predicted weight of a bear with a
length of 72.0 inch?
Answer
The regression equation is given as;
y=−467.76+12.29(72)
y=−467.76+884.88
y=417.12
Thus the best predicted weight of a bear with a length of 72.0 inch is 417.12
Page 6 of 8
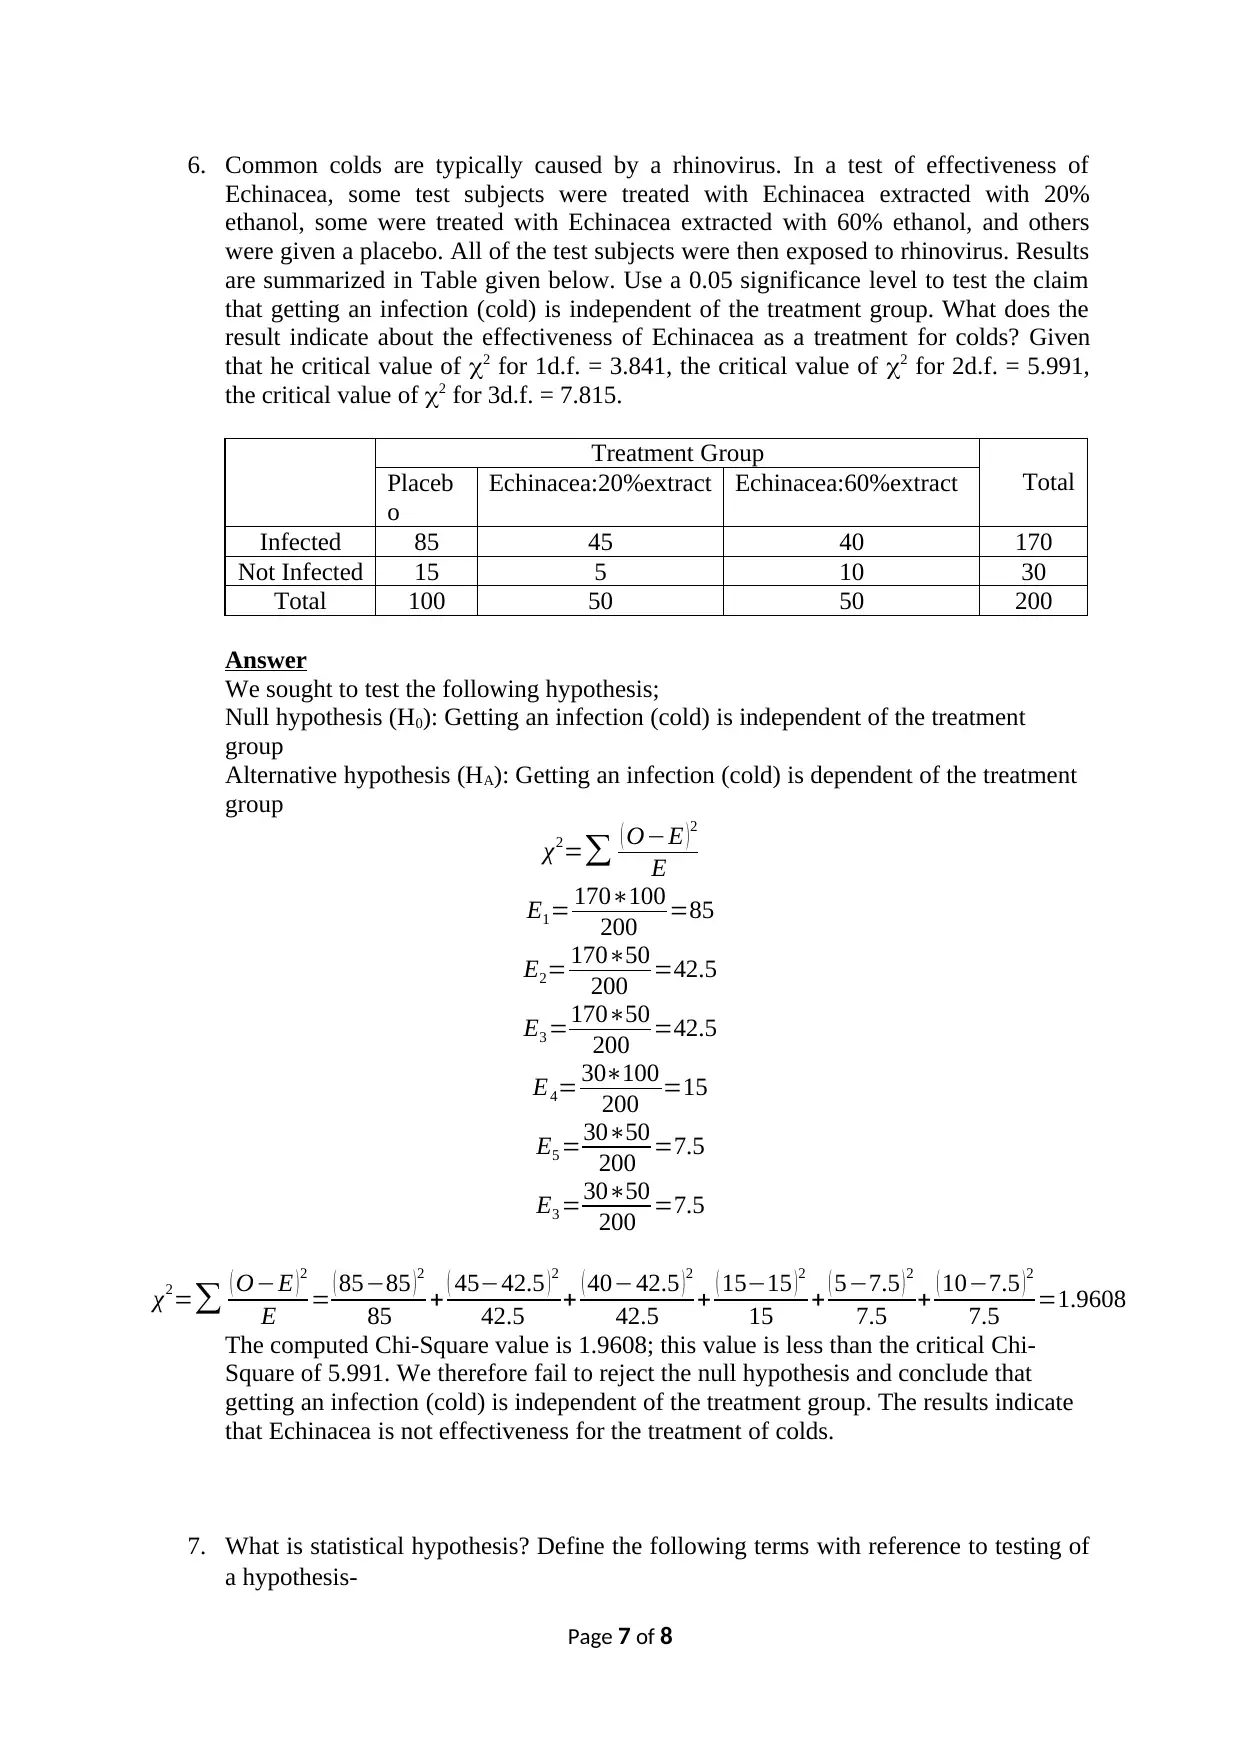
6. Common colds are typically caused by a rhinovirus. In a test of effectiveness of
Echinacea, some test subjects were treated with Echinacea extracted with 20%
ethanol, some were treated with Echinacea extracted with 60% ethanol, and others
were given a placebo. All of the test subjects were then exposed to rhinovirus. Results
are summarized in Table given below. Use a 0.05 significance level to test the claim
that getting an infection (cold) is independent of the treatment group. What does the
result indicate about the effectiveness of Echinacea as a treatment for colds? Given
that he critical value of 2 for 1d.f. = 3.841, the critical value of 2 for 2d.f. = 5.991,
the critical value of 2 for 3d.f. = 7.815.
Treatment Group
TotalPlaceb
o
Echinacea:20%extract Echinacea:60%extract
Infected 85 45 40 170
Not Infected 15 5 10 30
Total 100 50 50 200
Answer
We sought to test the following hypothesis;
Null hypothesis (H0): Getting an infection (cold) is independent of the treatment
group
Alternative hypothesis (HA): Getting an infection (cold) is dependent of the treatment
group
χ2=∑ ( O−E )2
E
E1= 170∗100
200 =85
E2= 170∗50
200 =42.5
E3 =170∗50
200 =42.5
E4= 30∗100
200 =15
E5 =30∗50
200 =7.5
E3 =30∗50
200 =7.5
χ2=∑ ( O−E ) 2
E = ( 85−85 ) 2
85 + ( 45−42.5 ) 2
42.5 + ( 40−42.5 ) 2
42.5 + ( 15−15 ) 2
15 + ( 5−7.5 ) 2
7.5 + ( 10−7.5 ) 2
7.5 =1.9608
The computed Chi-Square value is 1.9608; this value is less than the critical Chi-
Square of 5.991. We therefore fail to reject the null hypothesis and conclude that
getting an infection (cold) is independent of the treatment group. The results indicate
that Echinacea is not effectiveness for the treatment of colds.
7. What is statistical hypothesis? Define the following terms with reference to testing of
a hypothesis-
Page 7 of 8
Paraphrase This Document
Need a fresh take? Get an instant paraphrase of this document with our AI Paraphraser
(i) Null and Alternative Hypothesis
Answer
Null hypothesis refers to a hypothesis that states there is no significant
statistical difference between the two variables. This hypothesis is what
normally the experimenter or researcher tries to disprove or discredit.
Alternative hypothesis on the other hand refers to the hypothesis that states
that there exists a significant statistical relationship between two variables
(ii) Critical Region
Answer
Critical region refers to the region of values that corresponds to the rejection
of the null hypothesis at some selected level of probability.
(iii) Significance Level
Answer
Significance level refers to the probability of rejecting a null hypothesis by the
test when it is really true, and it is usually denoted as α.
(iv) Types of Hypothesis Tests
Answer
There are several types of hypothesis tests. The most commonly used
hypothesis are;
Chi-Square test of association
T-tests (Paired t-tests, independent t-tests and one-sample t-test)
Analysis of variance (ANOVA)
(v) Two types of Errors in Hypothesis Tests
Answer
There are two types of errors in hypothesis tests. Type I and Type II errors.
Type I error refers to the rejection of a true null hypothesis while Type II is the
error that occurs by failing to reject a false null hypothesis.
Page 8 of 8
Answer
Null hypothesis refers to a hypothesis that states there is no significant
statistical difference between the two variables. This hypothesis is what
normally the experimenter or researcher tries to disprove or discredit.
Alternative hypothesis on the other hand refers to the hypothesis that states
that there exists a significant statistical relationship between two variables
(ii) Critical Region
Answer
Critical region refers to the region of values that corresponds to the rejection
of the null hypothesis at some selected level of probability.
(iii) Significance Level
Answer
Significance level refers to the probability of rejecting a null hypothesis by the
test when it is really true, and it is usually denoted as α.
(iv) Types of Hypothesis Tests
Answer
There are several types of hypothesis tests. The most commonly used
hypothesis are;
Chi-Square test of association
T-tests (Paired t-tests, independent t-tests and one-sample t-test)
Analysis of variance (ANOVA)
(v) Two types of Errors in Hypothesis Tests
Answer
There are two types of errors in hypothesis tests. Type I and Type II errors.
Type I error refers to the rejection of a true null hypothesis while Type II is the
error that occurs by failing to reject a false null hypothesis.
Page 8 of 8
1 out of 8


Your All-in-One AI-Powered Toolkit for Academic Success.
+13062052269
info@desklib.com
Available 24*7 on WhatsApp / Email
![[object Object]](/_next/static/media/star-bottom.7253800d.svg)
Unlock your academic potential
© 2024 | Zucol Services PVT LTD | All rights reserved.