Assignment Report: Big Data Analytics
This is an assignment for the Big Data Analytics course in the Department of Computer Science. The assignment requires the submission of a report analyzing a final data file and answering three business or research questions.
13 Pages3914 Words13 Views
Added on 2022-08-24
Assignment Report: Big Data Analytics
This is an assignment for the Big Data Analytics course in the Department of Computer Science. The assignment requires the submission of a report analyzing a final data file and answering three business or research questions.
Added on 2022-08-24
ShareRelated Documents
Assignment Report: Big Data
Analytics
DO NOT PUT YOUR NAME OR ANY OTHER IDENTIFIER ON
THIS DOCUMENT
Section 1 — Upload final data file[pass/fail]
Before completing your report, you should ensure you have uploaded the
following:
● The final version of your data that you used for analysis, in ARFF format or
a standard .csv format (with attribute names in the first row)
Note: Failure to submit the above will result in a mark of zero for the whole
assessment. Anything you submit may be used by us for testing.
Word counts must be adhered to and anything exceeding the limit will not be
marked. Diagrams and/or screenshots may be used to support your discussion
where applicable. These should be readable at an appropriate size and there
should be no more than 5 in the whole document.
You should support your discussion with appropriate reference to relevant
sources using correct citation and reference structure as indicated in the guide
to the IEEE referencing system.
Section 2 — Business/research questions [10
marks]
1. [10 marks] State the three business or research questions that you
have attempted to answer through your analysis, and justify why
they are interesting (300 words maximum)
The data which is analysed in this project contains different attributes of
diabetic patients in the 130 US hospitals collected in the period from 1999 to
2008 [1].
The Business or research questions which are attempted to be answered in this
project are given as follows.
1) Whether number of lab procedure significantly related with the time
admitted in hospital.
1
2) Does HbA1c test results can be classified based on the factors like race,
gender, age, admission type, discharge deposition type, admission source
type, time in hospital, medical speciality, number of lab procedures and
readmission status.
3) What are the Optimum number of clusters of HbA1c tests results based on
the variables race, gender, age, admission type, discharge deposition type,
admission source type, time in hospital, medical speciality, number of lab
procedures and readmission status.
The first research question is very much important for the hospital to know
whether the time occupied by patient are mainly for HbA1c tests performed to
them. This gives the hospital the time efficiency of the test and if found
significant hospital can improve the process of HbA1c tests for reducing time
spent by patients in hospital which can be best for hospitals as well as the
patients [1]. The classification and clustering results give the knowledge of
groups of patients that can be classified based on HbA1c results with respect to
their physical and other attributes.
Section 3 — Processing the data [20 marks]
Evidence for learning outcomes: LO2 Manipulate a data set to extract statistics
and features
2. [10 marks] Describe how you explored the data, why you did it that
way, and what conclusions you drew about it (300 words maximum)
After exploring the data to find the variables that are of interest for the
research question, at first classification is done for the nominal type of variable
HbA1C results that has four classes namely None = for the patients for which
HbA1C test is not performed, >7 = for whom the test result index is more than
7, >8 = for whom the test result index is more than 8 and norm= for whom the
test result is normal. Now, as the variable is a nominal variable with four
classes hence, different bayes classifiers are used to classify the data available
in Weka which are Naivebayes, BayesNet, NaiveBayesMultinominalText and
NaiveBayesUpdateable [3]. It is found that the results of
NaiveBayesMultinominalText classifier is the most accurate among all the
classifiers and thus it is identified as the optimum classifier for classification of
HbA1c results.
Now, clustering is also performed on HbA1c results in terms of other variables
as filtered before and two clustering algorithm namely the popular k-means
algorithm and FarthestFirst algorithm are applied with varying cluster number
from 2 to 4. Now, it is found that both algorithm gives most accurate correctly
2
classified clusters when the number of clusters is 2. Hence, it is concluded that
the optimally the results can be classified into two clusters.
Now, classification by linear regression is applied to know the strength of
relationship between the variables time in hospital (as dependent) and number
of tests performed (as independent) to the patient. It is found that the
relationship is not significant as the correlation coefficient is low or in other
words the time is hospital is not significantly related with the number of tests
performed on the patients.
3. [10 marks] Describe the cleaning/fixing you did on the data, and why
(300 words)
The entire data has total of 50 variables most of those are not related to the
research questions. Thus, for answering the research questions the data is
explored to find the variables that are of interest first and those variables are
race, gender, age, weight, admission type id, discharge disposition id,
admission source id, time in hospital, medical speciality, number of lab
procedures performed, HbA1C results and readmission status. Now, the
variable weight has 97% missing instances and hence this variable is not used
in data analysis as only 3% of the instances are available as sample.
Furthermore the variable race also has a 2% of missing values corresponding
to 2273 instances. As the percentage of missing values in Race is low thus it is
not removed during the pre-processing. However, when performed data
analysis in Weka the missing instances are automatically list wise removed
before analysis.
Section 4 — Data analysis [40 marks]
Evidence for learning outcomes: LO3 Critically evaluate and apply data mining
techniques/tools to build a classifier or regression model, and predict values for
new examples
4. [10 marks] Explain what analysis techniques you used to answer
your business/research questions, and why (300 words maximum)
Classification is the best way to segregate any nominal class variable and as
the HbA1c test result is a nominal class variable, hence, different classification
algorithms is applied to answer the first research question. Secondly, clustering
3
is essential to see how many significant groups are there in the HbA1c test
result and thus it is essential to apply different clustering algorithm with
different number of clusters to identified significant groups in the data [2].
Lastly, to see if there exist a significant relationship between time spent by
patients in hospital and number of tests performed for the patients, the best
tool is regression as this gives a predictive model as well as the goodness of fit
to the data by various measures like the root-mean square error, correlation
coefficient, relative absolute error and coefficient of determination.
5. [10 marks] Summarise the results of your analysis (300 words
maximum)
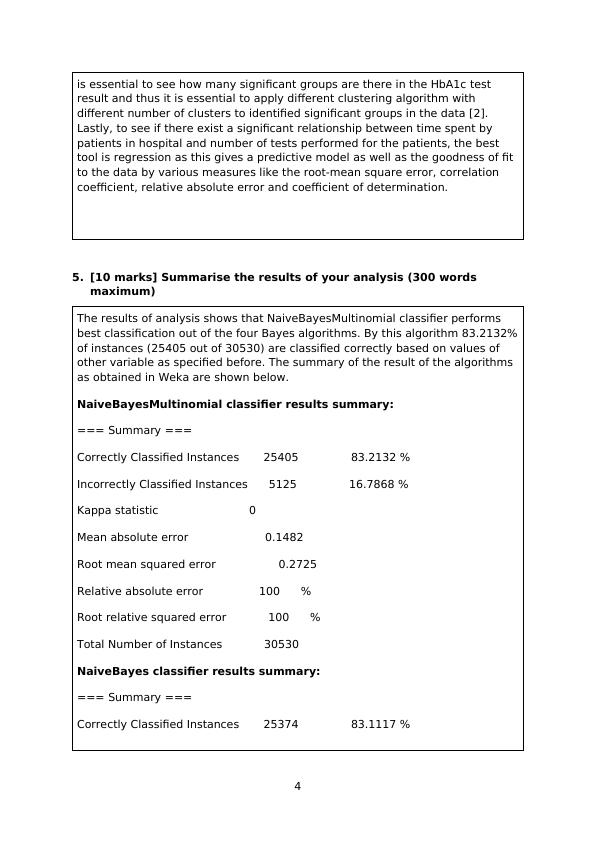
The results of analysis shows that NaiveBayesMultinomial classifier performs
best classification out of the four Bayes algorithms. By this algorithm 83.2132%
of instances (25405 out of 30530) are classified correctly based on values of
other variable as specified before. The summary of the result of the algorithms
as obtained in Weka are shown below.
NaiveBayesMultinomial classifier results summary:
=== Summary ===
Correctly Classified Instances 25405 83.2132 %
Incorrectly Classified Instances 5125 16.7868 %
Kappa statistic 0
Mean absolute error 0.1482
Root mean squared error 0.2725
Relative absolute error 100 %
Root relative squared error 100 %
Total Number of Instances 30530
NaiveBayes classifier results summary:
=== Summary ===
Correctly Classified Instances 25374 83.1117 %
4
result and thus it is essential to apply different clustering algorithm with
different number of clusters to identified significant groups in the data [2].
Lastly, to see if there exist a significant relationship between time spent by
patients in hospital and number of tests performed for the patients, the best
tool is regression as this gives a predictive model as well as the goodness of fit
to the data by various measures like the root-mean square error, correlation
coefficient, relative absolute error and coefficient of determination.
5. [10 marks] Summarise the results of your analysis (300 words
maximum)
The results of analysis shows that NaiveBayesMultinomial classifier performs
best classification out of the four Bayes algorithms. By this algorithm 83.2132%
of instances (25405 out of 30530) are classified correctly based on values of
other variable as specified before. The summary of the result of the algorithms
as obtained in Weka are shown below.
NaiveBayesMultinomial classifier results summary:
=== Summary ===
Correctly Classified Instances 25405 83.2132 %
Incorrectly Classified Instances 5125 16.7868 %
Kappa statistic 0
Mean absolute error 0.1482
Root mean squared error 0.2725
Relative absolute error 100 %
Root relative squared error 100 %
Total Number of Instances 30530
NaiveBayes classifier results summary:
=== Summary ===
Correctly Classified Instances 25374 83.1117 %
4
End of preview
Want to access all the pages? Upload your documents or become a member.
Related Documents
Are Lipid Profiles and Obesity Risk Factors for SSNHL?lg...
|10
|2280
|279
Security Procedures for Data Protection in Cloud Computinglg...
|22
|8040
|172
Exploring the Relationship between Dietary Flavonoids and AMDlg...
|12
|3001
|296