logo

Business Analytics: Mathematical Model, Costing and Revenue Behaviour, Advertising Impact on Sales, and Break-Even Analysis for Basu Plc

16 Pages4146 Words162 Views
   

Added on  2023-06-04

About This Document

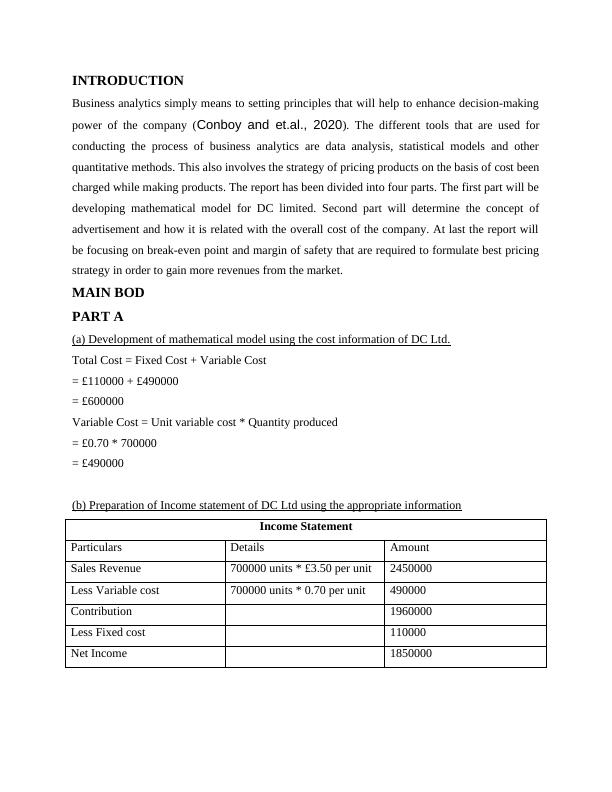
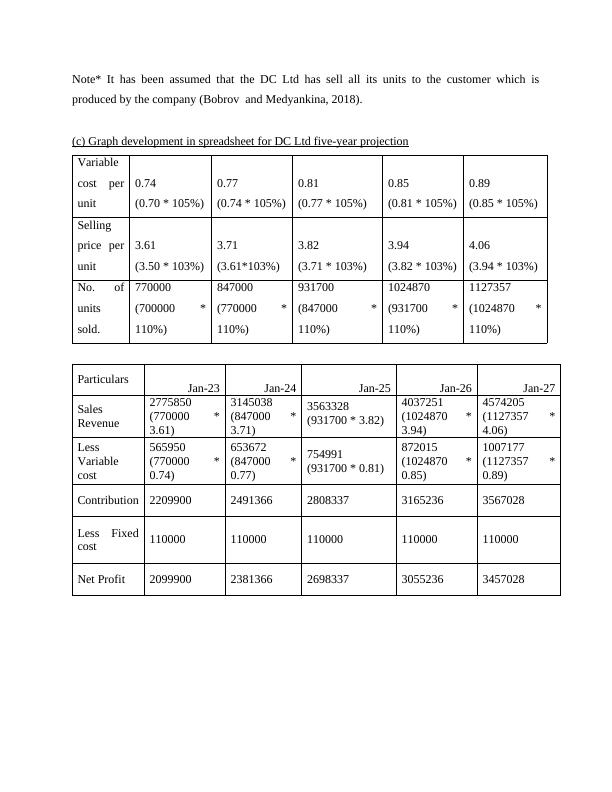
This report focuses on business analytics principles to enhance decision-making power of Basu Plc. It includes mathematical model development, income statement preparation, graph development for five-year projection, costing and revenue behaviour analysis, advertising impact on sales, and break-even analysis.

Business Analytics: Mathematical Model, Costing and Revenue Behaviour, Advertising Impact on Sales, and Break-Even Analysis for Basu Plc

   Added on 2023-06-04

ShareRelated Documents
BUSINESS ANALYTICS
Business Analytics: Mathematical Model, Costing and Revenue Behaviour, Advertising Impact on Sales, and Break-Even Analysis for Basu Plc_1
TABLE OF CONTENTS
INTRODUCTION...........................................................................................................................3
MAIN BOD.....................................................................................................................................3
PART A...........................................................................................................................................3
(a) Development of mathematical model using the cost information of DC Ltd........................3
(b) Preparation of Income statement of DC Ltd using the appropriate information....................3
(c) Graph development in spreadsheet for DC Ltd five-year projection.....................................4
(d) Comment on costing and revenue behaviour in general, in relation to DC Ltd before and
after projection.............................................................................................................................5
(a) Calculation of correlation coefficient between advertising and sales of Nice Wear Ltd.......7
(b) Scattered diagram of the data and comment on the relationship between advertisement and
sales variable................................................................................................................................8
(c) Critical analysis of impact of advertising expenditure on sales and recommendation of
relevant marketing tactics............................................................................................................9
Question: 3...................................................................................................................................9
a) Determine the following for Basu Plc.....................................................................................9
b) The company’s target profit for the year is £56000, Will the estimated sales volume be
sufficient to achieve this. By how much will profit from the estimated sales volume exceed or
fall short of the target profit.......................................................................................................11
C) Prepare a break even chart for Basu Ltd. showing clearly the break even point and margin
of safety......................................................................................................................................12
d) Critically analyse the benefits and limitations of the break even model. .............................12
CONCLUSION..............................................................................................................................14
REFERENCES..............................................................................................................................15
Business Analytics: Mathematical Model, Costing and Revenue Behaviour, Advertising Impact on Sales, and Break-Even Analysis for Basu Plc_2
INTRODUCTION
Business analytics simply means to setting principles that will help to enhance decision-making
power of the company (Conboy and et.al., 2020). The different tools that are used for
conducting the process of business analytics are data analysis, statistical models and other
quantitative methods. This also involves the strategy of pricing products on the basis of cost been
charged while making products. The report has been divided into four parts. The first part will be
developing mathematical model for DC limited. Second part will determine the concept of
advertisement and how it is related with the overall cost of the company. At last the report will
be focusing on break-even point and margin of safety that are required to formulate best pricing
strategy in order to gain more revenues from the market.
MAIN BOD
PART A
(a) Development of mathematical model using the cost information of DC Ltd.
Total Cost = Fixed Cost + Variable Cost
= £110000 + £490000
= £600000
Variable Cost = Unit variable cost * Quantity produced
= £0.70 * 700000
= £490000
(b) Preparation of Income statement of DC Ltd using the appropriate information
Income Statement
Particulars Details Amount
Sales Revenue 700000 units * £3.50 per unit 2450000
Less Variable cost 700000 units * 0.70 per unit 490000
Contribution 1960000
Less Fixed cost 110000
Net Income 1850000
Business Analytics: Mathematical Model, Costing and Revenue Behaviour, Advertising Impact on Sales, and Break-Even Analysis for Basu Plc_3
Note* It has been assumed that the DC Ltd has sell all its units to the customer which is
produced by the company (Bobrov and Medyankina, 2018).
(c) Graph development in spreadsheet for DC Ltd five-year projection
Variable
cost per
unit
0.74
(0.70 * 105%)
0.77
(0.74 * 105%)
0.81
(0.77 * 105%)
0.85
(0.81 * 105%)
0.89
(0.85 * 105%)
Selling
price per
unit
3.61
(3.50 * 103%)
3.71
(3.61*103%)
3.82
(3.71 * 103%)
3.94
(3.82 * 103%)
4.06
(3.94 * 103%)
No. of
units
sold.
770000
(700000 *
110%)
847000
(770000 *
110%)
931700
(847000 *
110%)
1024870
(931700 *
110%)
1127357
(1024870 *
110%)
Particulars Jan-23 Jan-24 Jan-25 Jan-26 Jan-27
Sales
Revenue
2775850
(770000 *
3.61)
3145038
(847000 *
3.71)
3563328
(931700 * 3.82)
4037251
(1024870 *
3.94)
4574205
(1127357 *
4.06)
Less
Variable
cost
565950
(770000 *
0.74)
653672
(847000 *
0.77)
754991
(931700 * 0.81)
872015
(1024870 *
0.85)
1007177
(1127357 *
0.89)
Contribution 2209900 2491366 2808337 3165236 3567028
Less Fixed
cost 110000 110000 110000 110000 110000
Net Profit 2099900 2381366 2698337 3055236 3457028
Business Analytics: Mathematical Model, Costing and Revenue Behaviour, Advertising Impact on Sales, and Break-Even Analysis for Basu Plc_4

End of preview

Want to access all the pages? Upload your documents or become a member.

Related Documents
Business Analytics: Mathematical Models, Correlation Coefficient, and Marketing Tactics
|15
|3820
|190

Business Analytics: Mathematical Model, Cost and Revenue Behaviour, Correlation Coefficient and Advertising Impact on Sales
|16
|4340
|386

Business Analytics: Mathematical Model, Costing and Revenue Behaviour, Correlation Coefficient, and Marketing Tactics
|17
|4430
|399