Business Analytics Report: DC Ltd Costing, Revenue Behavior Analysis
VerifiedAdded on 2023/06/11
|17
|4430
|399
Report
AI Summary
This report provides a comprehensive analysis of business analytics concepts, including costing, revenue behavior, and break-even analysis. It begins by developing a mathematical model using cost information from Joycelyn’s influence diagram for DC Ltd, calculating profit/loss, and projecting five-year financials. The report then analyzes the correlation between advertising expenditure and sales for Nice Wear Ltd, recommending relevant marketing tactics. Finally, it calculates the break-even point for Basu Plc, prepares a break-even chart, and critically evaluates the benefits and limitations of the break-even model. The analysis incorporates financial data, statistical methods, and strategic recommendations to enhance business decision-making and competitive performance. Desklib offers similar solved assignments and past papers to aid students in their studies.
BUSINESS ANALYTICS
Paraphrase This Document
Need a fresh take? Get an instant paraphrase of this document with our AI Paraphraser
Table of Contents
INTRODUCTION...........................................................................................................................3
QUESTION 1..................................................................................................................................3
(a) Creation of Mathematical model using the given cost information.......................................3
(b) Calculation of profit or loss of DC Ltd. using the given information....................................3
(c) Developing graph of five-year projection from January 2023...............................................4
(d) Critical analysis and comment on costing and revenue behaviour in both general as well as
DC Ltd context............................................................................................................................5
QUESTION 2..................................................................................................................................7
(a) Calculation of correlation coefficient between advertising and sales of Nice Wear Ltd.......7
(b) Scattered diagram of the data and comment on the relationship between two variables.......8
(c) Critical analysis of impact of advertising expenditure on sales and recommendation of
relevant marketing tactics............................................................................................................8
QUESTION 3................................................................................................................................10
(a) Calculation of Break-even point and margin of safety percentage of 640 computer software
sales............................................................................................................................................10
(b) Calculation of sales volume that Basu Plc need to sale to achieve target profit for the year
of £56000...................................................................................................................................11
(c) Preparation of Break-even chart for Basu Plc properly showing Break-even point and
margin of safety.........................................................................................................................12
(d) Critical analysis of benefits and limitations of the break-even model.................................13
CONCLUSION..............................................................................................................................14
REFERENCES................................................................................................................................1
INTRODUCTION
Business analytics is basically a set of disciplines and also technologies with the help of
which the companies can analyse their data for solving the business problem and making
appropriate decision-making (Cazenave and et.al., 2018). The present report will firstly develop
the mathematic model using the cost information provided by the Joycelyn’s influence diagram.
Further, the report will compute the profit and loss of DC Ltd using the same information and
prepare the five-year projection. The report will also discuss the costing and revenue behaviour
in general as well as DC Ltd context. Further, the report will compute the correlation coefficient
between advertising expenditure and sales revenue for Nice Wear Ltd. In addition, the report will
analyse the impact of advertising expenditure on sales and describe the relevant marketing tactic
that marketing manager of Nice Wear company can adopt in order to enhance the competitive
performance in designer clothing industry. Lastly, the report will compute the break-even point
of Basu Plc, create the chart and critically analyse the benefits and limitation of break-even
model.
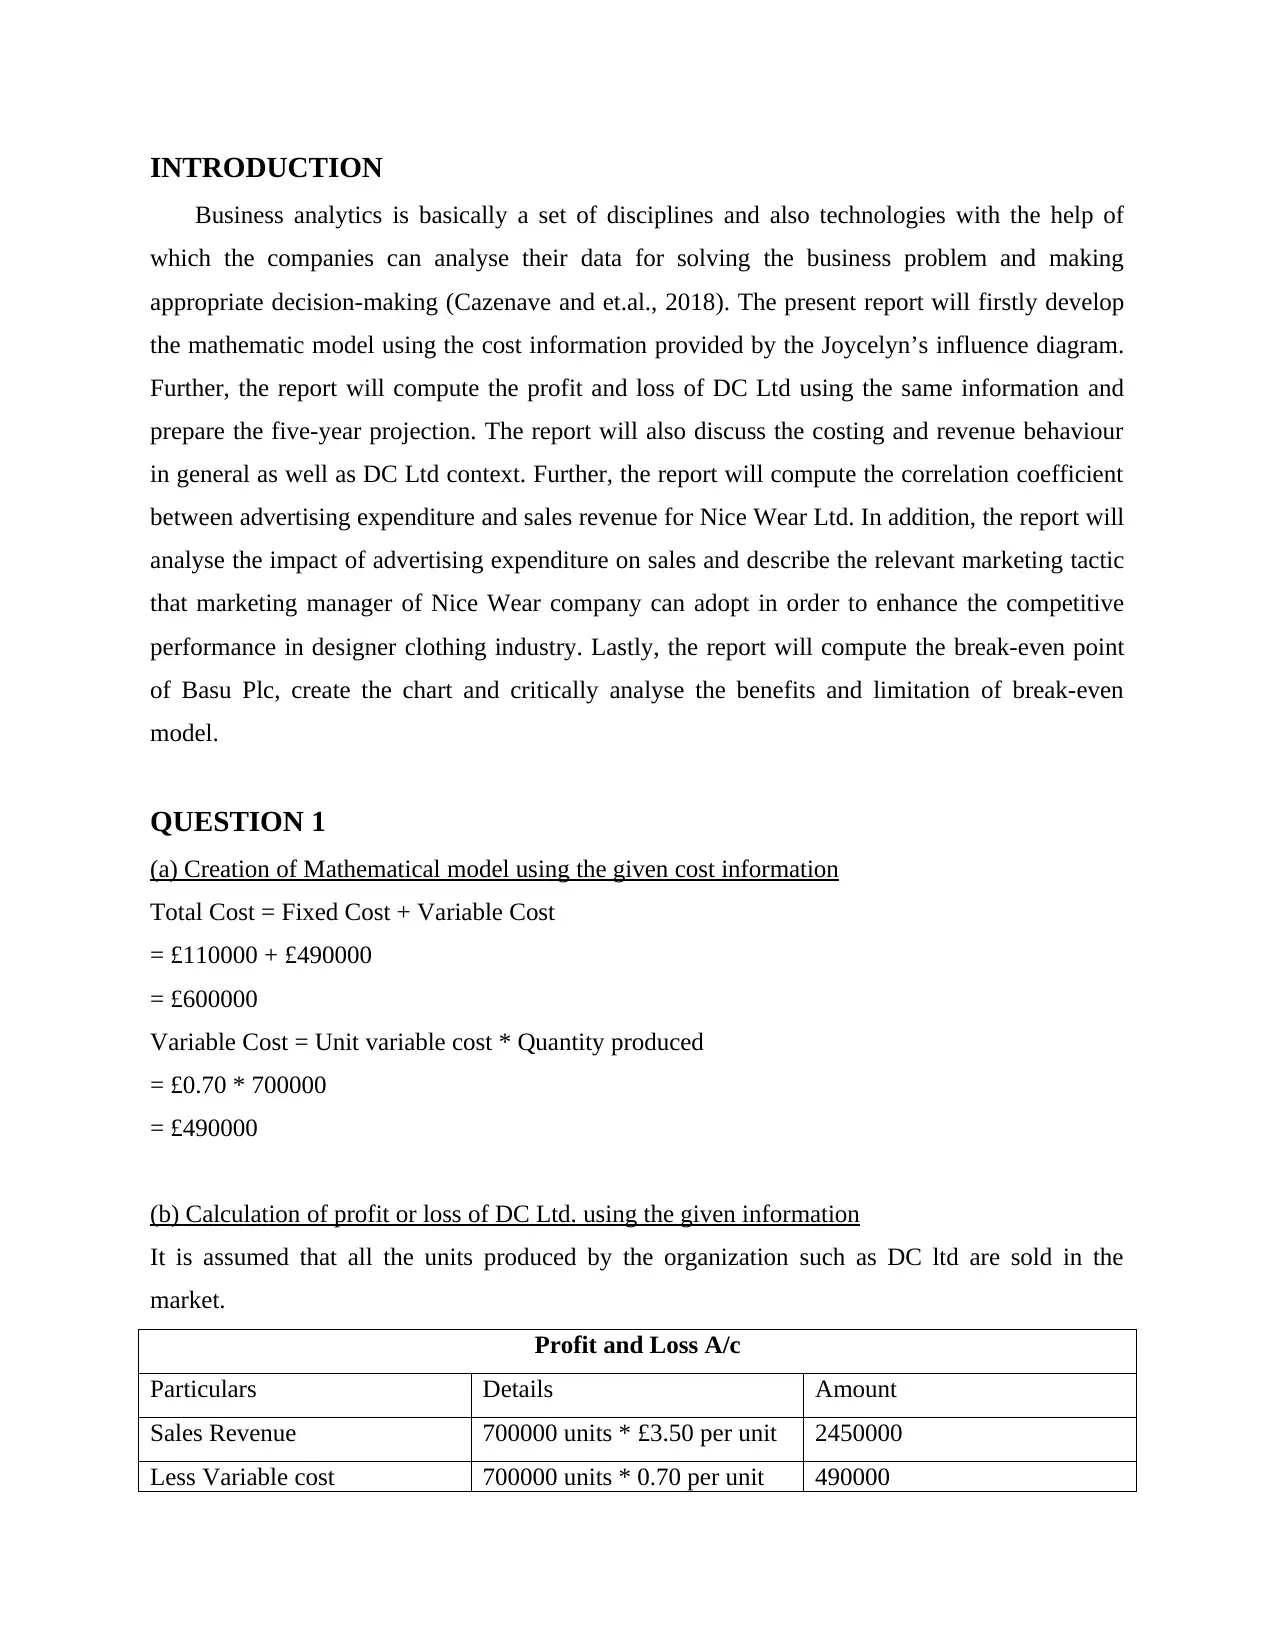
QUESTION 1
(a) Creation of Mathematical model using the given cost information
Total Cost = Fixed Cost + Variable Cost
= £110000 + £490000
= £600000
Variable Cost = Unit variable cost * Quantity produced
= £0.70 * 700000
= £490000
(b) Calculation of profit or loss of DC Ltd. using the given information
It is assumed that all the units produced by the organization such as DC ltd are sold in the
market.
Profit and Loss A/c
Particulars Details Amount
Sales Revenue 700000 units * £3.50 per unit 2450000
Less Variable cost 700000 units * 0.70 per unit 490000
Business analytics is basically a set of disciplines and also technologies with the help of
which the companies can analyse their data for solving the business problem and making
appropriate decision-making (Cazenave and et.al., 2018). The present report will firstly develop
the mathematic model using the cost information provided by the Joycelyn’s influence diagram.
Further, the report will compute the profit and loss of DC Ltd using the same information and
prepare the five-year projection. The report will also discuss the costing and revenue behaviour
in general as well as DC Ltd context. Further, the report will compute the correlation coefficient
between advertising expenditure and sales revenue for Nice Wear Ltd. In addition, the report will
analyse the impact of advertising expenditure on sales and describe the relevant marketing tactic
that marketing manager of Nice Wear company can adopt in order to enhance the competitive
performance in designer clothing industry. Lastly, the report will compute the break-even point
of Basu Plc, create the chart and critically analyse the benefits and limitation of break-even
model.
QUESTION 1
(a) Creation of Mathematical model using the given cost information
Total Cost = Fixed Cost + Variable Cost
= £110000 + £490000
= £600000
Variable Cost = Unit variable cost * Quantity produced
= £0.70 * 700000
= £490000
(b) Calculation of profit or loss of DC Ltd. using the given information
It is assumed that all the units produced by the organization such as DC ltd are sold in the
market.
Profit and Loss A/c
Particulars Details Amount
Sales Revenue 700000 units * £3.50 per unit 2450000
Less Variable cost 700000 units * 0.70 per unit 490000
⊘ This is a preview!⊘
Do you want full access?
Subscribe today to unlock all pages.
Trusted by 1+ million students worldwide
Contribution 1960000
Less Fixed cost 110000
Net Profit 1850000
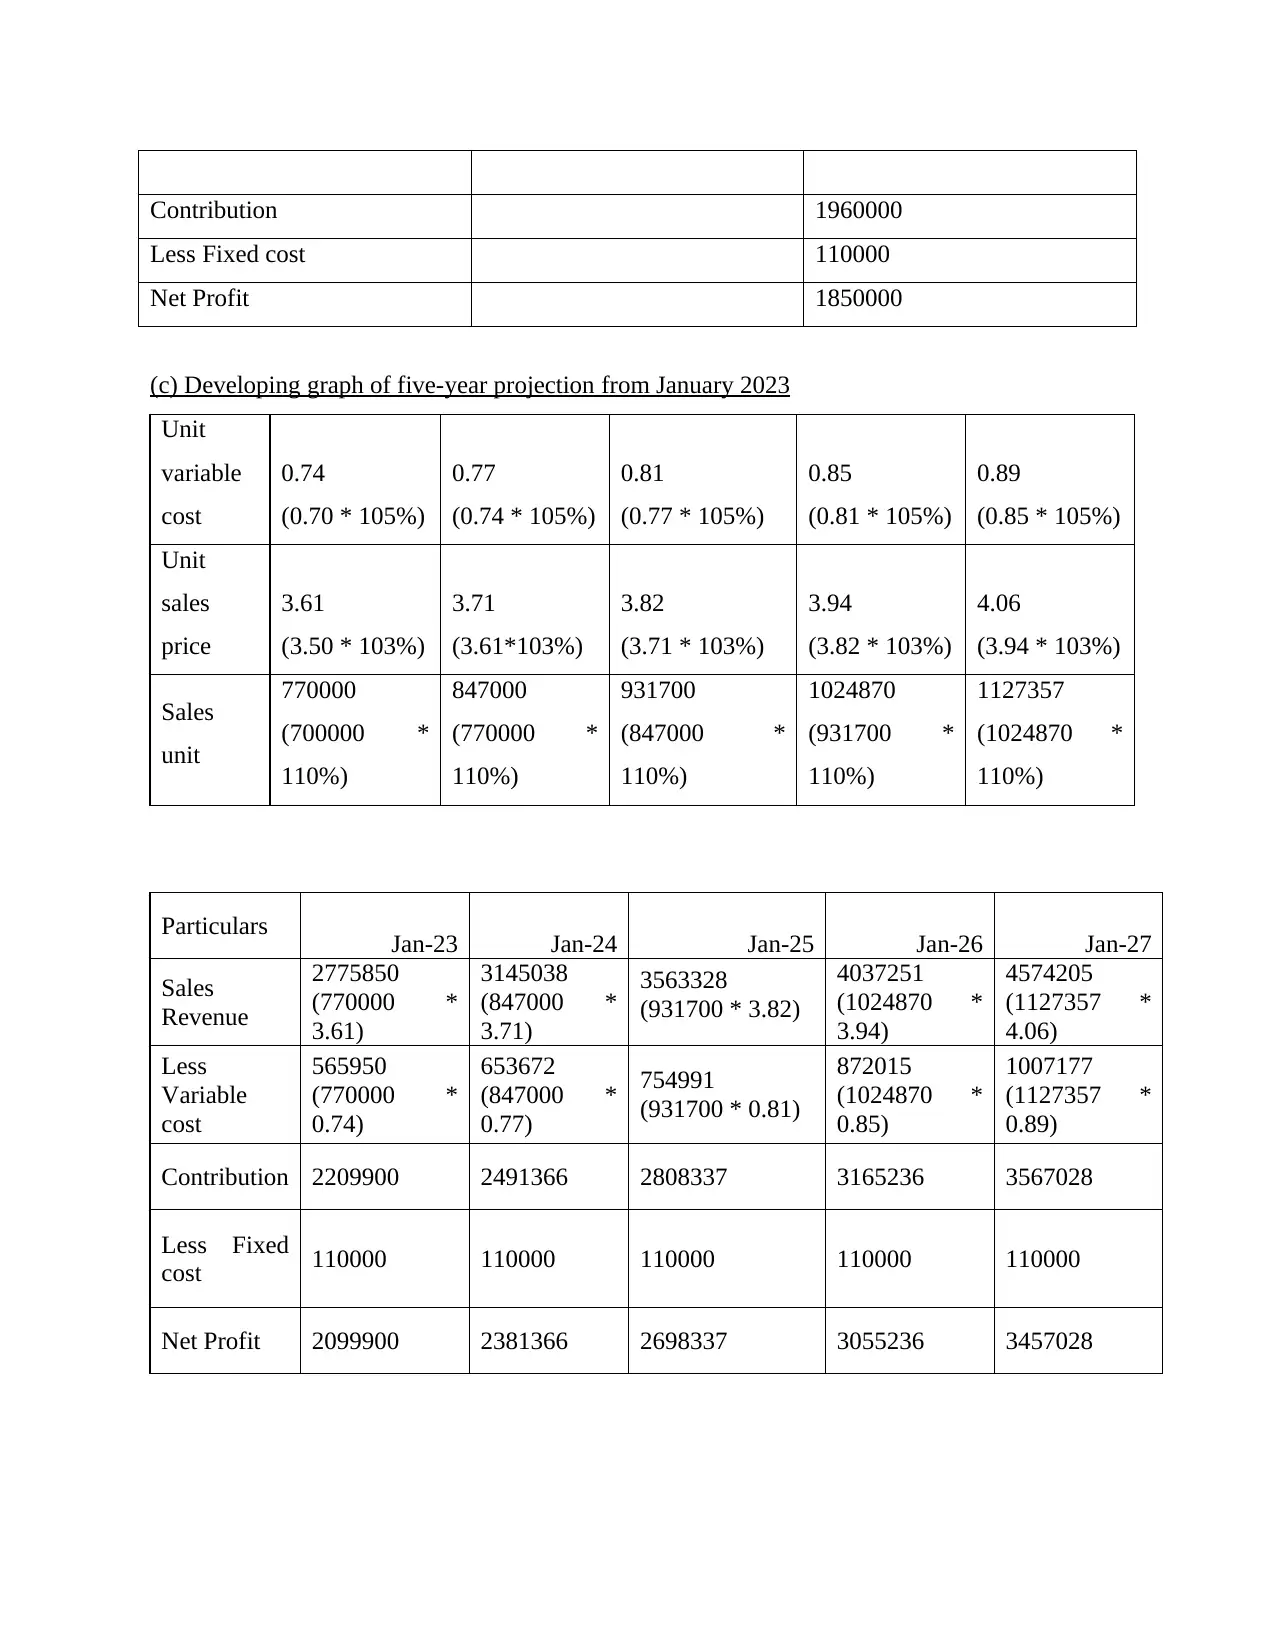
(c) Developing graph of five-year projection from January 2023
Unit
variable
cost
0.74
(0.70 * 105%)
0.77
(0.74 * 105%)
0.81
(0.77 * 105%)
0.85
(0.81 * 105%)
0.89
(0.85 * 105%)
Unit
sales
price
3.61
(3.50 * 103%)
3.71
(3.61*103%)
3.82
(3.71 * 103%)
3.94
(3.82 * 103%)
4.06
(3.94 * 103%)
Sales
unit
770000
(700000 *
110%)
847000
(770000 *
110%)
931700
(847000 *
110%)
1024870
(931700 *
110%)
1127357
(1024870 *
110%)
Particulars Jan-23 Jan-24 Jan-25 Jan-26 Jan-27
Sales
Revenue
2775850
(770000 *
3.61)
3145038
(847000 *
3.71)
3563328
(931700 * 3.82)
4037251
(1024870 *
3.94)
4574205
(1127357 *
4.06)
Less
Variable
cost
565950
(770000 *
0.74)
653672
(847000 *
0.77)
754991
(931700 * 0.81)
872015
(1024870 *
0.85)
1007177
(1127357 *
0.89)
Contribution 2209900 2491366 2808337 3165236 3567028
Less Fixed
cost 110000 110000 110000 110000 110000
Net Profit 2099900 2381366 2698337 3055236 3457028
Less Fixed cost 110000
Net Profit 1850000
(c) Developing graph of five-year projection from January 2023
Unit
variable
cost
0.74
(0.70 * 105%)
0.77
(0.74 * 105%)
0.81
(0.77 * 105%)
0.85
(0.81 * 105%)
0.89
(0.85 * 105%)
Unit
sales
price
3.61
(3.50 * 103%)
3.71
(3.61*103%)
3.82
(3.71 * 103%)
3.94
(3.82 * 103%)
4.06
(3.94 * 103%)
Sales
unit
770000
(700000 *
110%)
847000
(770000 *
110%)
931700
(847000 *
110%)
1024870
(931700 *
110%)
1127357
(1024870 *
110%)
Particulars Jan-23 Jan-24 Jan-25 Jan-26 Jan-27
Sales
Revenue
2775850
(770000 *
3.61)
3145038
(847000 *
3.71)
3563328
(931700 * 3.82)
4037251
(1024870 *
3.94)
4574205
(1127357 *
4.06)
Less
Variable
cost
565950
(770000 *
0.74)
653672
(847000 *
0.77)
754991
(931700 * 0.81)
872015
(1024870 *
0.85)
1007177
(1127357 *
0.89)
Contribution 2209900 2491366 2808337 3165236 3567028
Less Fixed
cost 110000 110000 110000 110000 110000
Net Profit 2099900 2381366 2698337 3055236 3457028
Paraphrase This Document
Need a fresh take? Get an instant paraphrase of this document with our AI Paraphraser
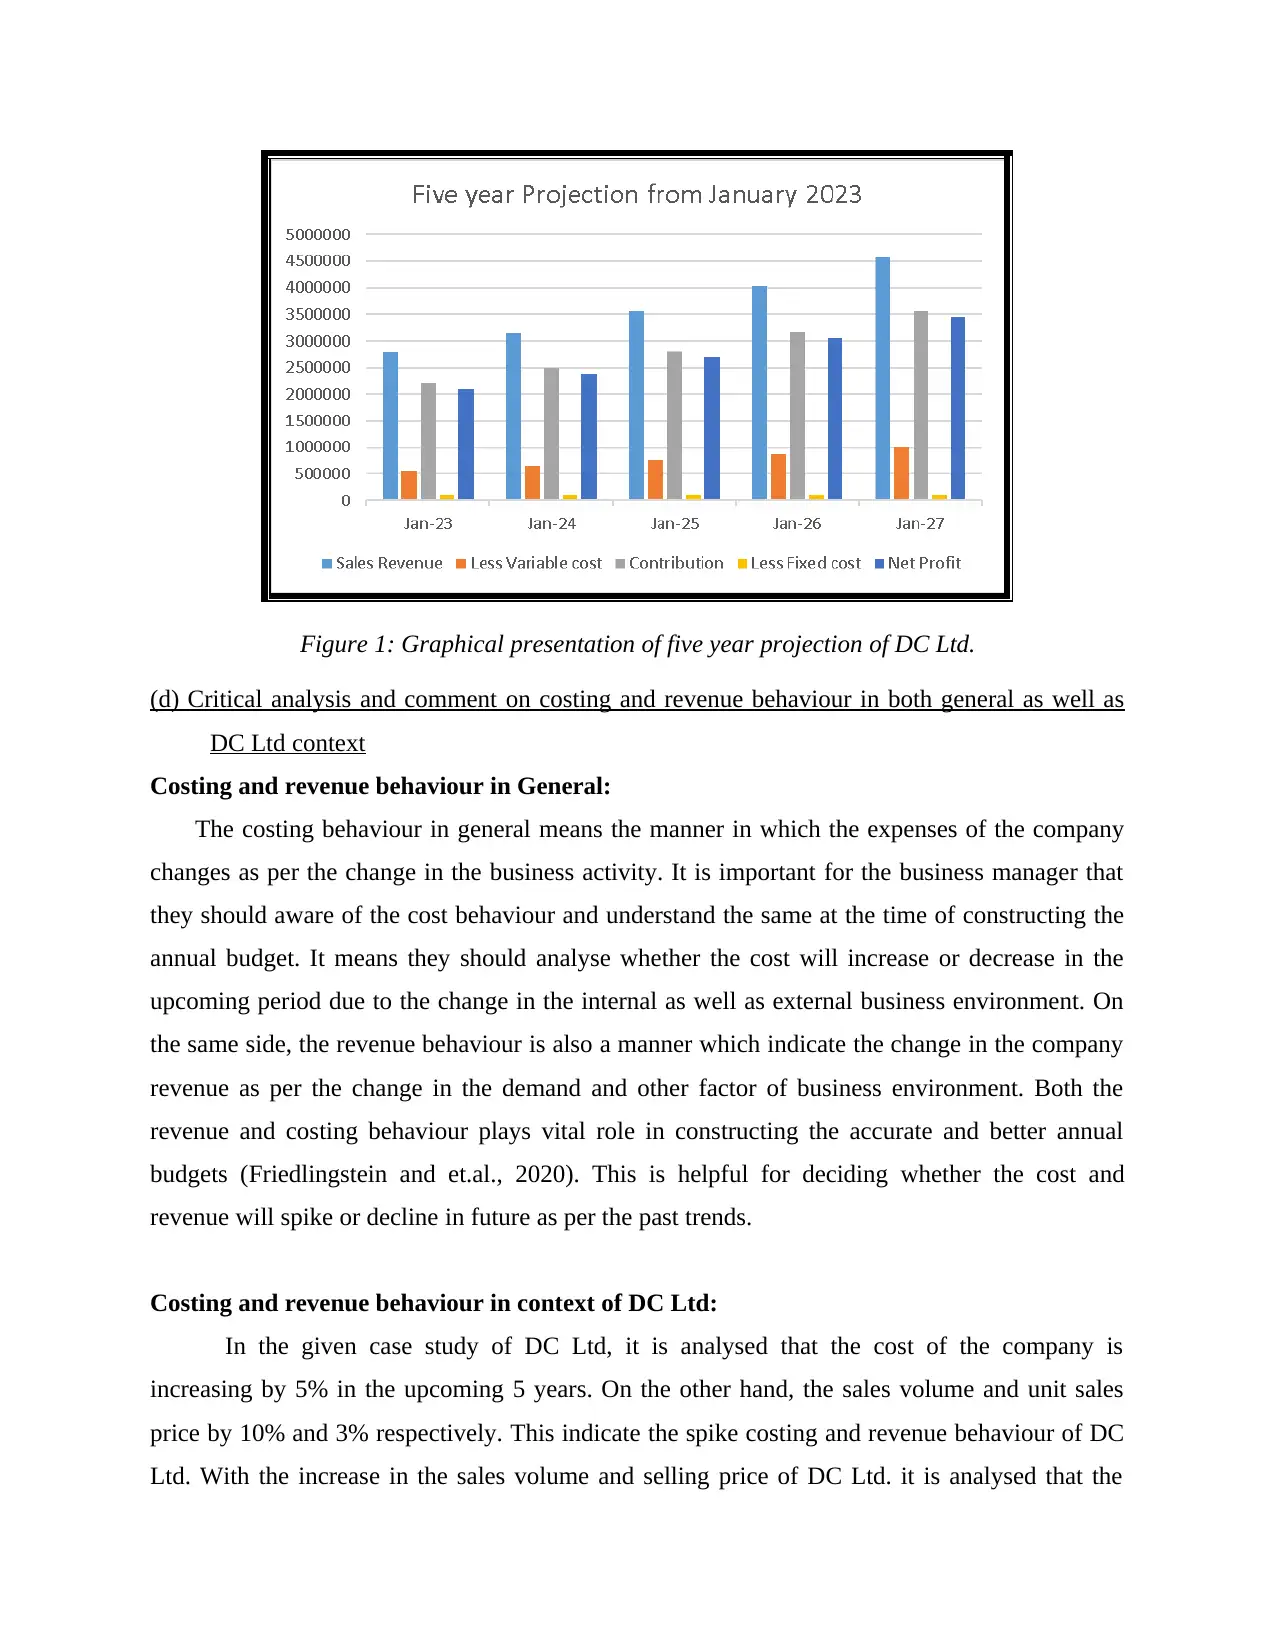
Figure 1: Graphical presentation of five year projection of DC Ltd.
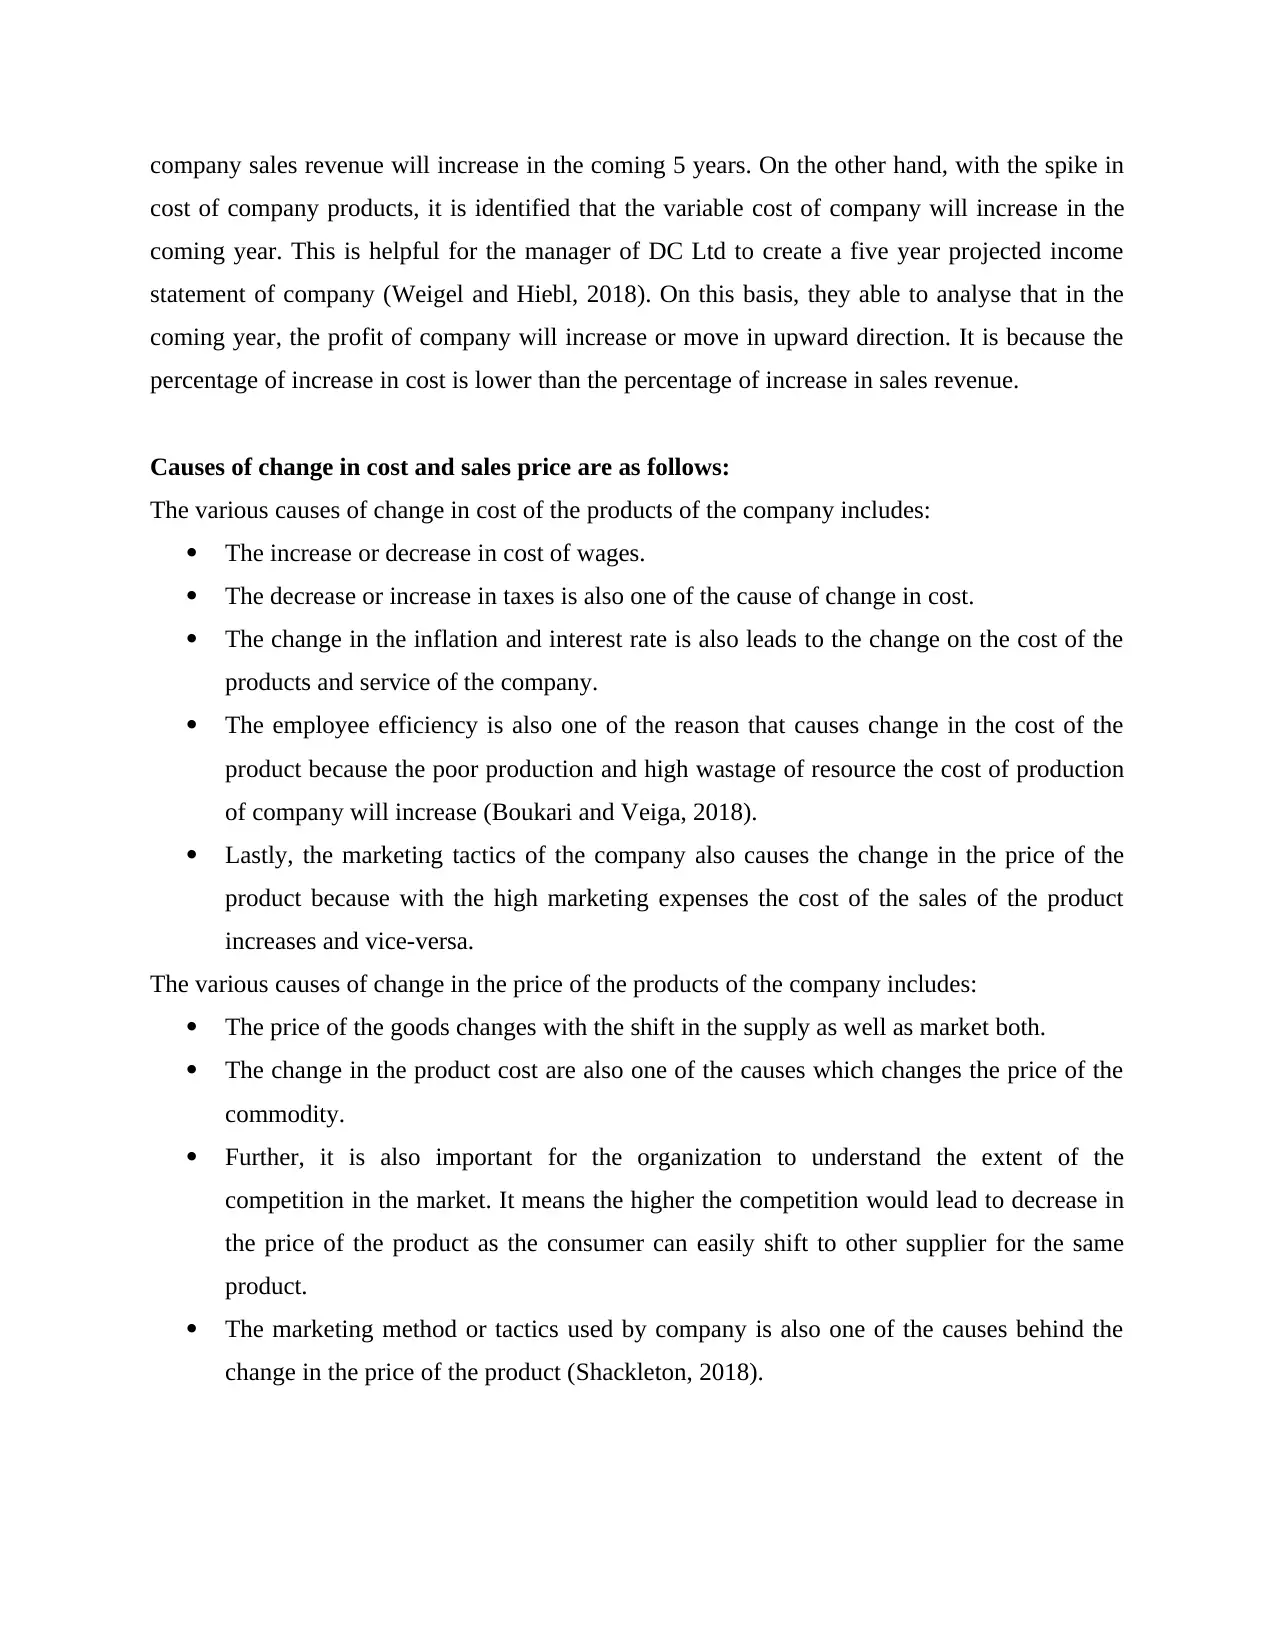
(d) Critical analysis and comment on costing and revenue behaviour in both general as well as
DC Ltd context
Costing and revenue behaviour in General:
The costing behaviour in general means the manner in which the expenses of the company
changes as per the change in the business activity. It is important for the business manager that
they should aware of the cost behaviour and understand the same at the time of constructing the
annual budget. It means they should analyse whether the cost will increase or decrease in the
upcoming period due to the change in the internal as well as external business environment. On
the same side, the revenue behaviour is also a manner which indicate the change in the company
revenue as per the change in the demand and other factor of business environment. Both the
revenue and costing behaviour plays vital role in constructing the accurate and better annual
budgets (Friedlingstein and et.al., 2020). This is helpful for deciding whether the cost and
revenue will spike or decline in future as per the past trends.
Costing and revenue behaviour in context of DC Ltd:
In the given case study of DC Ltd, it is analysed that the cost of the company is
increasing by 5% in the upcoming 5 years. On the other hand, the sales volume and unit sales
price by 10% and 3% respectively. This indicate the spike costing and revenue behaviour of DC
Ltd. With the increase in the sales volume and selling price of DC Ltd. it is analysed that the
company sales revenue will increase in the coming 5 years. On the other hand, with the spike in
cost of company products, it is identified that the variable cost of company will increase in the
coming year. This is helpful for the manager of DC Ltd to create a five year projected income
statement of company (Weigel and Hiebl, 2018). On this basis, they able to analyse that in the
coming year, the profit of company will increase or move in upward direction. It is because the
percentage of increase in cost is lower than the percentage of increase in sales revenue.
Causes of change in cost and sales price are as follows:
The various causes of change in cost of the products of the company includes:
The increase or decrease in cost of wages.
The decrease or increase in taxes is also one of the cause of change in cost.
The change in the inflation and interest rate is also leads to the change on the cost of the
products and service of the company.
The employee efficiency is also one of the reason that causes change in the cost of the
product because the poor production and high wastage of resource the cost of production
of company will increase (Boukari and Veiga, 2018).
Lastly, the marketing tactics of the company also causes the change in the price of the
product because with the high marketing expenses the cost of the sales of the product
increases and vice-versa.
The various causes of change in the price of the products of the company includes:
The price of the goods changes with the shift in the supply as well as market both.
The change in the product cost are also one of the causes which changes the price of the
commodity.
Further, it is also important for the organization to understand the extent of the
competition in the market. It means the higher the competition would lead to decrease in
the price of the product as the consumer can easily shift to other supplier for the same
product.
The marketing method or tactics used by company is also one of the causes behind the
change in the price of the product (Shackleton, 2018).
⊘ This is a preview!⊘
Do you want full access?
Subscribe today to unlock all pages.
Trusted by 1+ million students worldwide
Lastly, the customer base of the company is also one of the causes of change in the price
of the product. It means with the high customer base, the company can able to enhance
their product price and vice-versa.
QUESTION 2
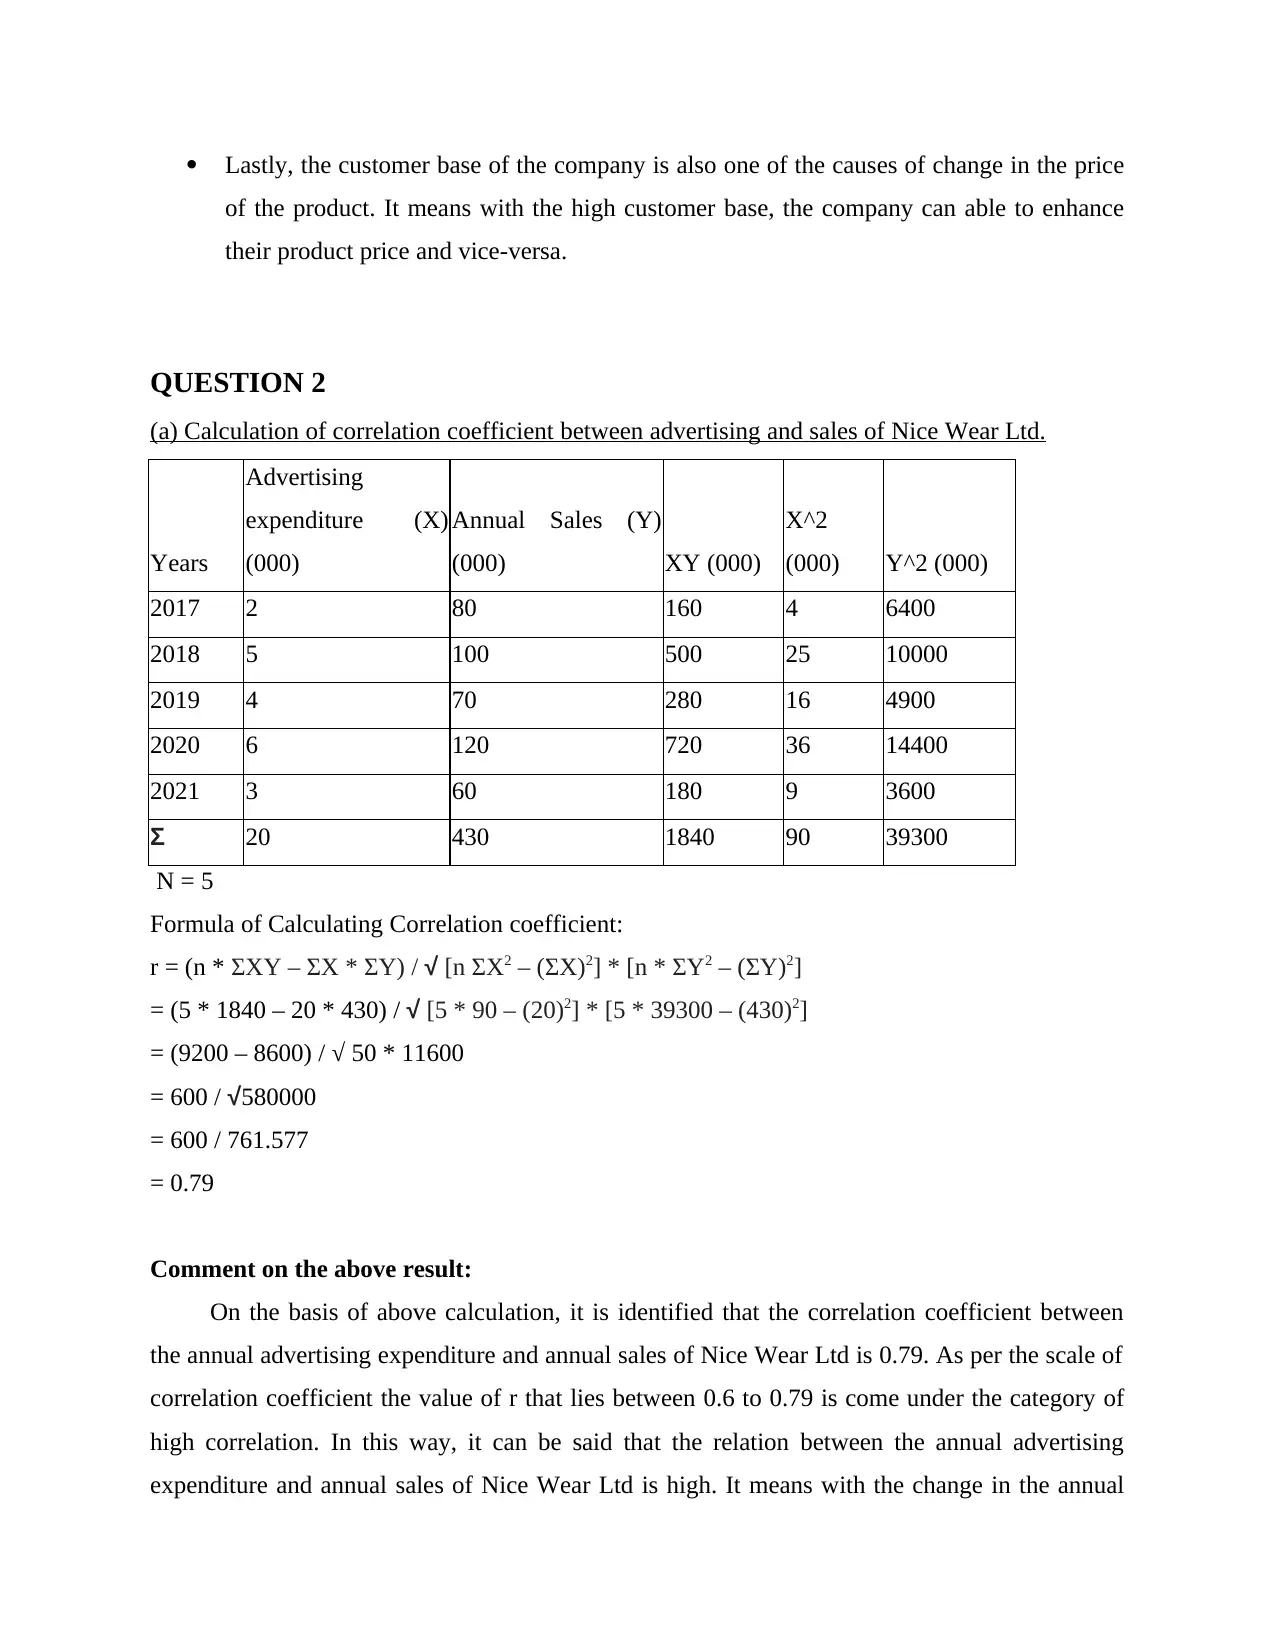
(a) Calculation of correlation coefficient between advertising and sales of Nice Wear Ltd.
Years
Advertising
expenditure (X)
(000)
Annual Sales (Y)
(000) XY (000)
X^2
(000) Y^2 (000)
2017 2 80 160 4 6400
2018 5 100 500 25 10000
2019 4 70 280 16 4900
2020 6 120 720 36 14400
2021 3 60 180 9 3600
Σ 20 430 1840 90 39300
N = 5
Formula of Calculating Correlation coefficient:
r = (n * ΣXY – ΣX * ΣY) / √ [n ΣX2 – (ΣX)2] * [n * ΣY2 – (ΣY)2]
= (5 * 1840 – 20 * 430) / √ [5 * 90 – (20)2] * [5 * 39300 – (430)2]
= (9200 – 8600) / √ 50 * 11600
= 600 / √580000
= 600 / 761.577
= 0.79
Comment on the above result:
On the basis of above calculation, it is identified that the correlation coefficient between
the annual advertising expenditure and annual sales of Nice Wear Ltd is 0.79. As per the scale of
correlation coefficient the value of r that lies between 0.6 to 0.79 is come under the category of
high correlation. In this way, it can be said that the relation between the annual advertising
expenditure and annual sales of Nice Wear Ltd is high. It means with the change in the annual
of the product. It means with the high customer base, the company can able to enhance
their product price and vice-versa.
QUESTION 2
(a) Calculation of correlation coefficient between advertising and sales of Nice Wear Ltd.
Years
Advertising
expenditure (X)
(000)
Annual Sales (Y)
(000) XY (000)
X^2
(000) Y^2 (000)
2017 2 80 160 4 6400
2018 5 100 500 25 10000
2019 4 70 280 16 4900
2020 6 120 720 36 14400
2021 3 60 180 9 3600
Σ 20 430 1840 90 39300
N = 5
Formula of Calculating Correlation coefficient:
r = (n * ΣXY – ΣX * ΣY) / √ [n ΣX2 – (ΣX)2] * [n * ΣY2 – (ΣY)2]
= (5 * 1840 – 20 * 430) / √ [5 * 90 – (20)2] * [5 * 39300 – (430)2]
= (9200 – 8600) / √ 50 * 11600
= 600 / √580000
= 600 / 761.577
= 0.79
Comment on the above result:
On the basis of above calculation, it is identified that the correlation coefficient between
the annual advertising expenditure and annual sales of Nice Wear Ltd is 0.79. As per the scale of
correlation coefficient the value of r that lies between 0.6 to 0.79 is come under the category of
high correlation. In this way, it can be said that the relation between the annual advertising
expenditure and annual sales of Nice Wear Ltd is high. It means with the change in the annual
Paraphrase This Document
Need a fresh take? Get an instant paraphrase of this document with our AI Paraphraser
advertising expenditure of company, the annual sales of the company will also change. Thus, it is
advisable to the marketing manager of Nice Wear Ltd. that they should opt for various relevant
marketing tactics with the help of which the company can enhance its sales revenue (Yao and
Shepperd, 2020). The increased sales revenue will further lead to the increase in the profitability
of the company.
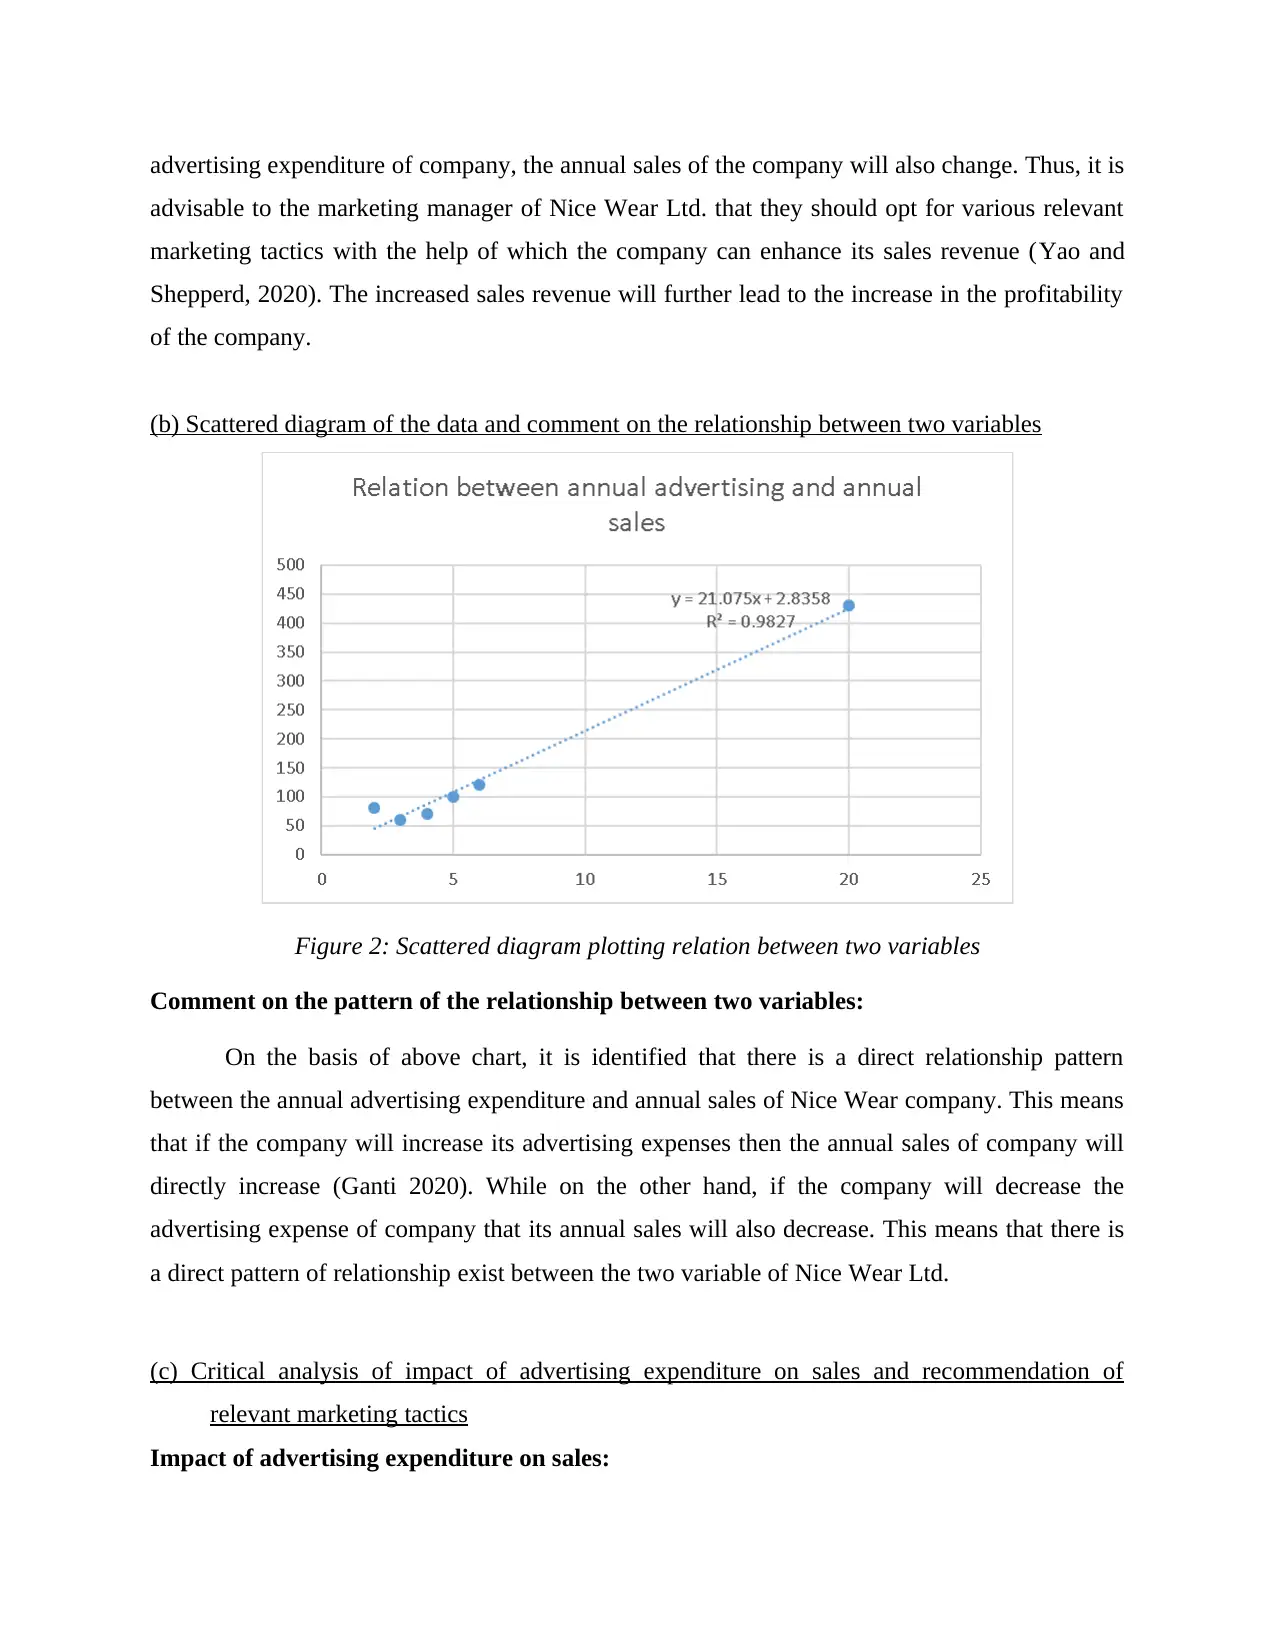
(b) Scattered diagram of the data and comment on the relationship between two variables
Figure 2: Scattered diagram plotting relation between two variables
Comment on the pattern of the relationship between two variables:
On the basis of above chart, it is identified that there is a direct relationship pattern
between the annual advertising expenditure and annual sales of Nice Wear company. This means
that if the company will increase its advertising expenses then the annual sales of company will
directly increase (Ganti 2020). While on the other hand, if the company will decrease the
advertising expense of company that its annual sales will also decrease. This means that there is
a direct pattern of relationship exist between the two variable of Nice Wear Ltd.
(c) Critical analysis of impact of advertising expenditure on sales and recommendation of
relevant marketing tactics
Impact of advertising expenditure on sales:
advisable to the marketing manager of Nice Wear Ltd. that they should opt for various relevant
marketing tactics with the help of which the company can enhance its sales revenue (Yao and
Shepperd, 2020). The increased sales revenue will further lead to the increase in the profitability
of the company.
(b) Scattered diagram of the data and comment on the relationship between two variables
Figure 2: Scattered diagram plotting relation between two variables
Comment on the pattern of the relationship between two variables:
On the basis of above chart, it is identified that there is a direct relationship pattern
between the annual advertising expenditure and annual sales of Nice Wear company. This means
that if the company will increase its advertising expenses then the annual sales of company will
directly increase (Ganti 2020). While on the other hand, if the company will decrease the
advertising expense of company that its annual sales will also decrease. This means that there is
a direct pattern of relationship exist between the two variable of Nice Wear Ltd.
(c) Critical analysis of impact of advertising expenditure on sales and recommendation of
relevant marketing tactics
Impact of advertising expenditure on sales:
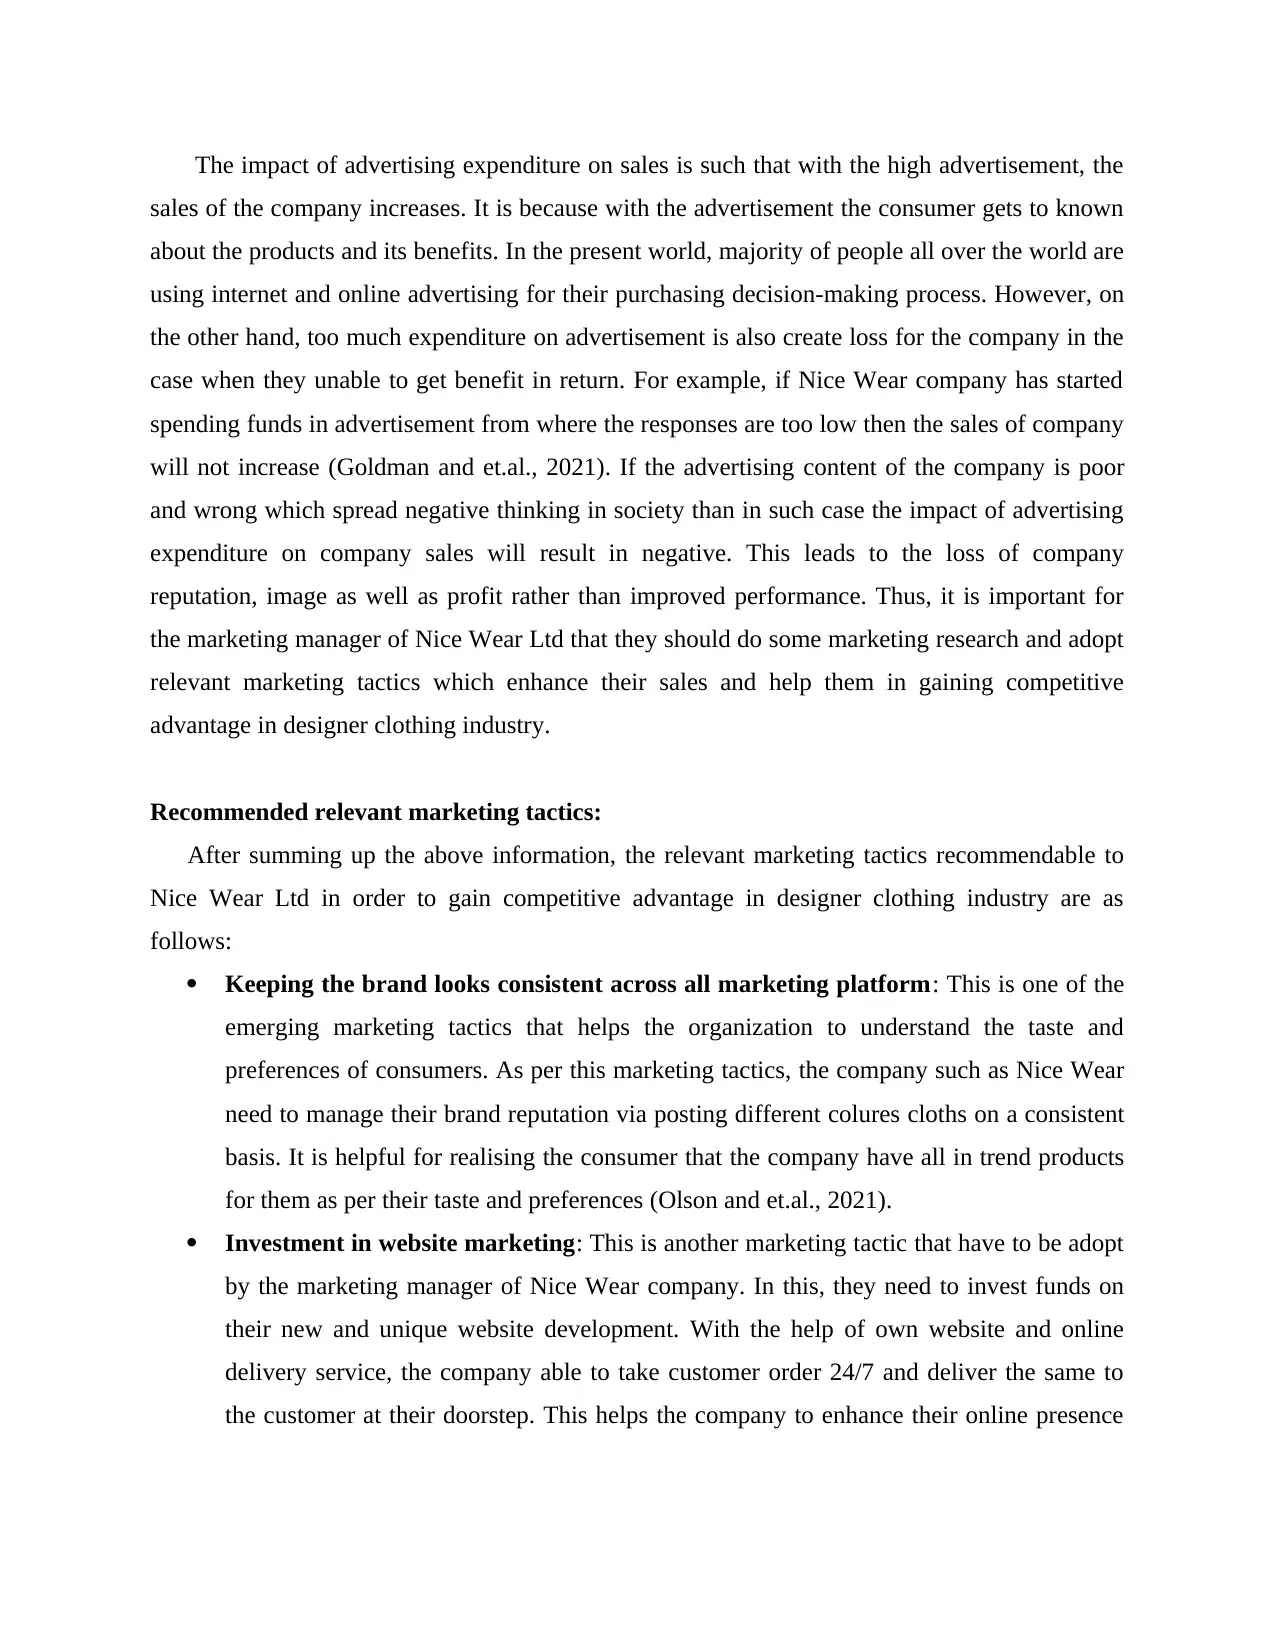
The impact of advertising expenditure on sales is such that with the high advertisement, the
sales of the company increases. It is because with the advertisement the consumer gets to known
about the products and its benefits. In the present world, majority of people all over the world are
using internet and online advertising for their purchasing decision-making process. However, on
the other hand, too much expenditure on advertisement is also create loss for the company in the
case when they unable to get benefit in return. For example, if Nice Wear company has started
spending funds in advertisement from where the responses are too low then the sales of company
will not increase (Goldman and et.al., 2021). If the advertising content of the company is poor
and wrong which spread negative thinking in society than in such case the impact of advertising
expenditure on company sales will result in negative. This leads to the loss of company
reputation, image as well as profit rather than improved performance. Thus, it is important for
the marketing manager of Nice Wear Ltd that they should do some marketing research and adopt
relevant marketing tactics which enhance their sales and help them in gaining competitive
advantage in designer clothing industry.
Recommended relevant marketing tactics:
After summing up the above information, the relevant marketing tactics recommendable to
Nice Wear Ltd in order to gain competitive advantage in designer clothing industry are as
follows:
Keeping the brand looks consistent across all marketing platform: This is one of the
emerging marketing tactics that helps the organization to understand the taste and
preferences of consumers. As per this marketing tactics, the company such as Nice Wear
need to manage their brand reputation via posting different colures cloths on a consistent
basis. It is helpful for realising the consumer that the company have all in trend products
for them as per their taste and preferences (Olson and et.al., 2021).
Investment in website marketing: This is another marketing tactic that have to be adopt
by the marketing manager of Nice Wear company. In this, they need to invest funds on
their new and unique website development. With the help of own website and online
delivery service, the company able to take customer order 24/7 and deliver the same to
the customer at their doorstep. This helps the company to enhance their online presence
⊘ This is a preview!⊘
Do you want full access?
Subscribe today to unlock all pages.
Trusted by 1+ million students worldwide
and gain competitive advantage with the help of which the company can further enhance
its sales volume as well as profitability.
Creating style guides: This is basically one of the most significant marketing tactics
which indicate that the company should create a style guide for their consumer on social
media platforms such as Instagram, Facebook, YouTube etc. and also on their own
website. This style guide helps the consumer to purchase the designer clothes on the basis
of style guide who have poor knowledge of styles (Putit and Abdullah, 2019). The
ultimate result of this marketing tactic is such that it helps the company to increase their
customer loyalty and brand image in the eye of stakeholders.
Run a consistent and quality blogs: Blogs is one of the emerging marketing tactic in the
present time which enhances the online presence of company and its marketing strategy.
With the help of this tactics the marketing team of Nice Wear company can share useful
information about their products and share the same among all social media users.
However, the company should ensure maintain and posting consistent blogs in order to
keep the customer engaged on a regular basis and gain competitive advantage.
QUESTION 3
(a) Calculation of Break-even point and margin of safety percentage of 640 computer software
sales
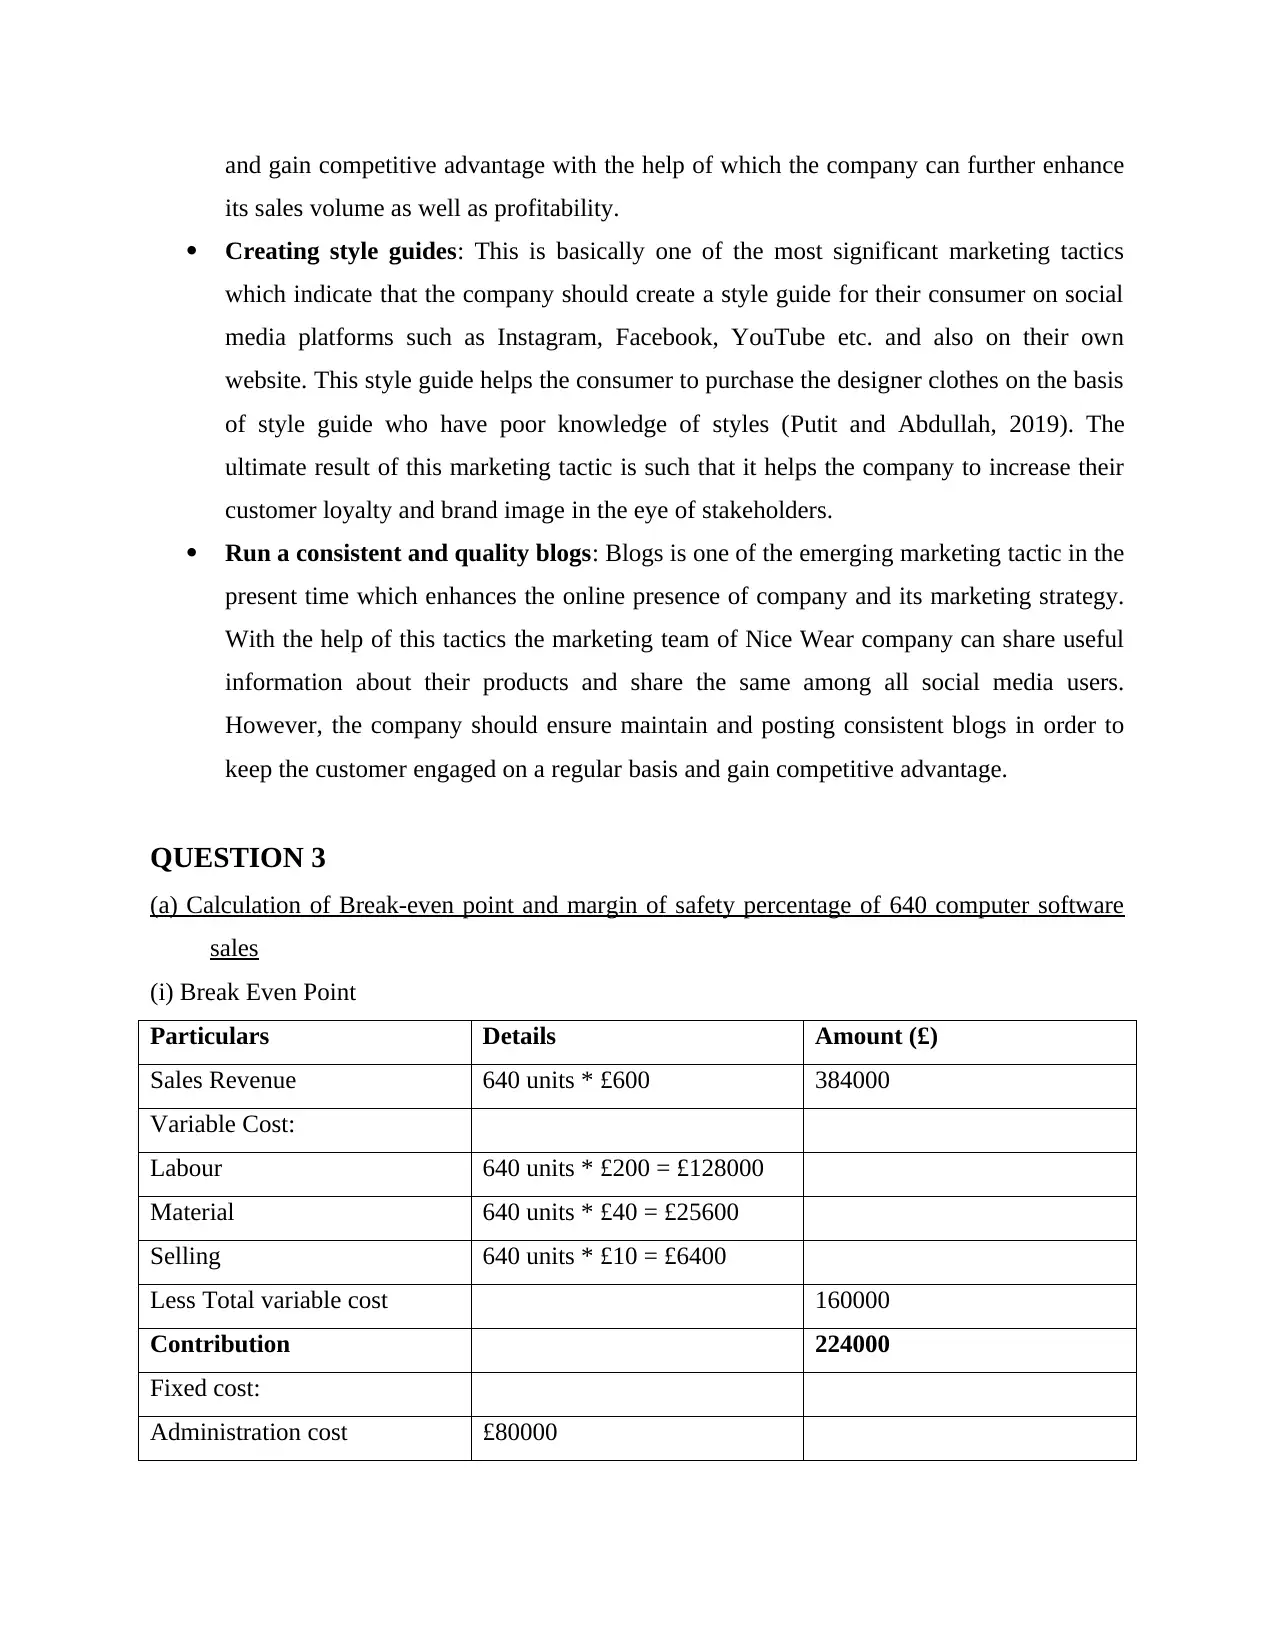
(i) Break Even Point
Particulars Details Amount (£)
Sales Revenue 640 units * £600 384000
Variable Cost:
Labour 640 units * £200 = £128000
Material 640 units * £40 = £25600
Selling 640 units * £10 = £6400
Less Total variable cost 160000
Contribution 224000
Fixed cost:
Administration cost £80000
its sales volume as well as profitability.
Creating style guides: This is basically one of the most significant marketing tactics
which indicate that the company should create a style guide for their consumer on social
media platforms such as Instagram, Facebook, YouTube etc. and also on their own
website. This style guide helps the consumer to purchase the designer clothes on the basis
of style guide who have poor knowledge of styles (Putit and Abdullah, 2019). The
ultimate result of this marketing tactic is such that it helps the company to increase their
customer loyalty and brand image in the eye of stakeholders.
Run a consistent and quality blogs: Blogs is one of the emerging marketing tactic in the
present time which enhances the online presence of company and its marketing strategy.
With the help of this tactics the marketing team of Nice Wear company can share useful
information about their products and share the same among all social media users.
However, the company should ensure maintain and posting consistent blogs in order to
keep the customer engaged on a regular basis and gain competitive advantage.
QUESTION 3
(a) Calculation of Break-even point and margin of safety percentage of 640 computer software
sales
(i) Break Even Point
Particulars Details Amount (£)
Sales Revenue 640 units * £600 384000
Variable Cost:
Labour 640 units * £200 = £128000
Material 640 units * £40 = £25600
Selling 640 units * £10 = £6400
Less Total variable cost 160000
Contribution 224000
Fixed cost:
Administration cost £80000
Paraphrase This Document
Need a fresh take? Get an instant paraphrase of this document with our AI Paraphraser
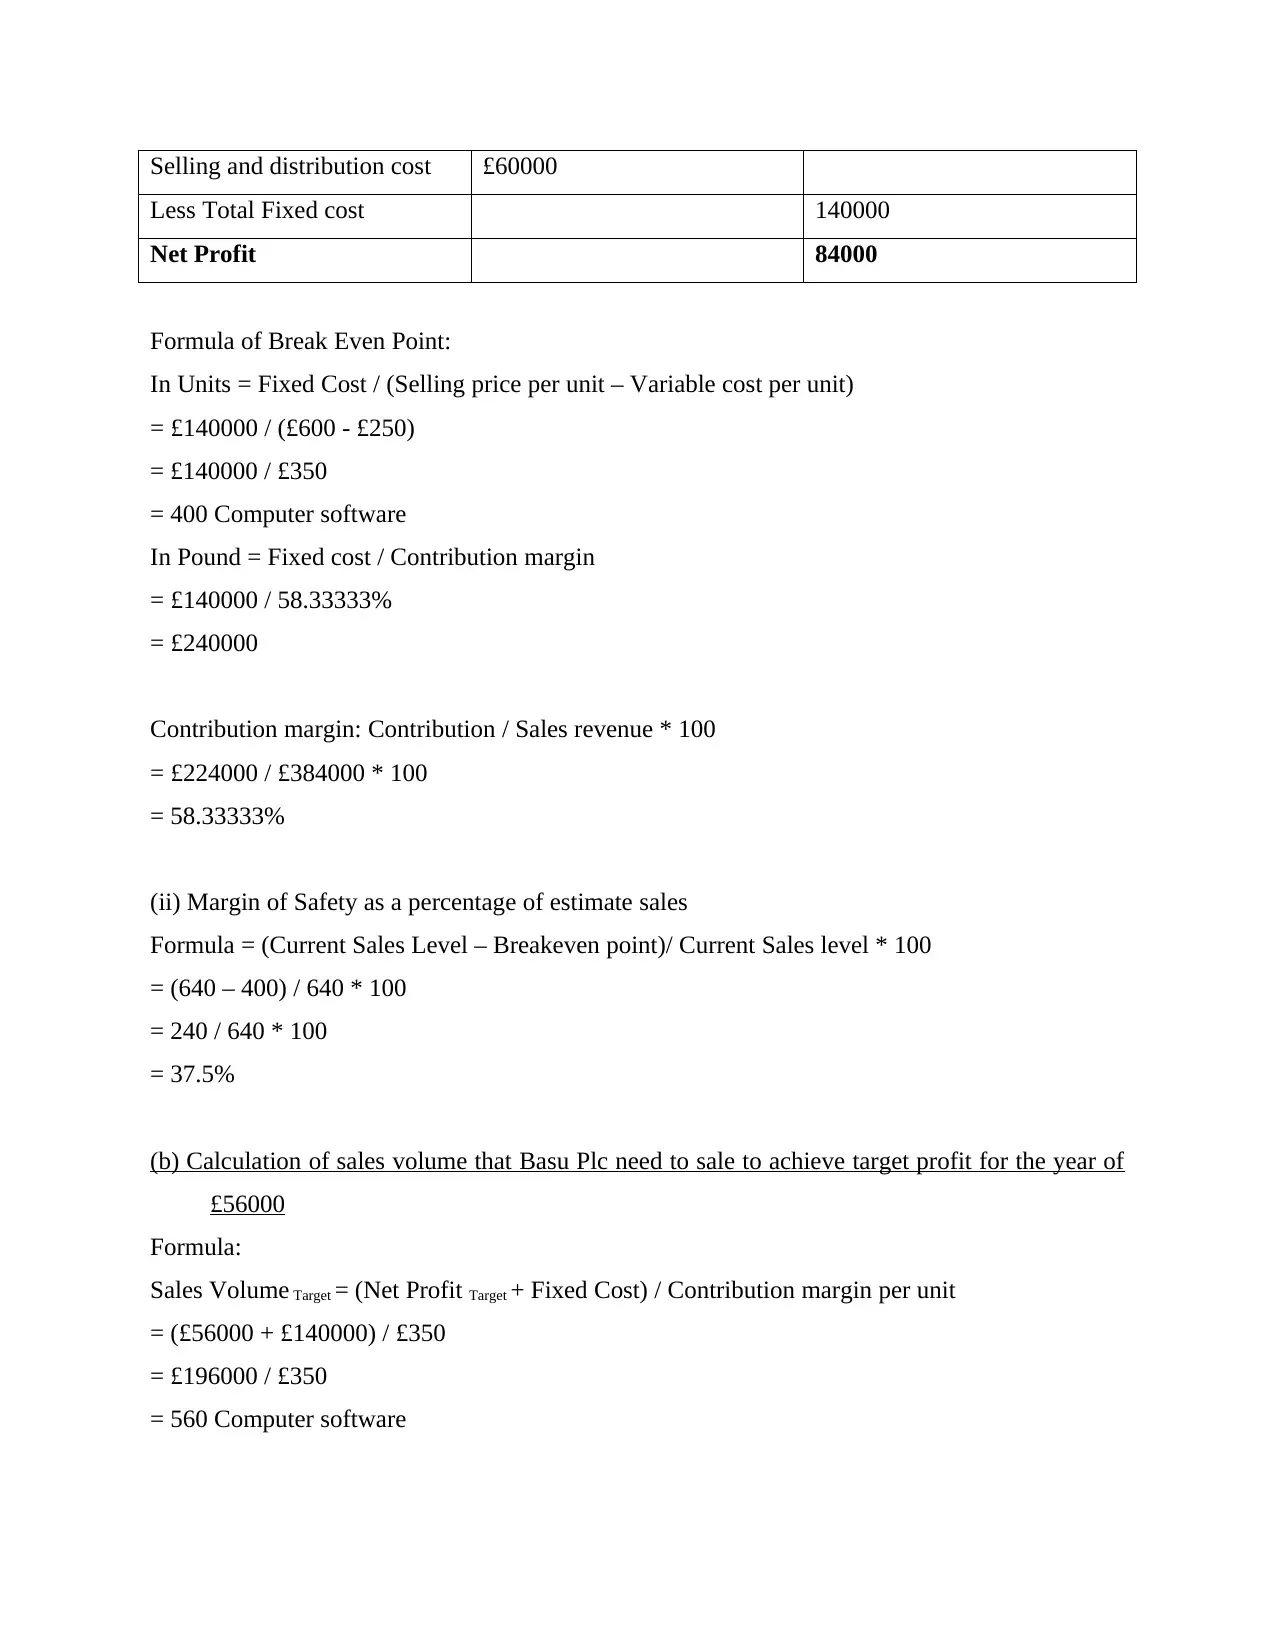
Selling and distribution cost £60000
Less Total Fixed cost 140000
Net Profit 84000
Formula of Break Even Point:
In Units = Fixed Cost / (Selling price per unit – Variable cost per unit)
= £140000 / (£600 - £250)
= £140000 / £350
= 400 Computer software
In Pound = Fixed cost / Contribution margin
= £140000 / 58.33333%
= £240000
Contribution margin: Contribution / Sales revenue * 100
= £224000 / £384000 * 100
= 58.33333%
(ii) Margin of Safety as a percentage of estimate sales
Formula = (Current Sales Level – Breakeven point)/ Current Sales level * 100
= (640 – 400) / 640 * 100
= 240 / 640 * 100
= 37.5%
(b) Calculation of sales volume that Basu Plc need to sale to achieve target profit for the year of
£56000
Formula:
Sales Volume Target = (Net Profit Target + Fixed Cost) / Contribution margin per unit
= (£56000 + £140000) / £350
= £196000 / £350
= 560 Computer software
Hence, from the above calculation, it is identified that Basu Plc need to sale 560
computer software in order to achieve its target profit of £56000. The estimated sales volume of
Basu Ltd computer software is 640 units and the number of computer software they need to sale
in order to achieve £56000 target profit is 560 units. This indicate that the estimated sales
volume of Basu Plc is sufficient to achieve the target profit of £56000. The profit on estimated
sales volume of 640 computer software is £84000 while on the other hand the profit on the target
sales volume of 560 computer software is £56000. On this basis, it can be said that by £28000
i.e., (£84000 - £56000) the profit from the estimated sales volume exceed of the target profit. It
means that the profit on estimated sales volume of computer software is higher than the target
profit by £28000 (Darusman, Fatahurrazak and Husna, 2020).
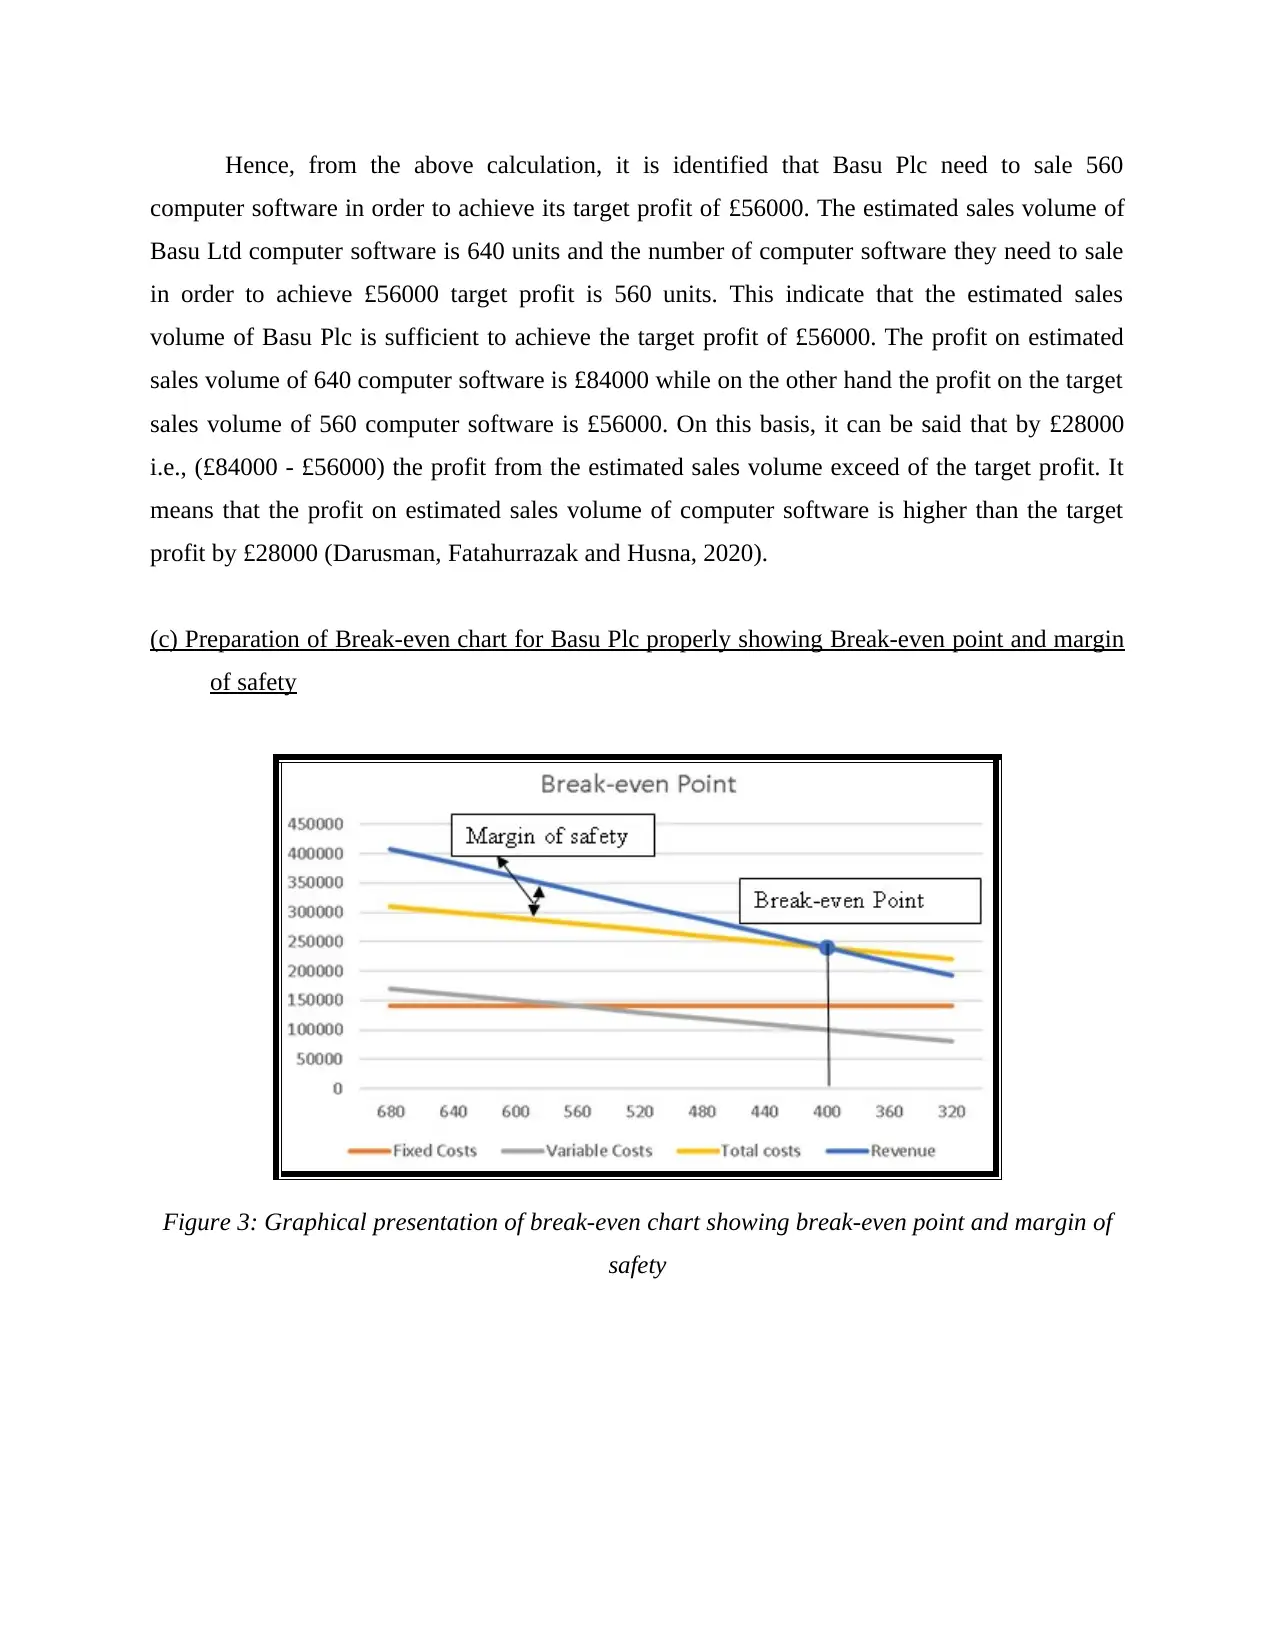
(c) Preparation of Break-even chart for Basu Plc properly showing Break-even point and margin
of safety
Figure 3: Graphical presentation of break-even chart showing break-even point and margin of
safety
computer software in order to achieve its target profit of £56000. The estimated sales volume of
Basu Ltd computer software is 640 units and the number of computer software they need to sale
in order to achieve £56000 target profit is 560 units. This indicate that the estimated sales
volume of Basu Plc is sufficient to achieve the target profit of £56000. The profit on estimated
sales volume of 640 computer software is £84000 while on the other hand the profit on the target
sales volume of 560 computer software is £56000. On this basis, it can be said that by £28000
i.e., (£84000 - £56000) the profit from the estimated sales volume exceed of the target profit. It
means that the profit on estimated sales volume of computer software is higher than the target
profit by £28000 (Darusman, Fatahurrazak and Husna, 2020).
(c) Preparation of Break-even chart for Basu Plc properly showing Break-even point and margin
of safety
Figure 3: Graphical presentation of break-even chart showing break-even point and margin of
safety
⊘ This is a preview!⊘
Do you want full access?
Subscribe today to unlock all pages.
Trusted by 1+ million students worldwide
1 out of 17
Related Documents


Your All-in-One AI-Powered Toolkit for Academic Success.
+13062052269
info@desklib.com
Available 24*7 on WhatsApp / Email
![[object Object]](/_next/static/media/star-bottom.7253800d.svg)
Unlock your academic potential
Copyright © 2020–2026 A2Z Services. All Rights Reserved. Developed and managed by ZUCOL.