Big Data and Analytics - Analysis on Solar Cities Project
VerifiedAdded on 2023/06/12
|16
|1549
|125
AI Summary
This article provides an analysis on the Solar Cities project using Big Data and Analytics. It includes reporting and dashboards, research, and recommendations for project managers and stakeholders.
Contribute Materials
Your contribution can guide someone’s learning journey. Share your
documents today.
Running head: BIG DATA AND ANALYTICS
Big Data and Analytics
Name of the Student
Name of the University
Authors note
Big Data and Analytics
Name of the Student
Name of the University
Authors note
Secure Best Marks with AI Grader
Need help grading? Try our AI Grader for instant feedback on your assignments.
1BIG DATA AND ANALYTICS
Table of Contents
Task 1...........................................................................................................................2
Background information.................................................................................2
Task 2 – Reporting / Dashboards.................................................................................2
Task 3 – Research......................................................................................................12
Task4 – Recommendations for the project manager and project stake holders........13
Reflection....................................................................................................................13
References.................................................................................................................14
2BIG DATA AND ANALYTICS
Task 1
Background information
In order to carry out the analysis on the solar cities project, the data set
defined under the Solar cities database, generated by Ballarat University, has been
considered. The provided database is comprised of various elements that have
direct or indirect impact on the process of consumption of energy by individual users
based on various factors. The mentioned factors are consisted of approximate user
age, the type of construction of wall, kinds of houses, the colour of the roof, bedroom
quantity, construction of wall and many more. Moreover, cfl_count, halogen_count,
pv_capacity, incandescent_count, fluor_count, led_count, insulation,
interval_date, power_usage is significant too for identifying the type of consumption
on energy alterations in the Grampians region and Loddon Mallee region.
Task 2 – Reporting / Dashboards
The IBM Watson data analytics allows uploading data sets and determining
results of below queries. These queries are represented through various graphs.
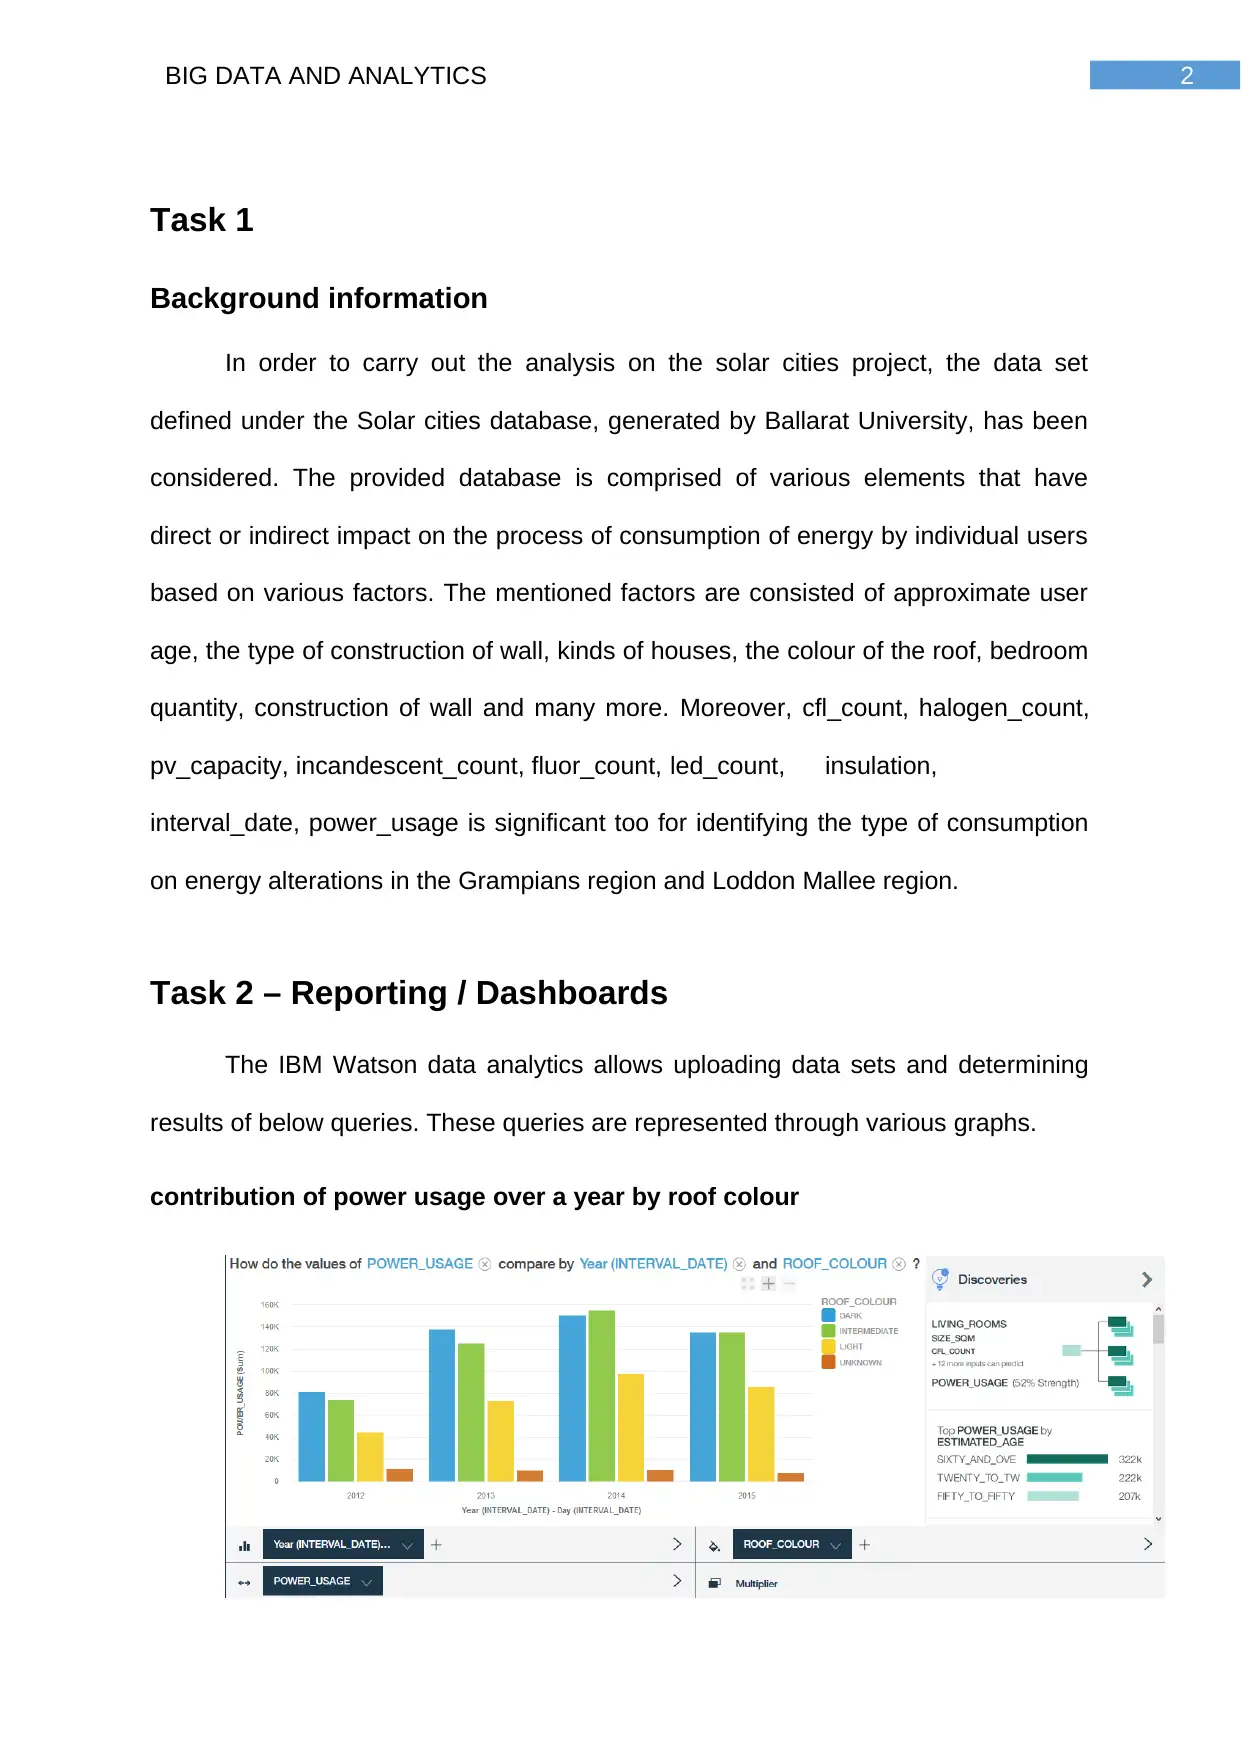
contribution of power usage over a year by roof colour
Task 1
Background information
In order to carry out the analysis on the solar cities project, the data set
defined under the Solar cities database, generated by Ballarat University, has been
considered. The provided database is comprised of various elements that have
direct or indirect impact on the process of consumption of energy by individual users
based on various factors. The mentioned factors are consisted of approximate user
age, the type of construction of wall, kinds of houses, the colour of the roof, bedroom
quantity, construction of wall and many more. Moreover, cfl_count, halogen_count,
pv_capacity, incandescent_count, fluor_count, led_count, insulation,
interval_date, power_usage is significant too for identifying the type of consumption
on energy alterations in the Grampians region and Loddon Mallee region.
Task 2 – Reporting / Dashboards
The IBM Watson data analytics allows uploading data sets and determining
results of below queries. These queries are represented through various graphs.
contribution of power usage over a year by roof colour
3BIG DATA AND ANALYTICS
The graph represents that the least power sonication occurred in the year
2012. The most consumption of power has occurred in 2014. In 2014 only, the power
consumption has crossed 140k. The analysis shows that the intermediate and dark
roof colours have great impact on consumption of energy.
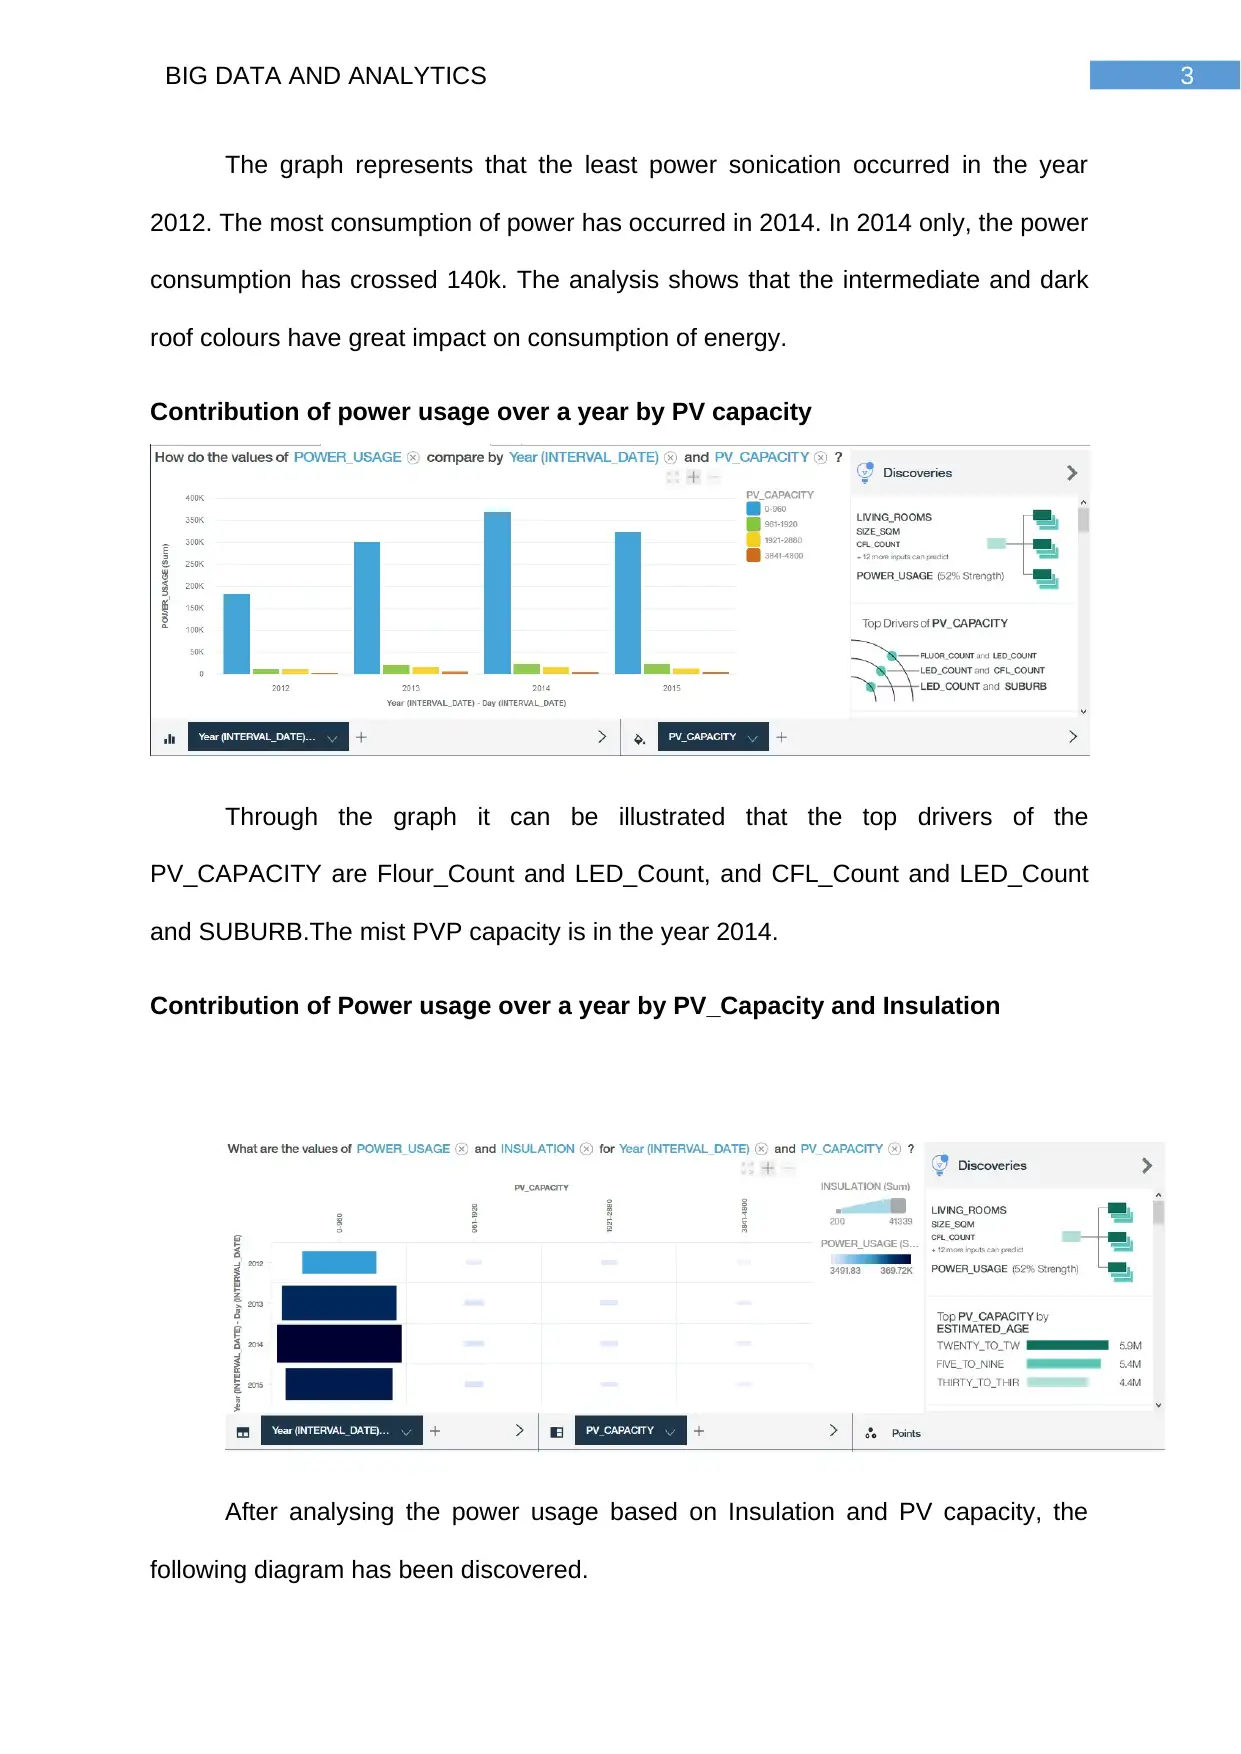
Contribution of power usage over a year by PV capacity
Through the graph it can be illustrated that the top drivers of the
PV_CAPACITY are Flour_Count and LED_Count, and CFL_Count and LED_Count
and SUBURB.The mist PVP capacity is in the year 2014.
Contribution of Power usage over a year by PV_Capacity and Insulation
After analysing the power usage based on Insulation and PV capacity, the
following diagram has been discovered.
The graph represents that the least power sonication occurred in the year
2012. The most consumption of power has occurred in 2014. In 2014 only, the power
consumption has crossed 140k. The analysis shows that the intermediate and dark
roof colours have great impact on consumption of energy.
Contribution of power usage over a year by PV capacity
Through the graph it can be illustrated that the top drivers of the
PV_CAPACITY are Flour_Count and LED_Count, and CFL_Count and LED_Count
and SUBURB.The mist PVP capacity is in the year 2014.
Contribution of Power usage over a year by PV_Capacity and Insulation
After analysing the power usage based on Insulation and PV capacity, the
following diagram has been discovered.
Secure Best Marks with AI Grader
Need help grading? Try our AI Grader for instant feedback on your assignments.
4BIG DATA AND ANALYTICS
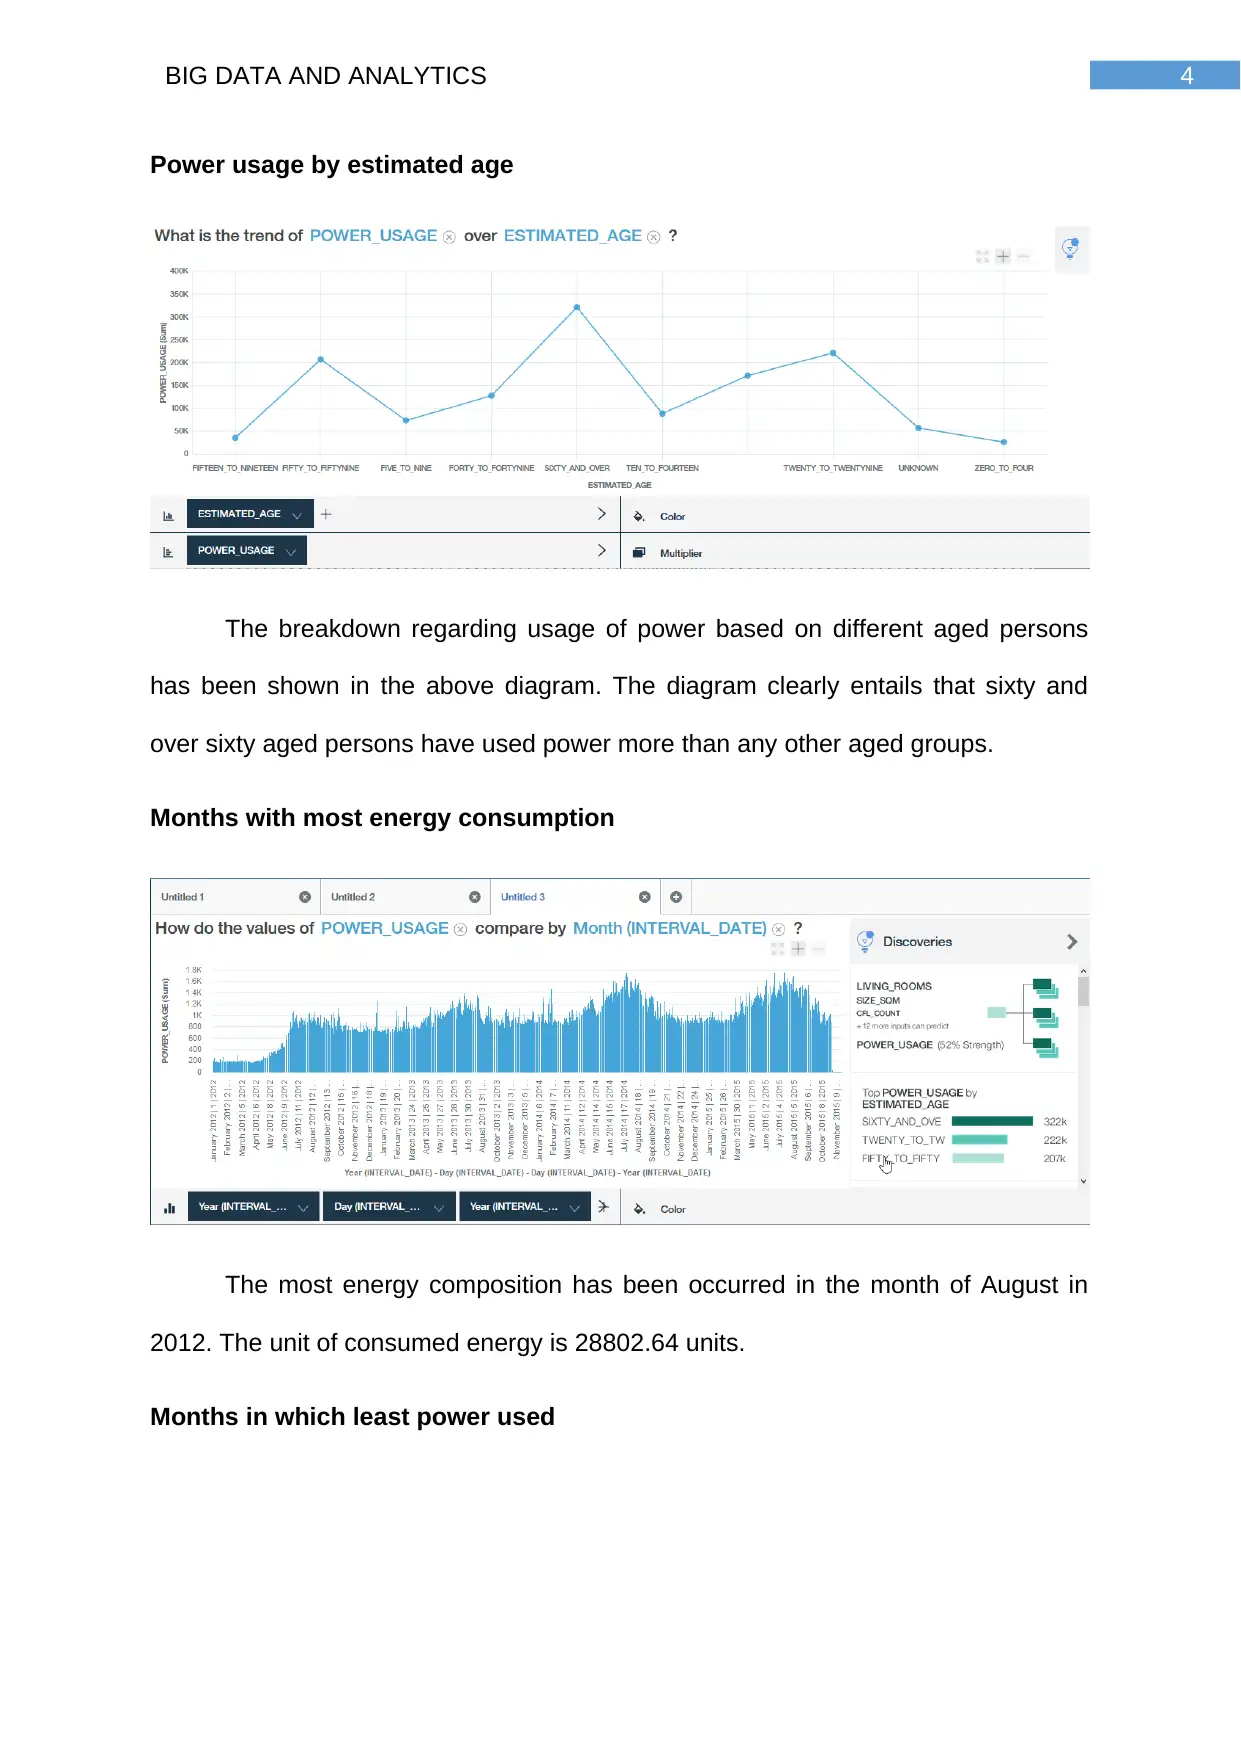
Power usage by estimated age
The breakdown regarding usage of power based on different aged persons
has been shown in the above diagram. The diagram clearly entails that sixty and
over sixty aged persons have used power more than any other aged groups.
Months with most energy consumption
The most energy composition has been occurred in the month of August in
2012. The unit of consumed energy is 28802.64 units.
Months in which least power used
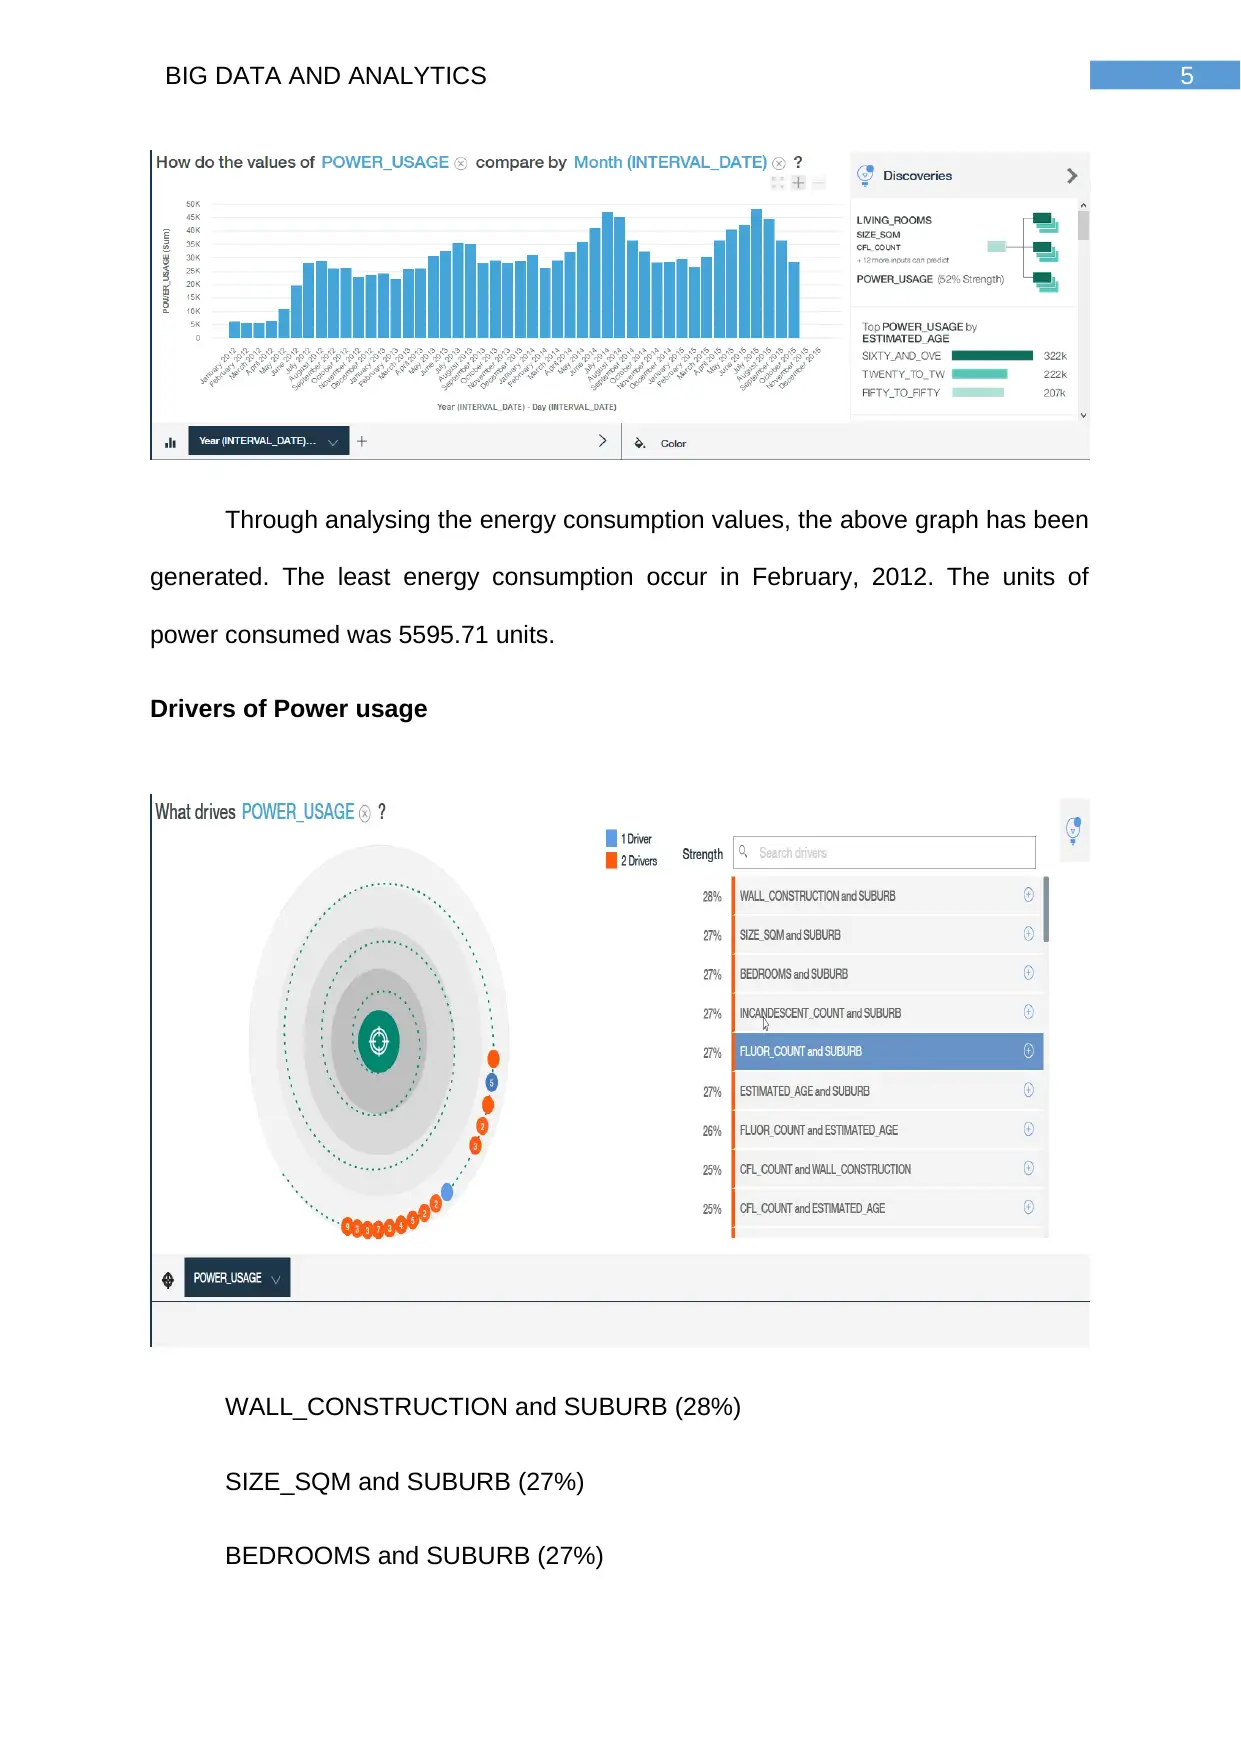
5BIG DATA AND ANALYTICS
Through analysing the energy consumption values, the above graph has been
generated. The least energy consumption occur in February, 2012. The units of
power consumed was 5595.71 units.
Drivers of Power usage
WALL_CONSTRUCTION and SUBURB (28%)
SIZE_SQM and SUBURB (27%)
BEDROOMS and SUBURB (27%)
Through analysing the energy consumption values, the above graph has been
generated. The least energy consumption occur in February, 2012. The units of
power consumed was 5595.71 units.
Drivers of Power usage
WALL_CONSTRUCTION and SUBURB (28%)
SIZE_SQM and SUBURB (27%)
BEDROOMS and SUBURB (27%)
6BIG DATA AND ANALYTICS
INCANDESCENT_COUNT and SUBURB (27%)
FLUOR_COUNT and SUBURB (27%)
ESTIMATED_AGE and SUBURB (27%)
FLUOR_COUNT and ESTIMATED_AGE (26%)
CFL_COUNT and WALL_CONSTRUCTION (25%)
CFL_COUNT and ESTIMATED_AGE. (25%)
INCANDESCENT_COUNT and SUBURB (27%)
FLUOR_COUNT and SUBURB (27%)
ESTIMATED_AGE and SUBURB (27%)
FLUOR_COUNT and ESTIMATED_AGE (26%)
CFL_COUNT and WALL_CONSTRUCTION (25%)
CFL_COUNT and ESTIMATED_AGE. (25%)
Paraphrase This Document
Need a fresh take? Get an instant paraphrase of this document with our AI Paraphraser
7BIG DATA AND ANALYTICS
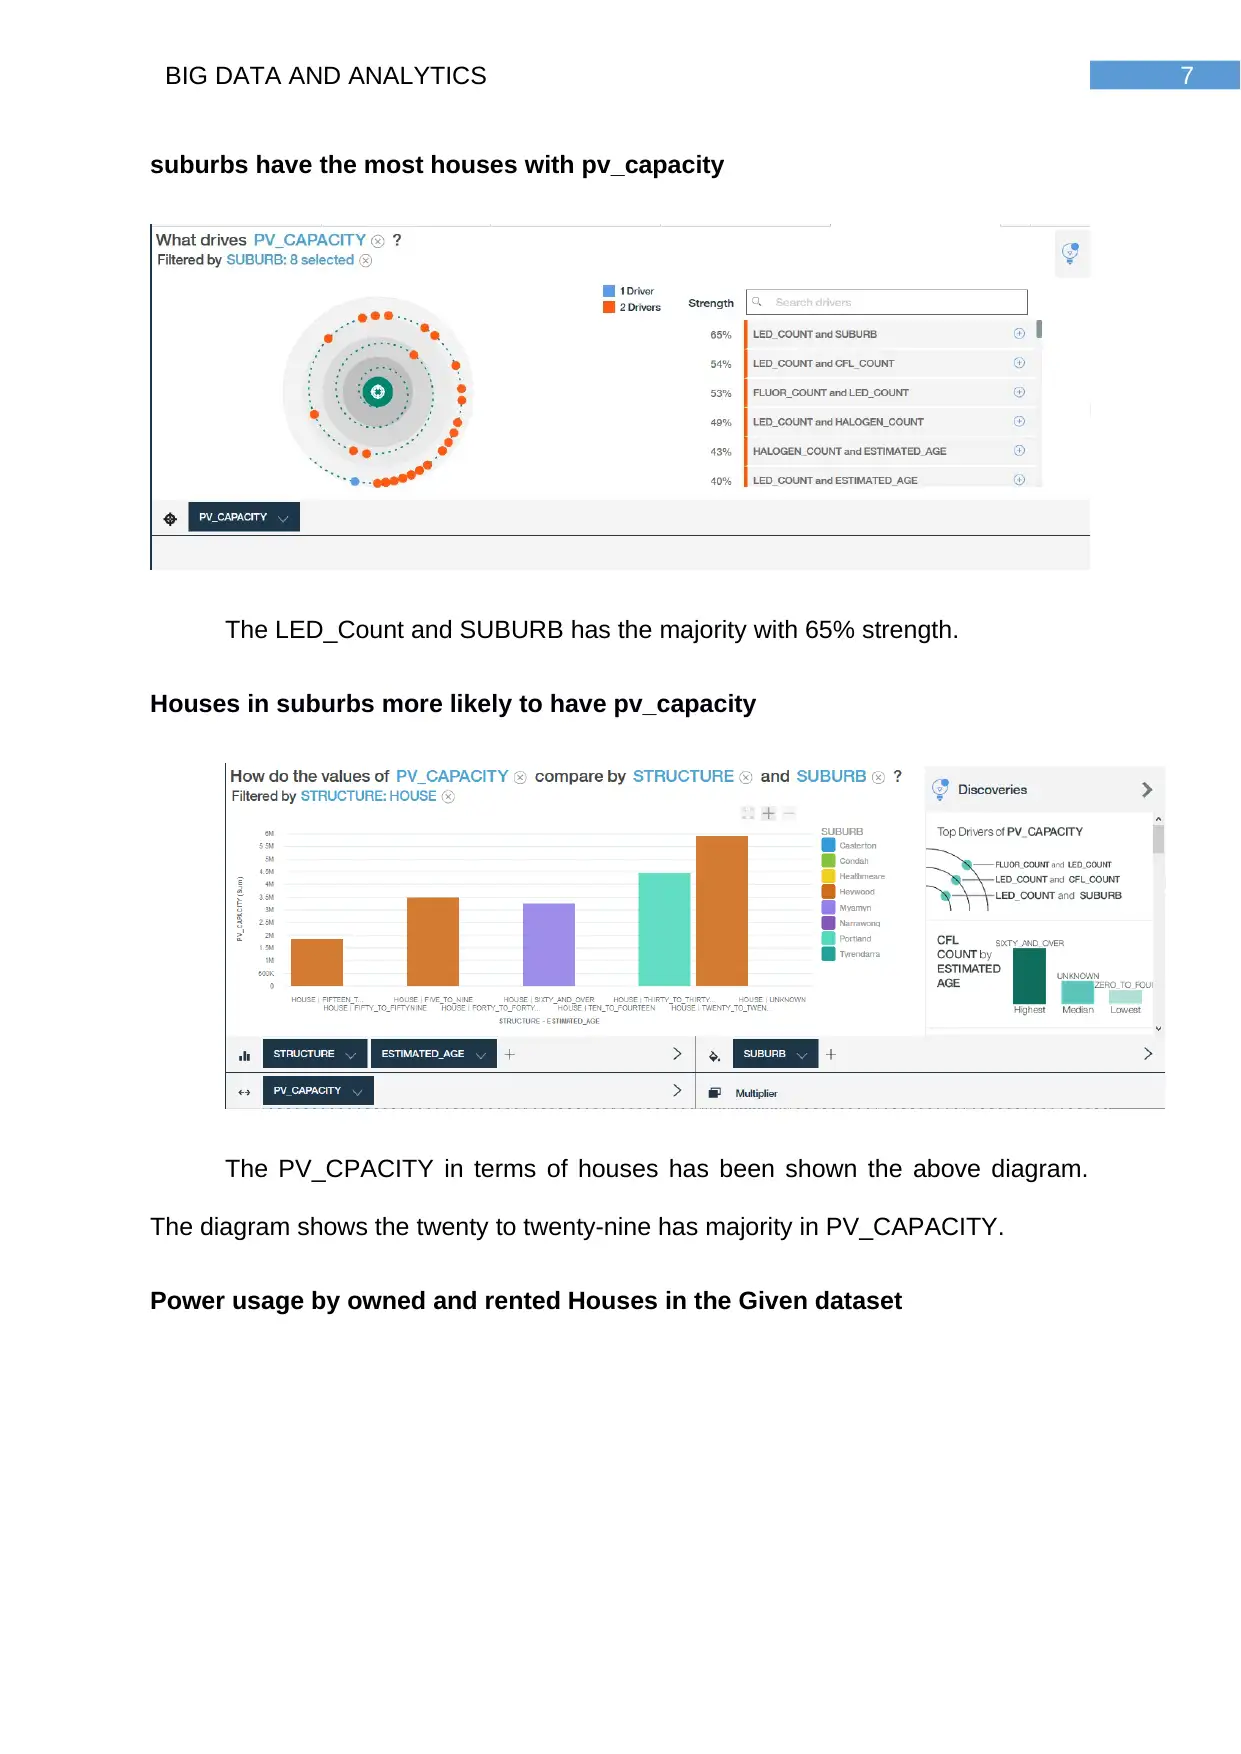
suburbs have the most houses with pv_capacity
The LED_Count and SUBURB has the majority with 65% strength.
Houses in suburbs more likely to have pv_capacity
The PV_CPACITY in terms of houses has been shown the above diagram.
The diagram shows the twenty to twenty-nine has majority in PV_CAPACITY.
Power usage by owned and rented Houses in the Given dataset
suburbs have the most houses with pv_capacity
The LED_Count and SUBURB has the majority with 65% strength.
Houses in suburbs more likely to have pv_capacity
The PV_CPACITY in terms of houses has been shown the above diagram.
The diagram shows the twenty to twenty-nine has majority in PV_CAPACITY.
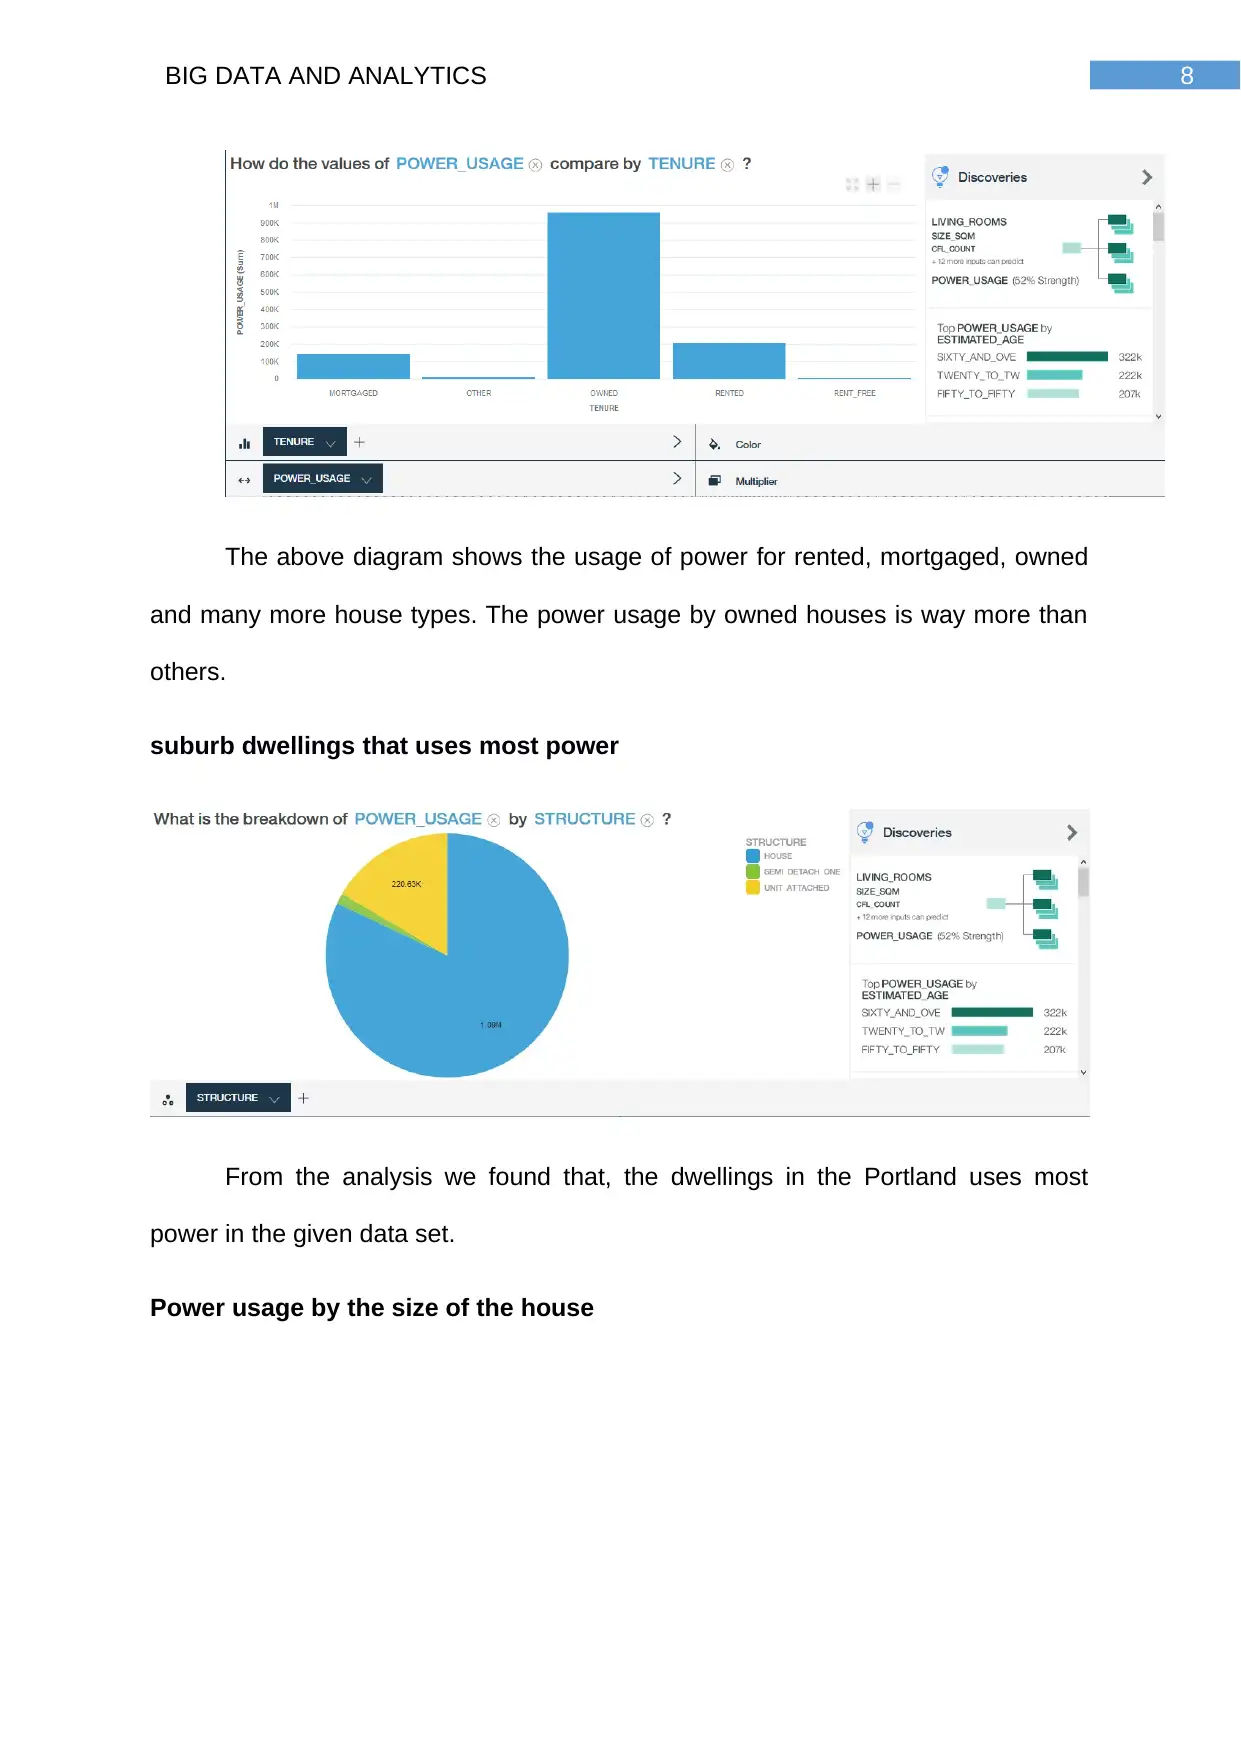
Power usage by owned and rented Houses in the Given dataset
8BIG DATA AND ANALYTICS
The above diagram shows the usage of power for rented, mortgaged, owned
and many more house types. The power usage by owned houses is way more than
others.
suburb dwellings that uses most power
From the analysis we found that, the dwellings in the Portland uses most
power in the given data set.
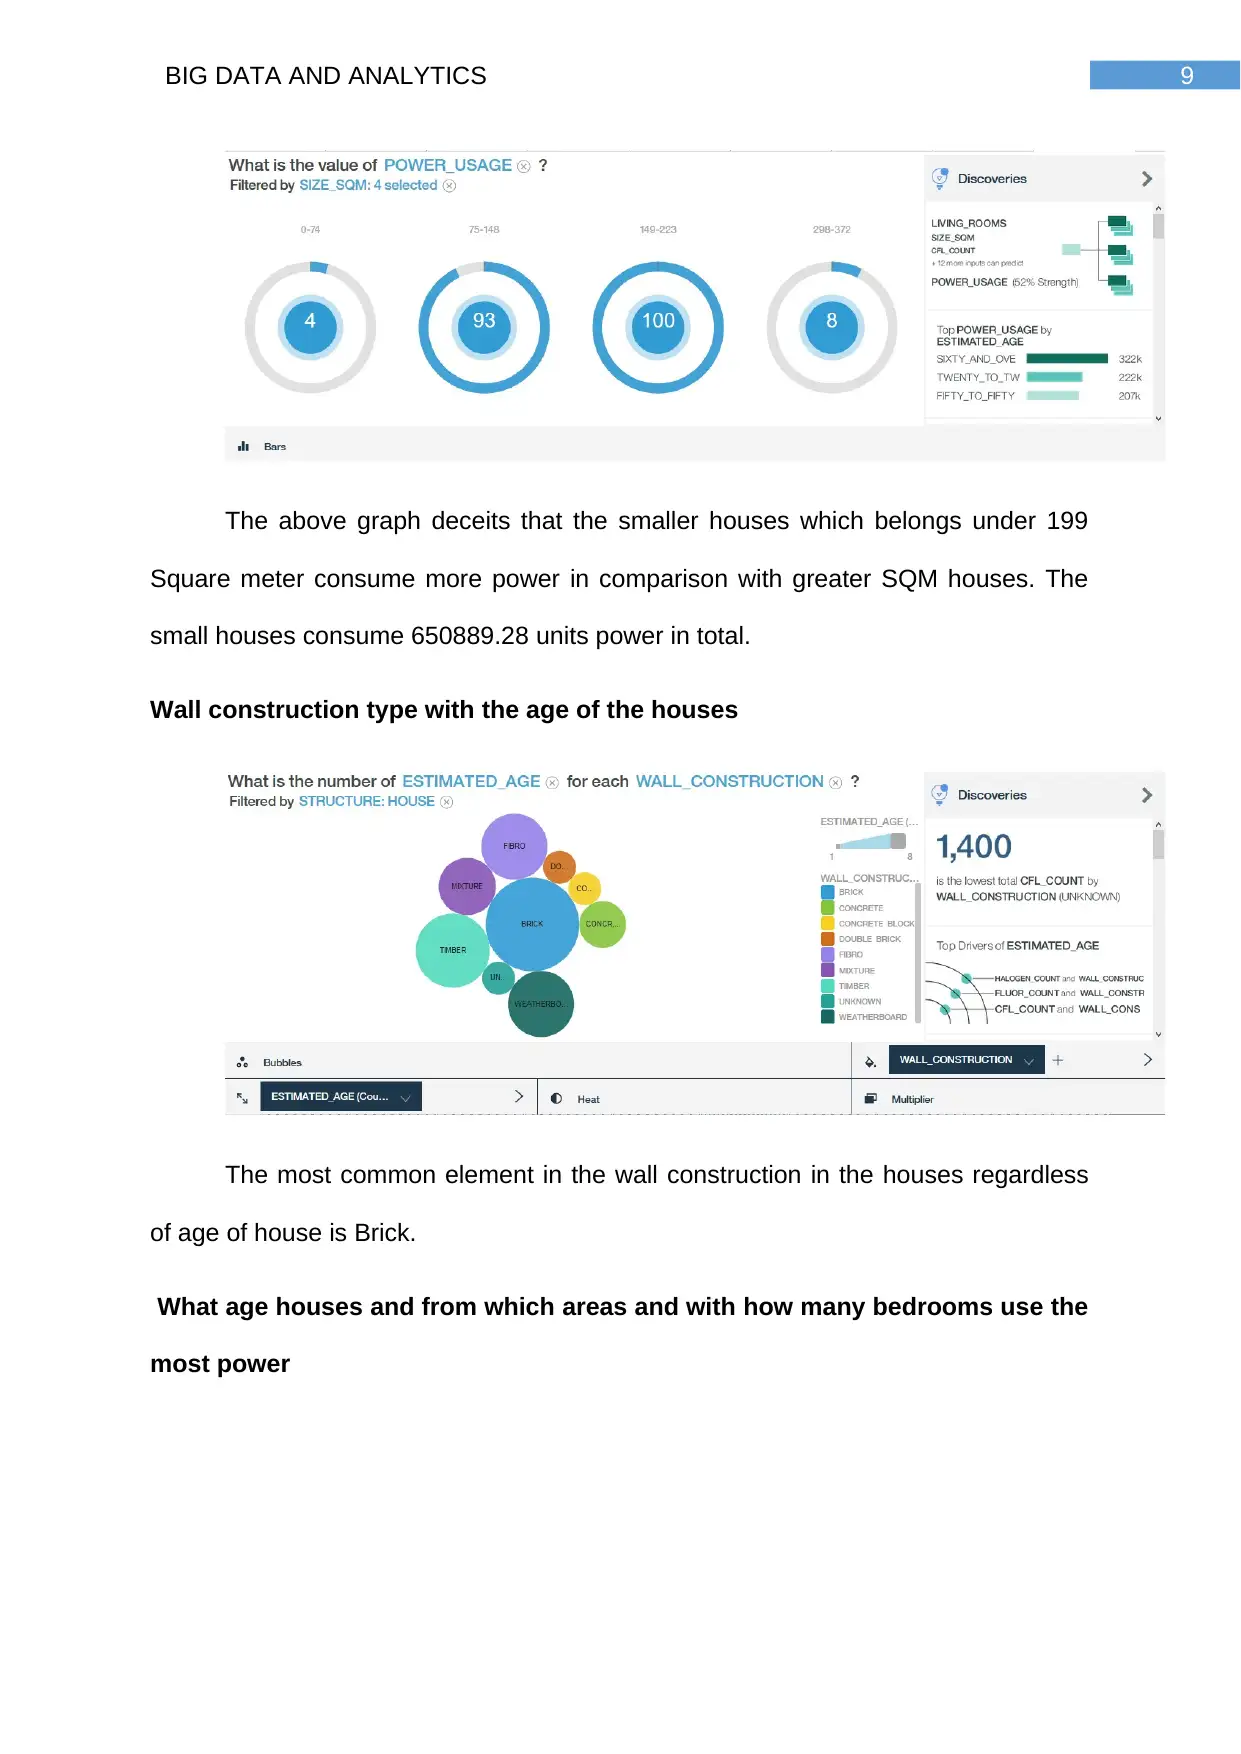
Power usage by the size of the house
The above diagram shows the usage of power for rented, mortgaged, owned
and many more house types. The power usage by owned houses is way more than
others.
suburb dwellings that uses most power
From the analysis we found that, the dwellings in the Portland uses most
power in the given data set.
Power usage by the size of the house
9BIG DATA AND ANALYTICS
The above graph deceits that the smaller houses which belongs under 199
Square meter consume more power in comparison with greater SQM houses. The
small houses consume 650889.28 units power in total.
Wall construction type with the age of the houses
The most common element in the wall construction in the houses regardless
of age of house is Brick.
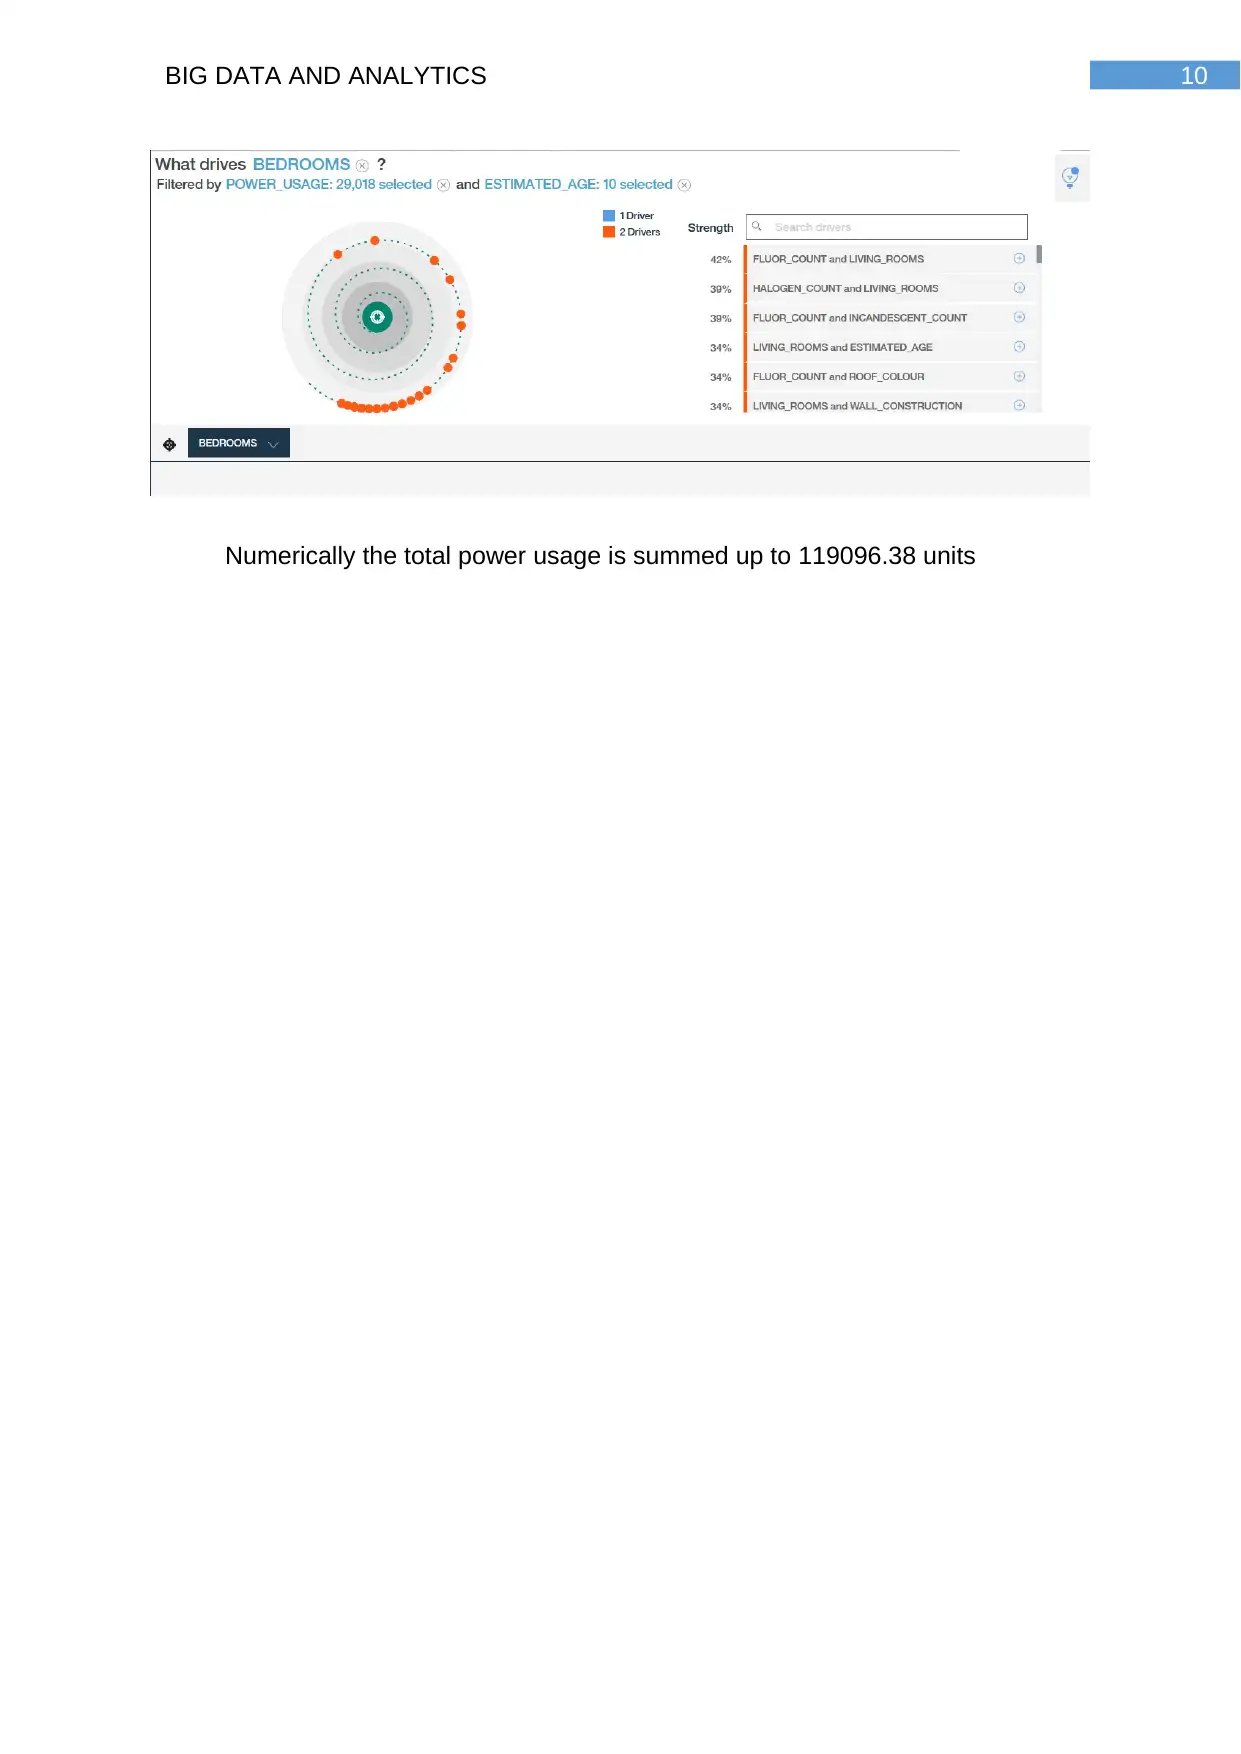
What age houses and from which areas and with how many bedrooms use the
most power
The above graph deceits that the smaller houses which belongs under 199
Square meter consume more power in comparison with greater SQM houses. The
small houses consume 650889.28 units power in total.
Wall construction type with the age of the houses
The most common element in the wall construction in the houses regardless
of age of house is Brick.
What age houses and from which areas and with how many bedrooms use the
most power
Secure Best Marks with AI Grader
Need help grading? Try our AI Grader for instant feedback on your assignments.
10BIG DATA AND ANALYTICS
Numerically the total power usage is summed up to 119096.38 units
Numerically the total power usage is summed up to 119096.38 units
11BIG DATA AND ANALYTICS
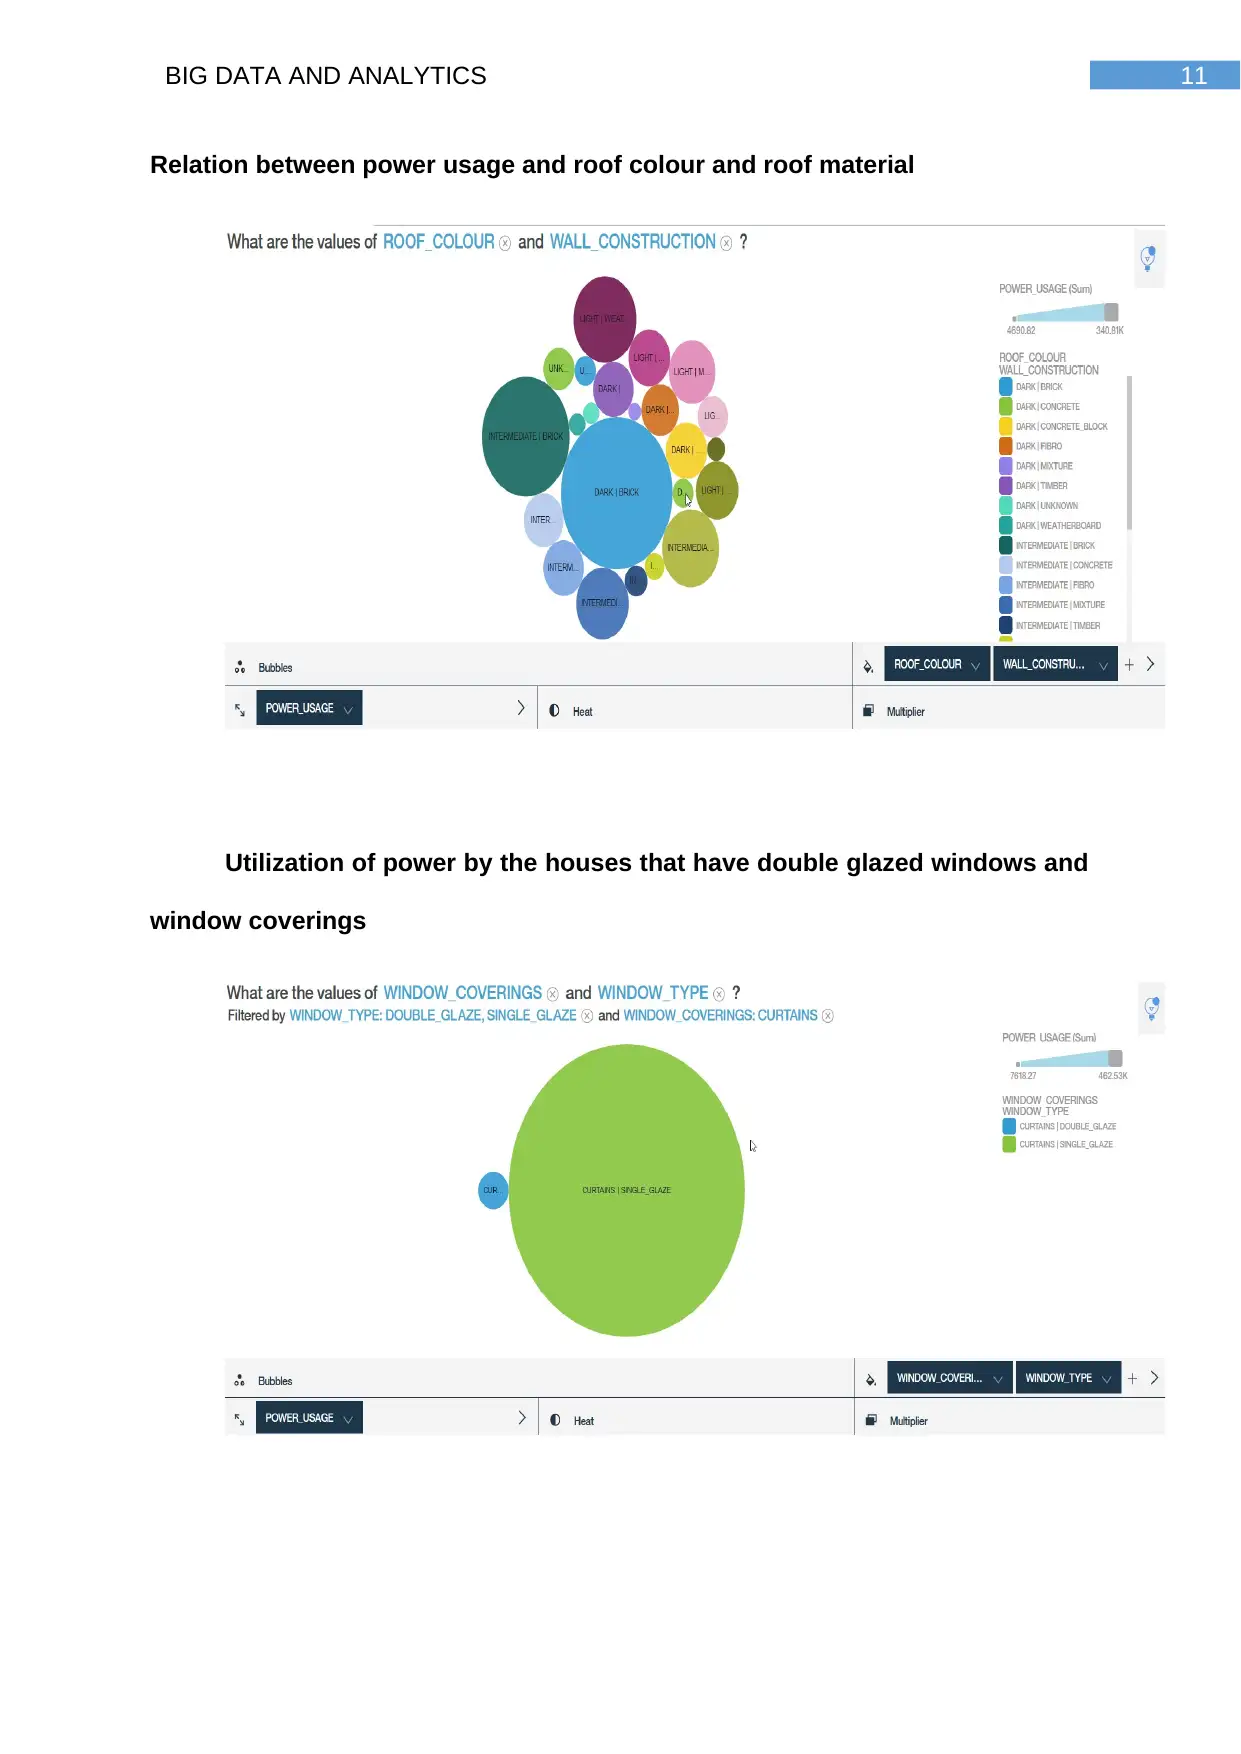
Relation between power usage and roof colour and roof material
Utilization of power by the houses that have double glazed windows and
window coverings
Relation between power usage and roof colour and roof material
Utilization of power by the houses that have double glazed windows and
window coverings
12BIG DATA AND ANALYTICS
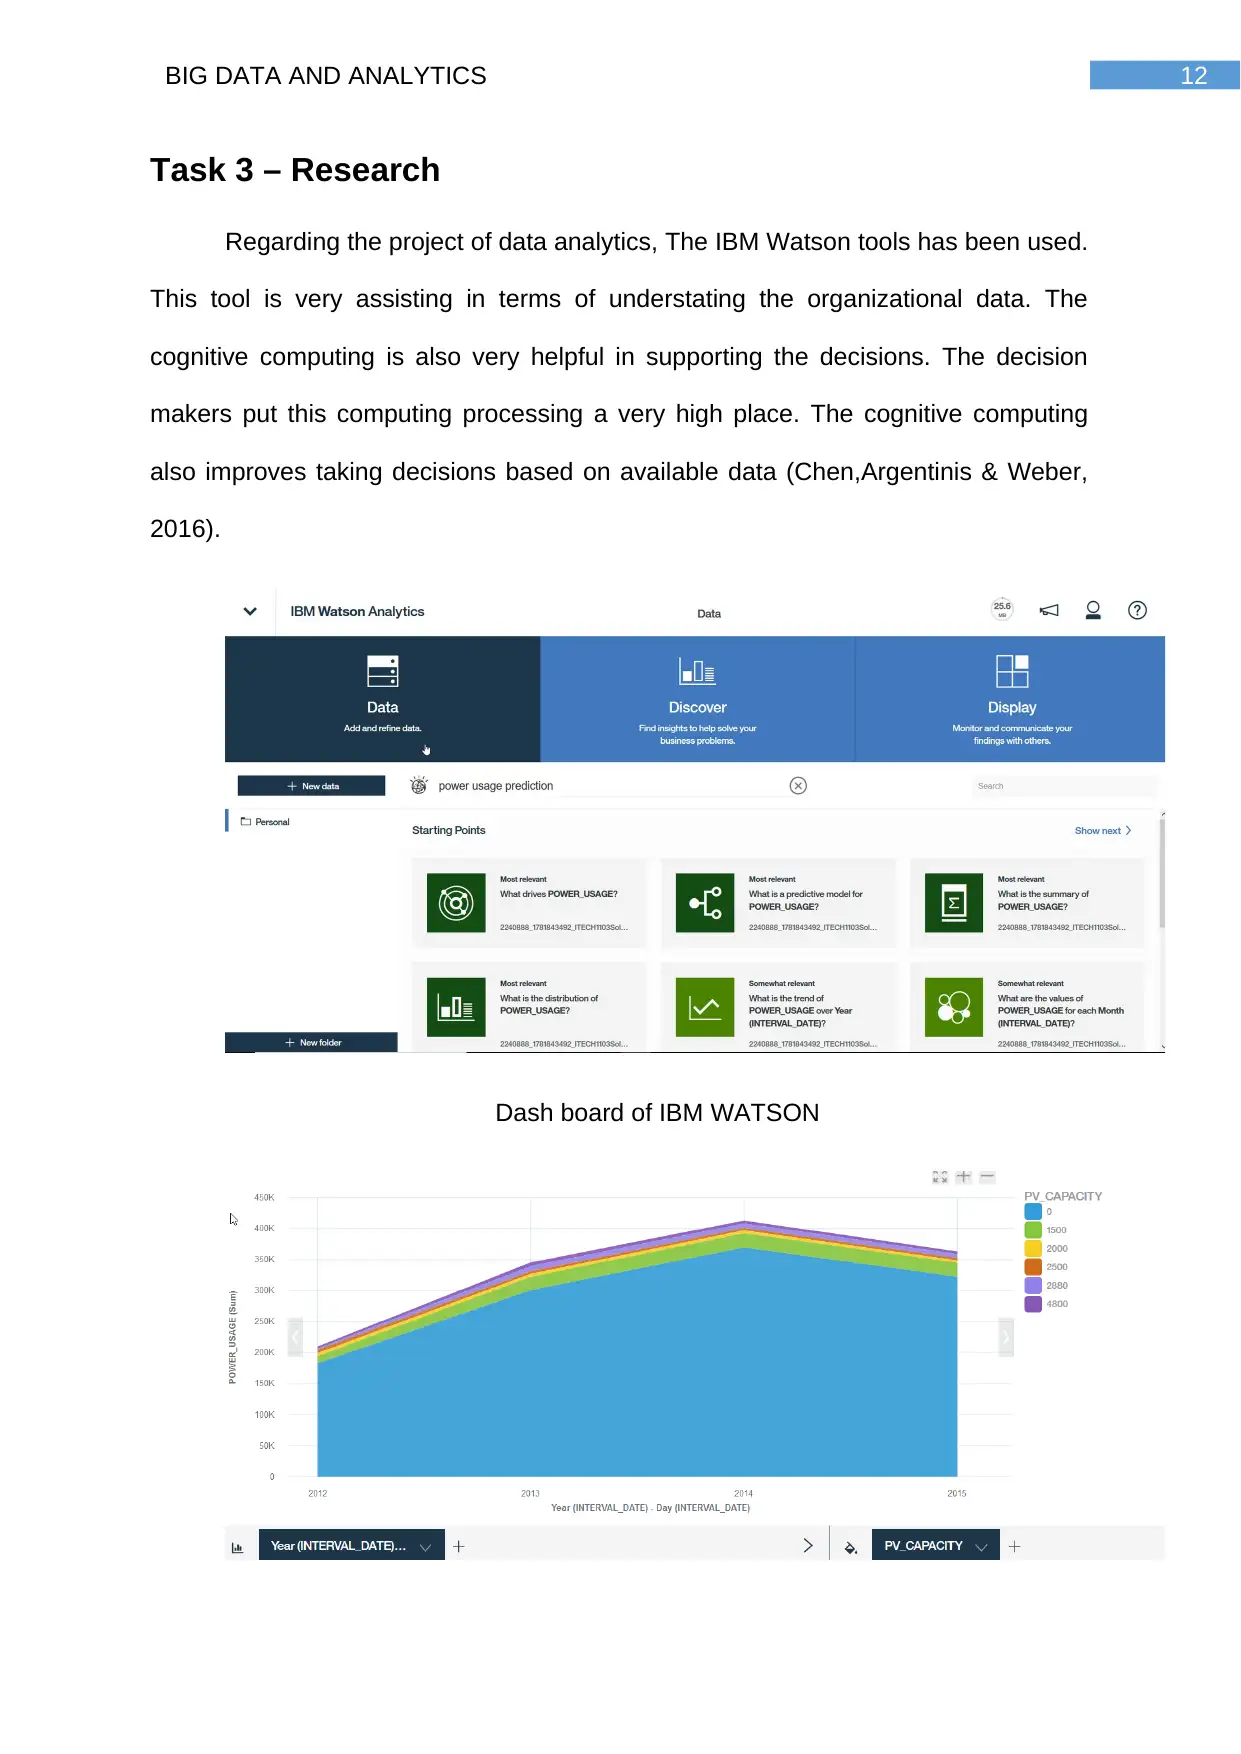
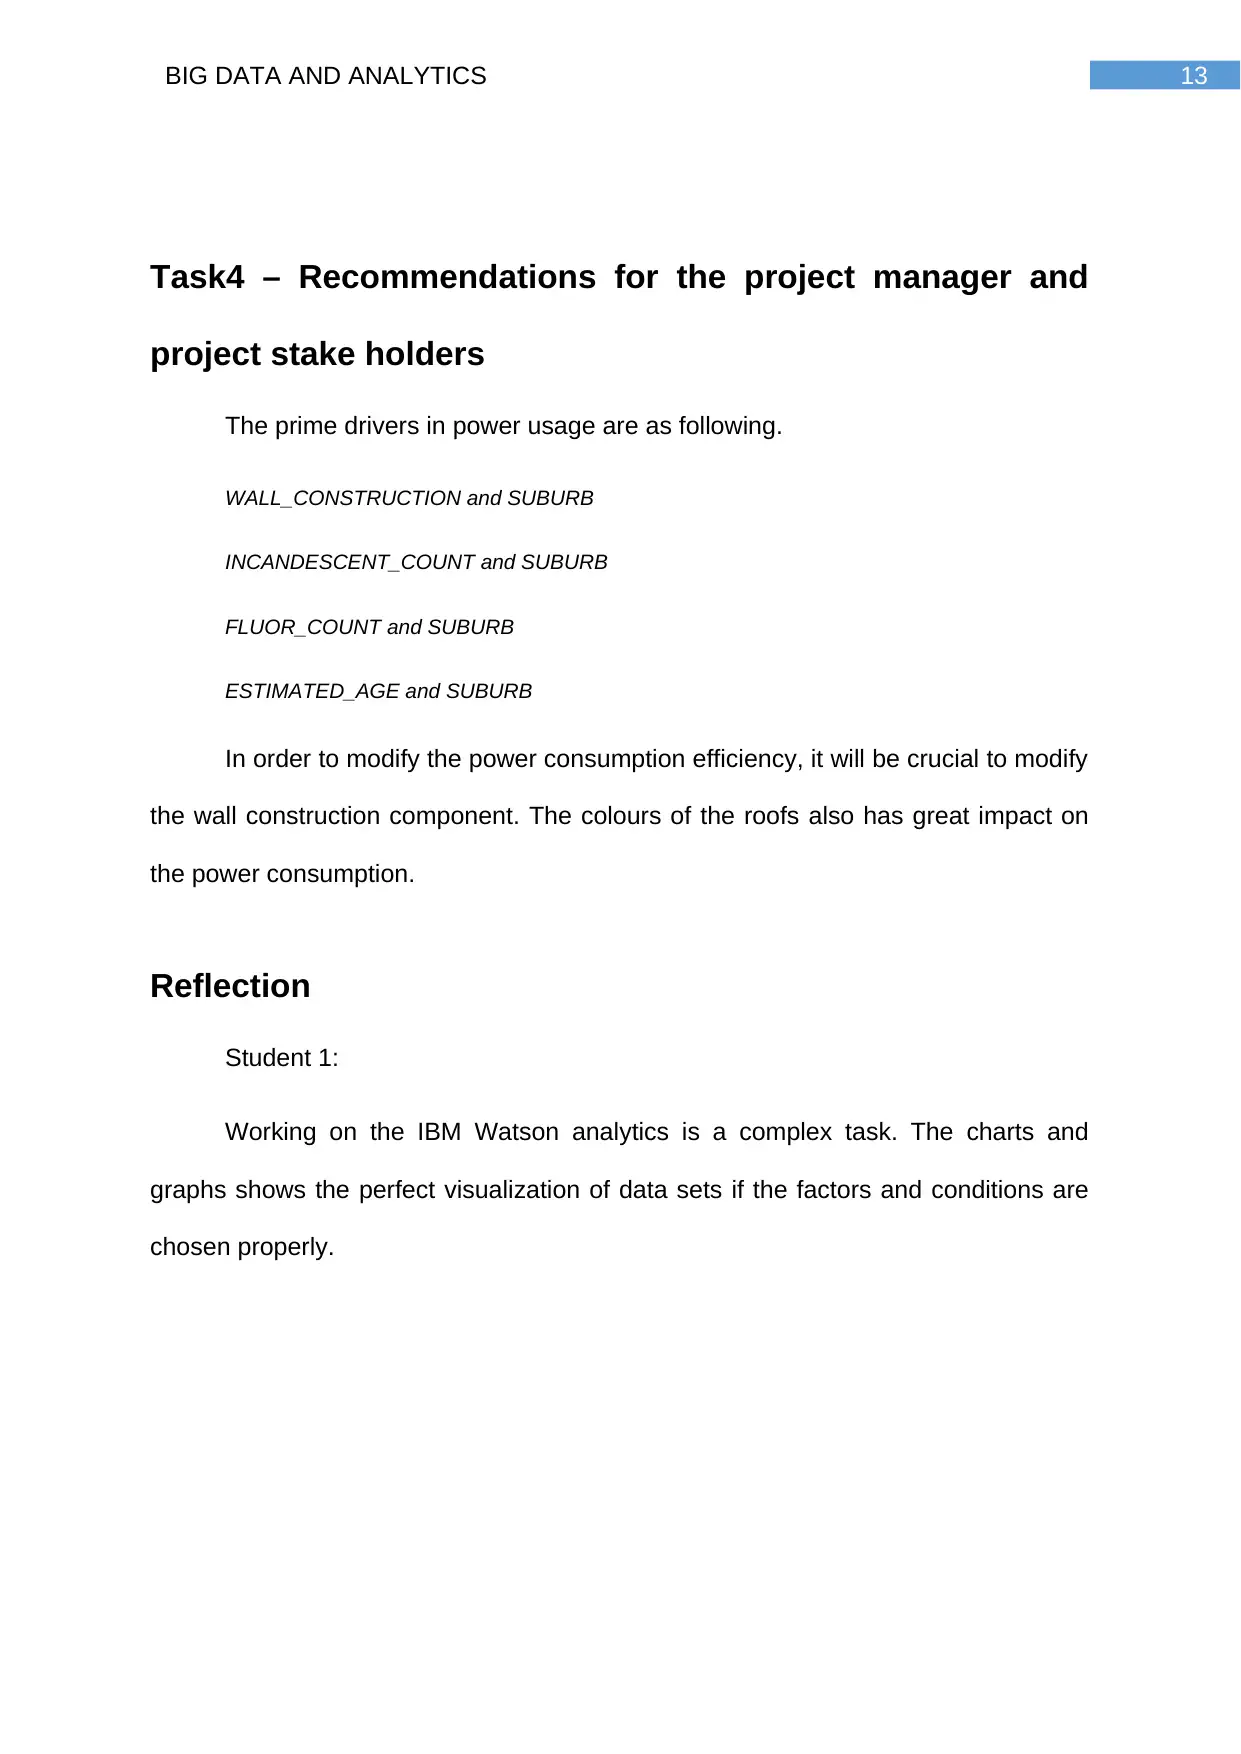
Task 3 – Research
Regarding the project of data analytics, The IBM Watson tools has been used.
This tool is very assisting in terms of understating the organizational data. The
cognitive computing is also very helpful in supporting the decisions. The decision
makers put this computing processing a very high place. The cognitive computing
also improves taking decisions based on available data (Chen,Argentinis & Weber,
2016).
Dash board of IBM WATSON
Paraphrase This Document
Need a fresh take? Get an instant paraphrase of this document with our AI Paraphraser
13BIG DATA AND ANALYTICS
Task4 – Recommendations for the project manager and
project stake holders
The prime drivers in power usage are as following.
WALL_CONSTRUCTION and SUBURB
INCANDESCENT_COUNT and SUBURB
FLUOR_COUNT and SUBURB
ESTIMATED_AGE and SUBURB
In order to modify the power consumption efficiency, it will be crucial to modify
the wall construction component. The colours of the roofs also has great impact on
the power consumption.
Reflection
Student 1:
Working on the IBM Watson analytics is a complex task. The charts and
graphs shows the perfect visualization of data sets if the factors and conditions are
chosen properly.
14BIG DATA AND ANALYTICS
References
Aggarwal, M., & Madhukar, M. (2017). IBM's Watson Analytics for Health Care: A
Miracle Made True. In Cloud Computing Systems and Applications in
Healthcare (pp. 117-134). IGI Global.
Chen, Y., Argentinis, J. E., & Weber, G. (2016). IBM Watson: how cognitive
computing can be applied to big data challenges in life sciences
research. Clinical therapeutics, 38(4), 688-701.
Derico, A., Leader, A. C., Kather, R., Engineer, O. S. A., & West, D. (2017). Make
Data Simple: IBM Watson Data Platform & Data Science Experience.
Devarakonda, M., & Tsou, C. H. (2015, January). Automated Problem List
Generation from Electronic Medical Records in IBM Watson. In AAAI (pp.
3942-3947).
Diamond, M., & Mattia, A. (2017). Data Visualization: An Exploratory Study into the Software Tools
Used by Businesses. Journal of Instructional Pedagogies, 18.
Gao, T., Dontcheva, M., Adar, E., Liu, Z., & Karahalios, K. G. (2015, November).
Datatone: Managing ambiguity in natural language interfaces for data
visualization. In Proceedings of the 28th Annual ACM Symposium on User
Interface Software & Technology (pp. 489-500). ACM.
High, R. (2012). The era of cognitive systems: An inside look at IBM Watson and
how it works. IBM Corporation, Redbooks.
Lak, P., Kavaklioglu, C., Sadat, M., Petitclerc, M., Wills, G., Miranskyy, A., & Bener,
A. B. (2017, November). A probabilistic approach for modelling user
15BIG DATA AND ANALYTICS
preferences in recommender systems: a case study on IBM watson analytics.
In Proceedings of the 27th Annual International Conference on Computer
Science and Software Engineering (pp. 38-47). IBM Corp..
Mylopoulos, J. (2017, November). Goal-Oriented Regulatory Intelligence: How Can
Watson Analytics Help?. In Conceptual Modeling: 36th International
Conference, ER 2017, Valencia, Spain, November 6–9, 2017,
Proceedings (Vol. 10650, p. 77). Springer.
Tsoi, K. K., Chan, F. C., Hirai, H. W., Keung, G. K., Kuo, Y. H., Tai, S., & Meng, H.
M. (2018). Data Visualization with IBM Watson Analytics for Global Cancer
Trends Comparison from World Health Organization. International Journal of
Healthcare Information Systems and Informatics (IJHISI), 13(1), 45-54.
1 out of 16


Your All-in-One AI-Powered Toolkit for Academic Success.
+13062052269
info@desklib.com
Available 24*7 on WhatsApp / Email
![[object Object]](/_next/static/media/star-bottom.7253800d.svg)
Unlock your academic potential
© 2024 | Zucol Services PVT LTD | All rights reserved.