Big Data and Analytics - Assignment
VerifiedAdded on 2021/05/31
|18
|3528
|41
AI Summary
Contribute Materials
Your contribution can guide someone’s learning journey. Share your
documents today.
Big Data and Analytics
Assignment 1- Data Analysis
Assignment 1- Data Analysis
Secure Best Marks with AI Grader
Need help grading? Try our AI Grader for instant feedback on your assignments.

Table of Contents
Abstract................................................................................................................................3
Introduction..........................................................................................................................3
Background..........................................................................................................................3
Dashboard/report..................................................................................................................4
Research...............................................................................................................................5
Recommendations................................................................................................................4
Reflection.............................................................................................................................5
References............................................................................................................................5
2 | P a g e
Big Data and Analytics
Assignment 1
Data Analysis
Abstract
The research study is arranged for the analysis of big data by using the IBM Watson Data
analytics tool. From this analysis, it is observed that the highest CFL count is noted in the month
of October, median CFL count is observed in the month of March, while lowest CFL count is
observed in the month of November. It is observed that the CFL count for the estimated age of
sixty and over is highest and it is given as 190k. There is a 55% growth in the CFL count from
the year 2012 to year 2015. It is observed that 2458 is the lowest total bathrooms by estimated
age fifteen to nineteen. The top CFL count is observed for the Dark colour. The highest total
flour count is observed in the month of October and it is given as 22.8k. Halogen count is
observed highest in the month of October and it is observed lowest in the month of February.
The median Halogen count is observed for the month of March. For optimization of the energy
use, we need to implement several things such as use of efficient and modified electrical
machines, use of CFL lights, etc. For the reduction in CO2 emissions Coal energy consumption
should be minimized, because coal energy consumption produce CO2 emissions in a large
proportion. The predictive model for the future energy use and CO2 emissions should include the
nuclear energy, wind energy, solar energy, biomass energy, etc. Power usage is increasing from
the year 2012 to year 2014 and again it decreases from year 2014 to year 2015. A linear
relationship exists between the LED count and CFL count. Most affected factors for the
prediction model are observed as suburban type, size, incandescent count, and living rooms.
Introduction
We know that the analysis of different data sets is required for taking decisions regarding the
business, management, etc. Now a day, industries and businesses generates a big data and
analysis of these big data sets is required for understanding the characteristics of the production
or service. For the analysis of these types of big data sets, we need to use different statistical
tools and techniques for the analysis. It becomes necessary to analyse the data from different
industries for making effective decisions. Also, this data analysis provides the proper estimates
for future use. Here, we have to analyse one such a big data set by using the IBM Watson
analytics tool. This data set is related to power use or energy consumption by different types of
3 | P a g e
users. Statistical data analysis plays an important role in this new era of businesses and
industries. It is important to use different statistical software’s for the analysis of big data. For
optimization of the energy use, we need to implement several things such as use of efficient and
modified electrical machines, use of CFL lights, etc. For the reduction in CO2 emissions Coal
energy consumption should be minimized, because coal energy consumption produce CO2
emissions in a large proportion. The predictive model for the future energy use and CO2
emissions should include the nuclear energy, wind energy, solar energy, biomass energy, etc.
Background
The Federation University conduct a Solar Cities project for study of consumption of energy.
This project involved the recruitment of the different households and businesses across the
Loddon Mallee and Grampians regions. During this research study, changes in energy
consumption were monitored by the researchers. Researchers find out all related factors which
affects the energy consumption. Researchers also find out the relationship exists between the
energy consumption and different variables that could influence energy consumption. These
possible factors were divided into set of their features. Then researchers were taken the
measurements for these factors. Given data set includes the sets of features such as adoption of
solar energy technologies, geographic characteristics, physical characteristics of the dwellings,
including such things as the dwellings age, size, number of stories , number of lights, insulation,
etc. The main goal of this research study or project is to understand the drivers of power
consumption, For this research study, researchers wants to find out the combination of features
which could useful in the reduction of energy consumption. Also, researchers want to predict the
model for future demand of energy use and CO2 emissions. Here, we have to study different
patterns of energy uses and CO2 emissions for the given data set. Also, we will develop a
predictive model for future energy use by using the IBM Watson Analytics tool. We have to
analyse entire data set by using IBM Watson Analytics tool and then we have to make some
discoveries. We have to study any useful facts from this data set, interesting insights, trends, and
patterns regarding the energy consumption.
Dashboard/Report
In this section we have to analyse the given big data set by using IBM Watson Analytics tool.
Given data set for the energy consumption have different variables and the list of these variables
is summarised as below:
Variable 1
SUBURB
4 | P a g e
Secure Best Marks with AI Grader
Need help grading? Try our AI Grader for instant feedback on your assignments.
Data type is text.
Victorian Suburb names of the houses chosen for the study
Possible values: Portland, Narrawong, Heywood, Tyrendarra, Sandford, Digby, Myamyn,
Condah, Casterton, Heathmeare, Drumborg, Allestree, Bolwarra, Nelson, Bahgallah, Heathmere,
Dartmoo
Variable 2
TENURE
Data type is text.
The status of the property in terms of how people are living in it
Possible values: "OWNED, RENTED, MORTGAGED, OTHER, RENT_FREE,
LIFE_TENURE, UNKNOWN"
Variable 3
Estimated Age
The estimated age of the property as ordinal categorical intervals
Variable 4
Wall construction
The type of material and/or construction type used for the dwelling walls
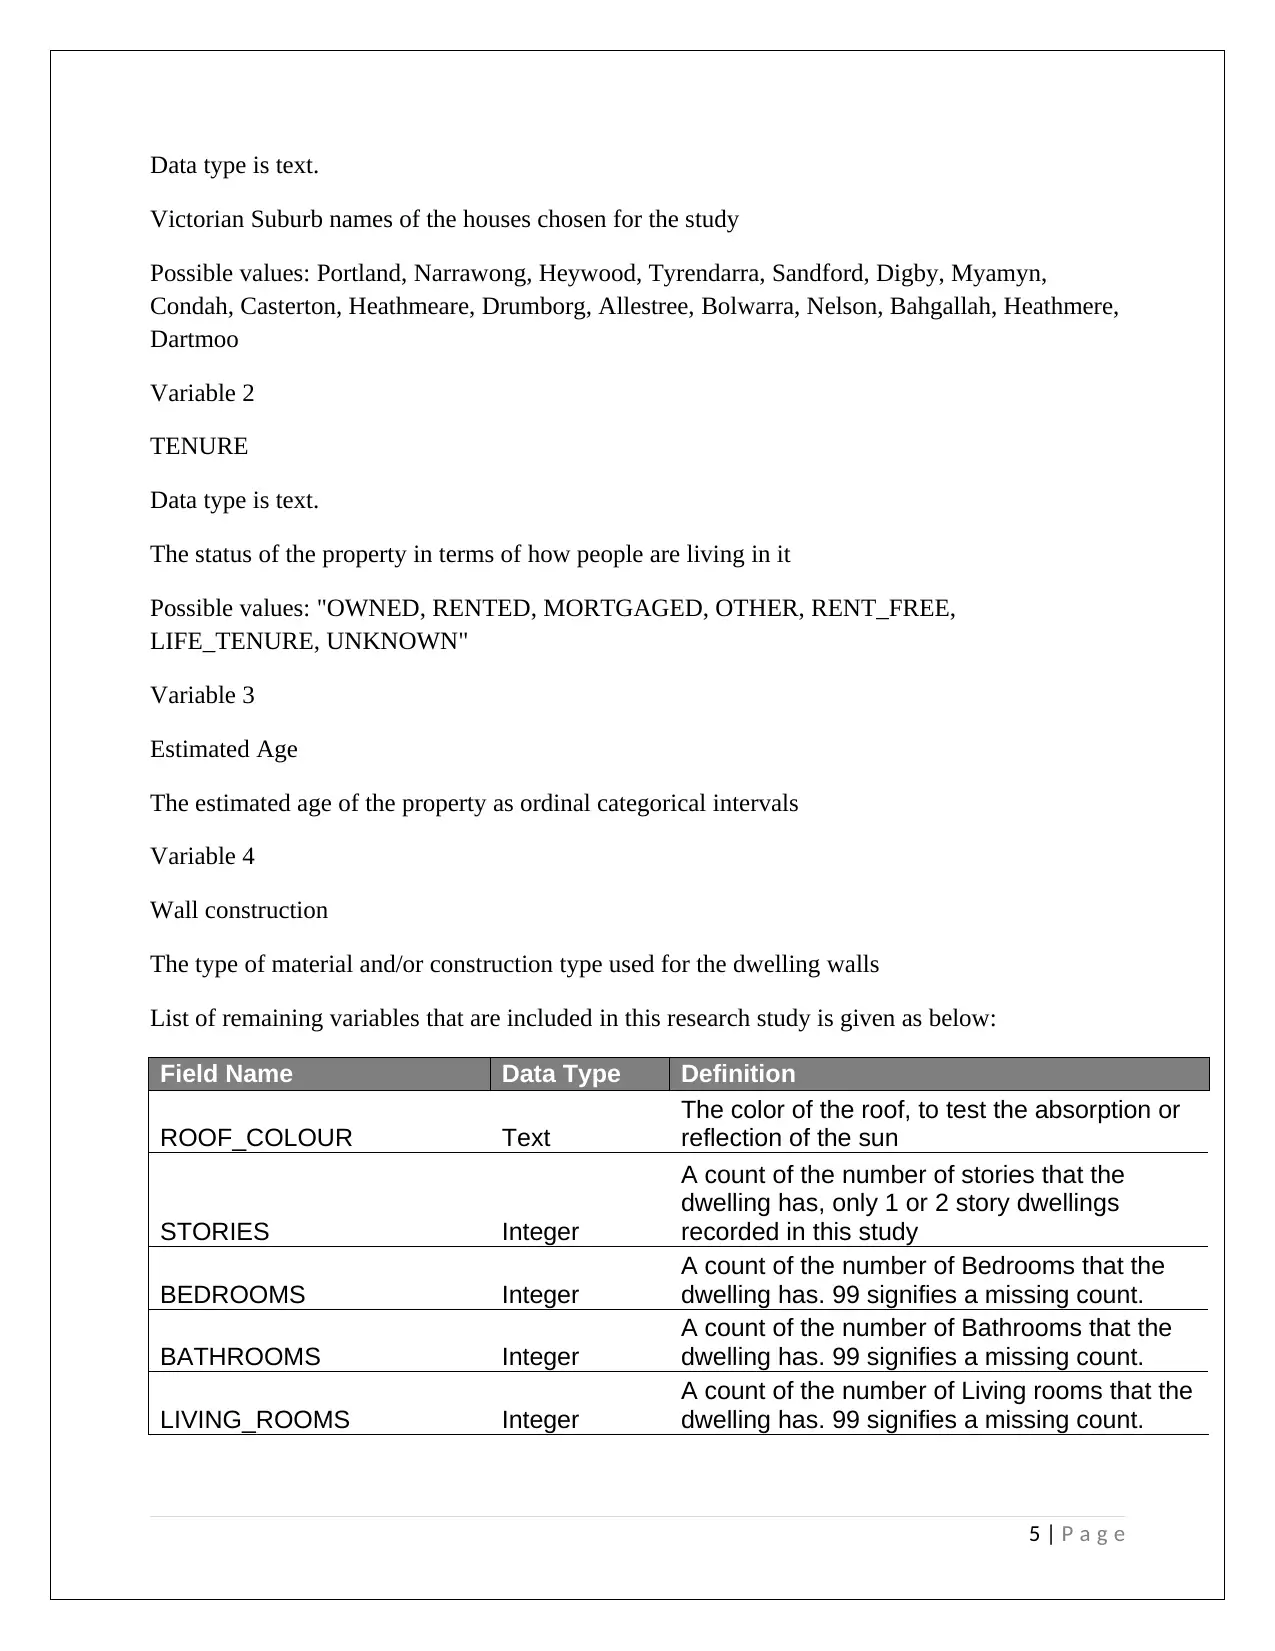
List of remaining variables that are included in this research study is given as below:
Field Name Data Type Definition
ROOF_COLOUR Text
The color of the roof, to test the absorption or
reflection of the sun
STORIES Integer
A count of the number of stories that the
dwelling has, only 1 or 2 story dwellings
recorded in this study
BEDROOMS Integer
A count of the number of Bedrooms that the
dwelling has. 99 signifies a missing count.
BATHROOMS Integer
A count of the number of Bathrooms that the
dwelling has. 99 signifies a missing count.
LIVING_ROOMS Integer
A count of the number of Living rooms that the
dwelling has. 99 signifies a missing count.
5 | P a g e
Victorian Suburb names of the houses chosen for the study
Possible values: Portland, Narrawong, Heywood, Tyrendarra, Sandford, Digby, Myamyn,
Condah, Casterton, Heathmeare, Drumborg, Allestree, Bolwarra, Nelson, Bahgallah, Heathmere,
Dartmoo
Variable 2
TENURE
Data type is text.
The status of the property in terms of how people are living in it
Possible values: "OWNED, RENTED, MORTGAGED, OTHER, RENT_FREE,
LIFE_TENURE, UNKNOWN"
Variable 3
Estimated Age
The estimated age of the property as ordinal categorical intervals
Variable 4
Wall construction
The type of material and/or construction type used for the dwelling walls
List of remaining variables that are included in this research study is given as below:
Field Name Data Type Definition
ROOF_COLOUR Text
The color of the roof, to test the absorption or
reflection of the sun
STORIES Integer
A count of the number of stories that the
dwelling has, only 1 or 2 story dwellings
recorded in this study
BEDROOMS Integer
A count of the number of Bedrooms that the
dwelling has. 99 signifies a missing count.
BATHROOMS Integer
A count of the number of Bathrooms that the
dwelling has. 99 signifies a missing count.
LIVING_ROOMS Integer
A count of the number of Living rooms that the
dwelling has. 99 signifies a missing count.
5 | P a g e
SIZE_SQM Integer
An approximate size area of the dwelling, in 6
different sizes. 0 signifies a missing
measurement.
WINDOW_TYPE Text The physical structure of the glass
WINDOW_COVERINGS Text What type of covering over the windows if any
STRUCTURE Text What type of dwelling it is
CFL COUNT Integer Number of compact fluorescent lamps
HALOGEN_COUNT Integer Number of Halogen lights in the dwelling
LED_COUNT Integer Number of LED lights in the dwelling
INCANDESCENT_COUNT Integer Number of Incandescent lights in the dwelling
FLUOR_COUNT Integer Number of fluorscent lights in the dwelling
INSULATION integer
Where the insulation is situated
0 no insulation or unknown
1 ceiling only
2 wall and ceiling
3 wall, ceiling and floor
PV_CAPACITY
The amount of power being created by solar
PV panels.
INTERVAL_DATE TEXT Date of power meter reading, collected daily
POWER_USAGE Decimal
Amount of power being consumed on the
given day
Now, we have to analyse this data set by using the IBM Watson Analytics tool. By using this
tool, some of the discoveries were made which are presented below:
First of all we have to discover the top CFL count by the estimated age and analysis is given as
below:
6 | P a g e
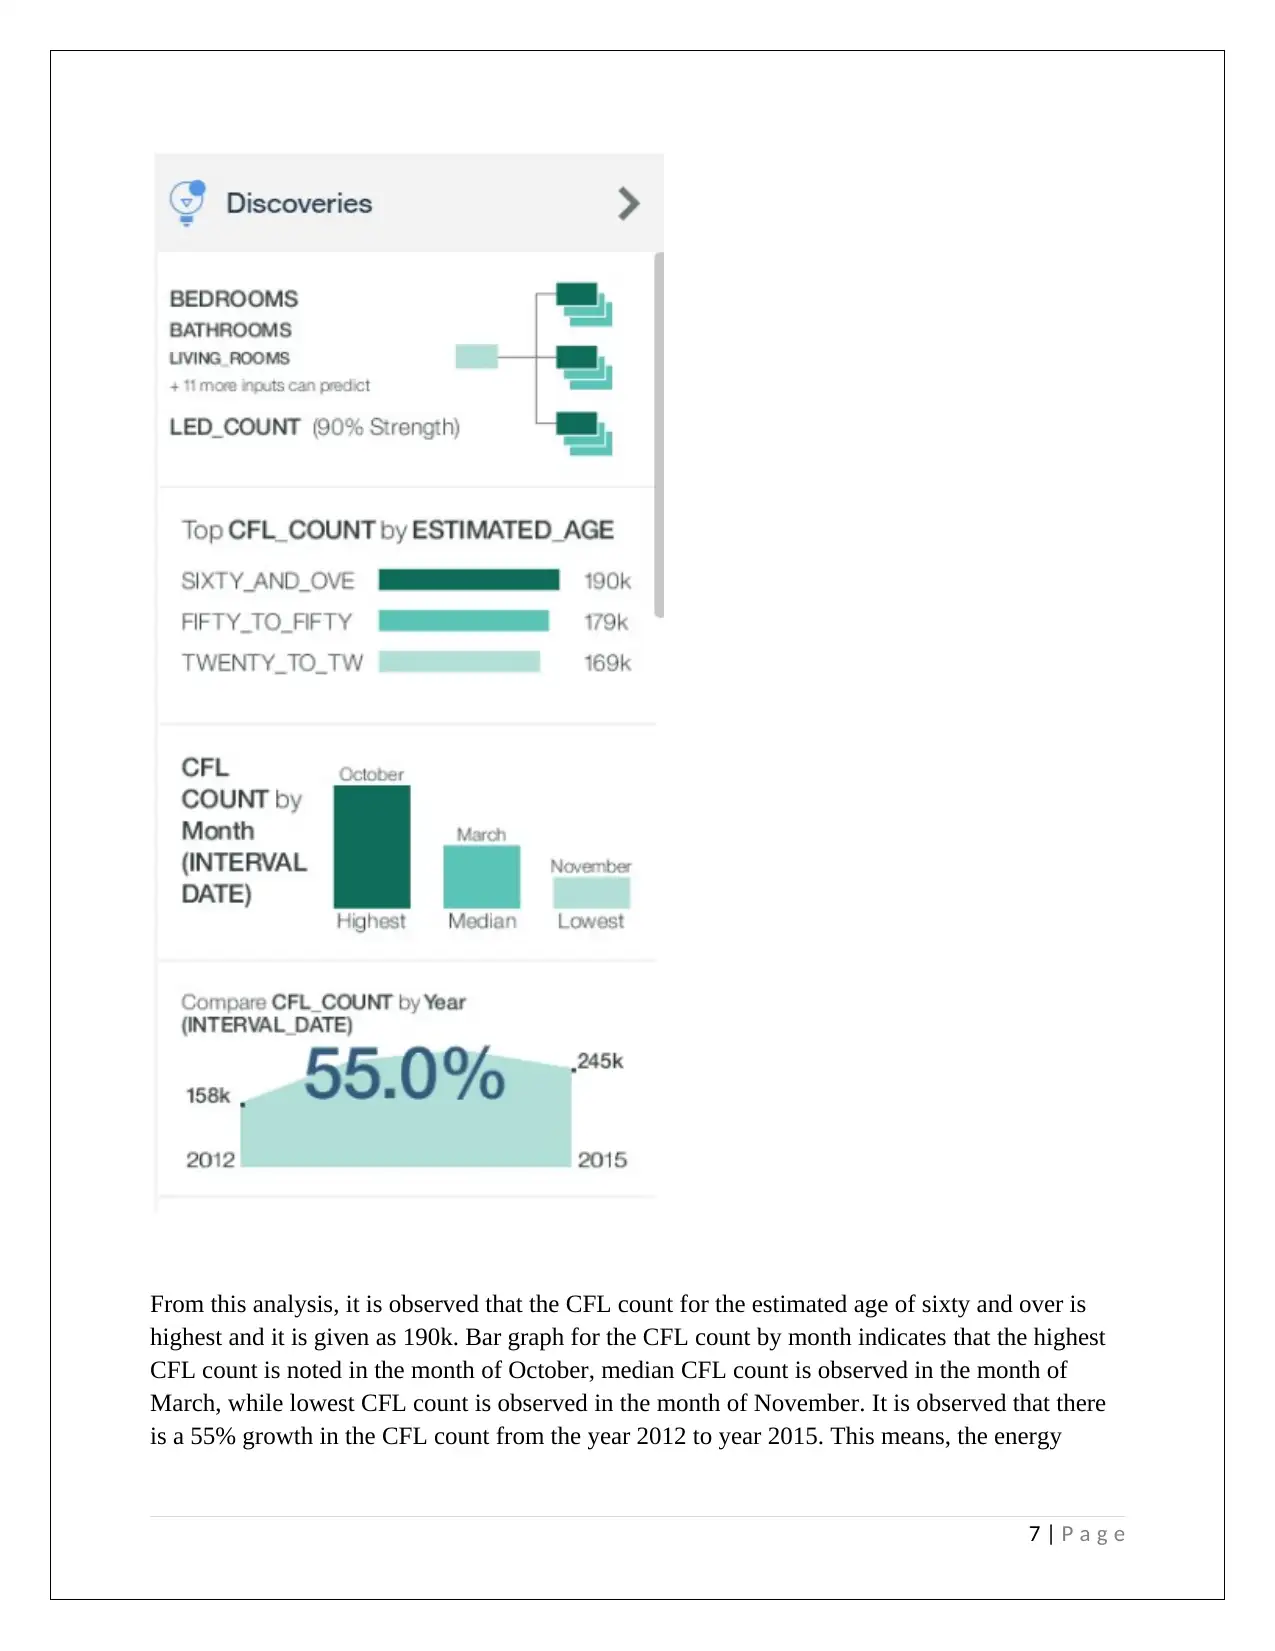
From this analysis, it is observed that the CFL count for the estimated age of sixty and over is
highest and it is given as 190k. Bar graph for the CFL count by month indicates that the highest
CFL count is noted in the month of October, median CFL count is observed in the month of
March, while lowest CFL count is observed in the month of November. It is observed that there
is a 55% growth in the CFL count from the year 2012 to year 2015. This means, the energy
7 | P a g e
Paraphrase This Document
Need a fresh take? Get an instant paraphrase of this document with our AI Paraphraser
consumption is increasing rapidly and it is important to use other sources of energy such as solar,
wind, etc.
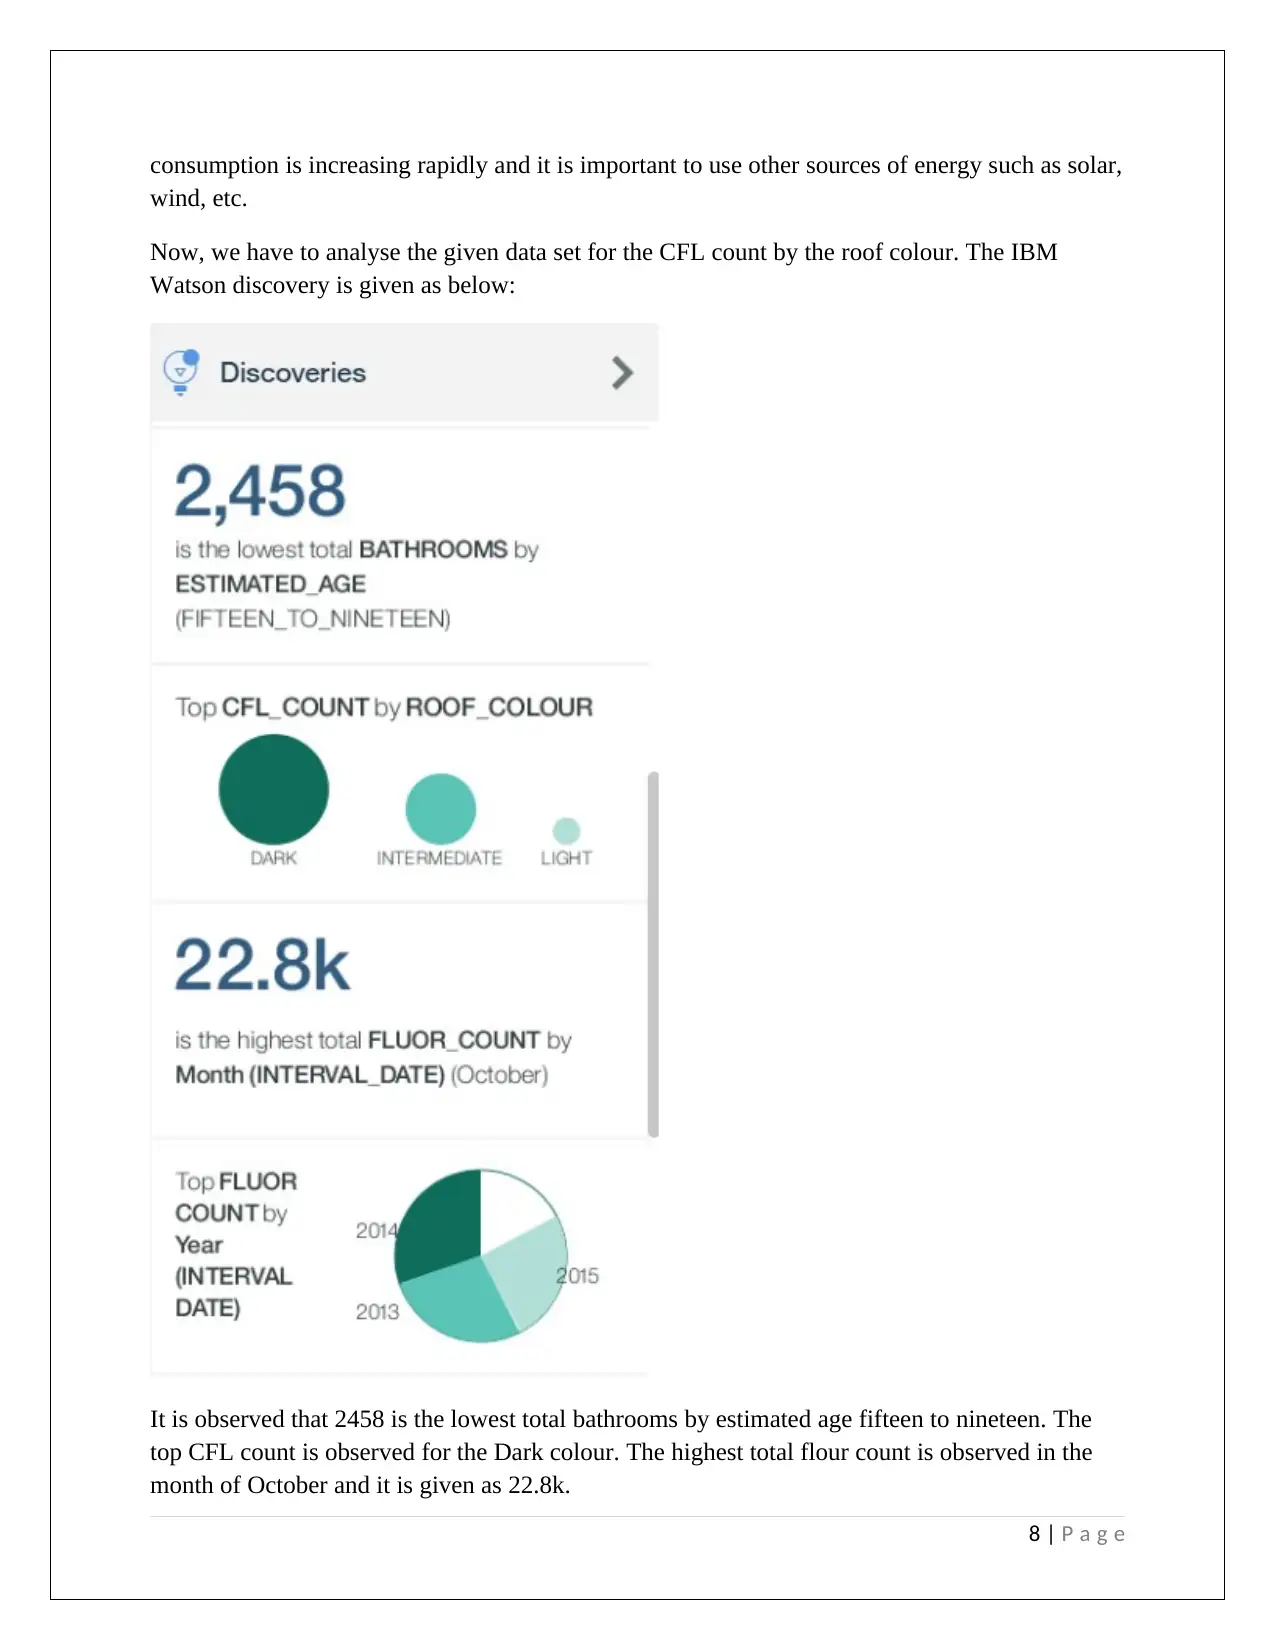
Now, we have to analyse the given data set for the CFL count by the roof colour. The IBM
Watson discovery is given as below:
It is observed that 2458 is the lowest total bathrooms by estimated age fifteen to nineteen. The
top CFL count is observed for the Dark colour. The highest total flour count is observed in the
month of October and it is given as 22.8k.
8 | P a g e
wind, etc.
Now, we have to analyse the given data set for the CFL count by the roof colour. The IBM
Watson discovery is given as below:
It is observed that 2458 is the lowest total bathrooms by estimated age fifteen to nineteen. The
top CFL count is observed for the Dark colour. The highest total flour count is observed in the
month of October and it is given as 22.8k.
8 | P a g e
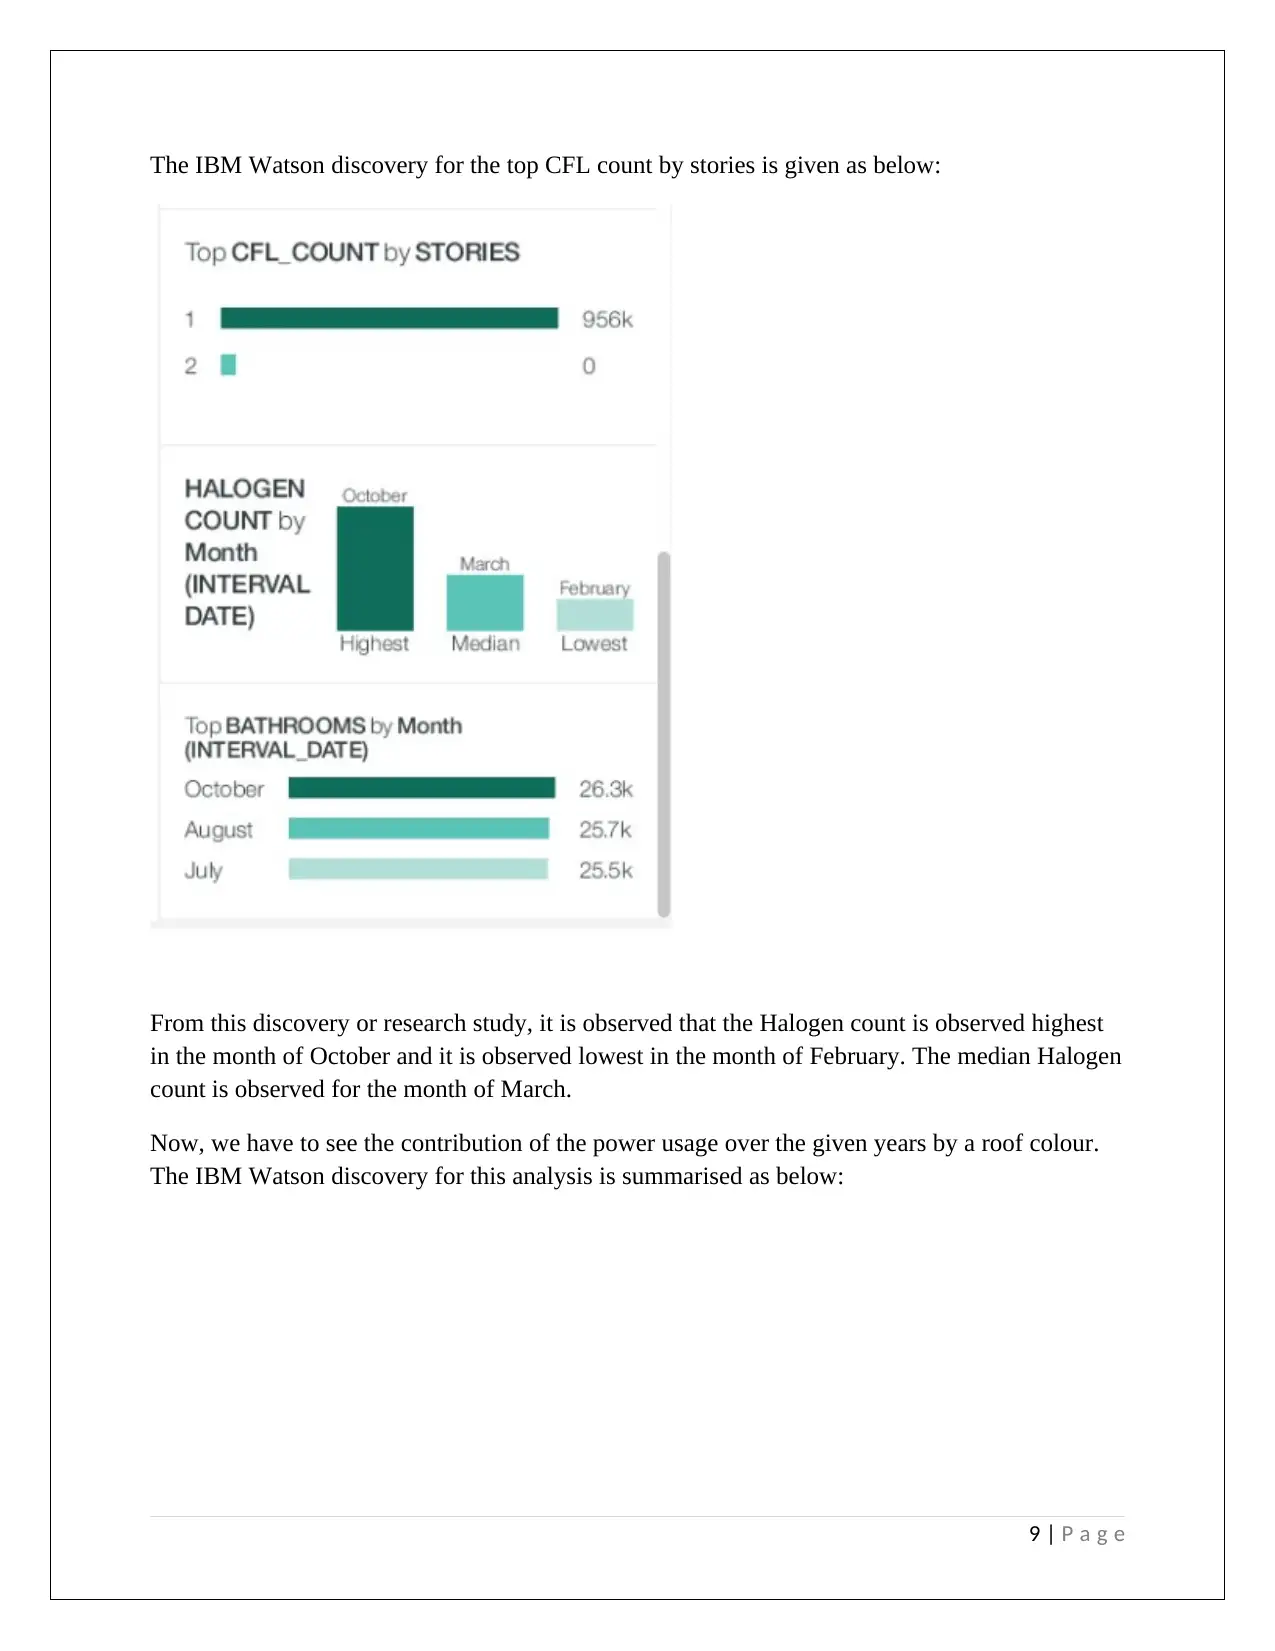
The IBM Watson discovery for the top CFL count by stories is given as below:
From this discovery or research study, it is observed that the Halogen count is observed highest
in the month of October and it is observed lowest in the month of February. The median Halogen
count is observed for the month of March.
Now, we have to see the contribution of the power usage over the given years by a roof colour.
The IBM Watson discovery for this analysis is summarised as below:
9 | P a g e
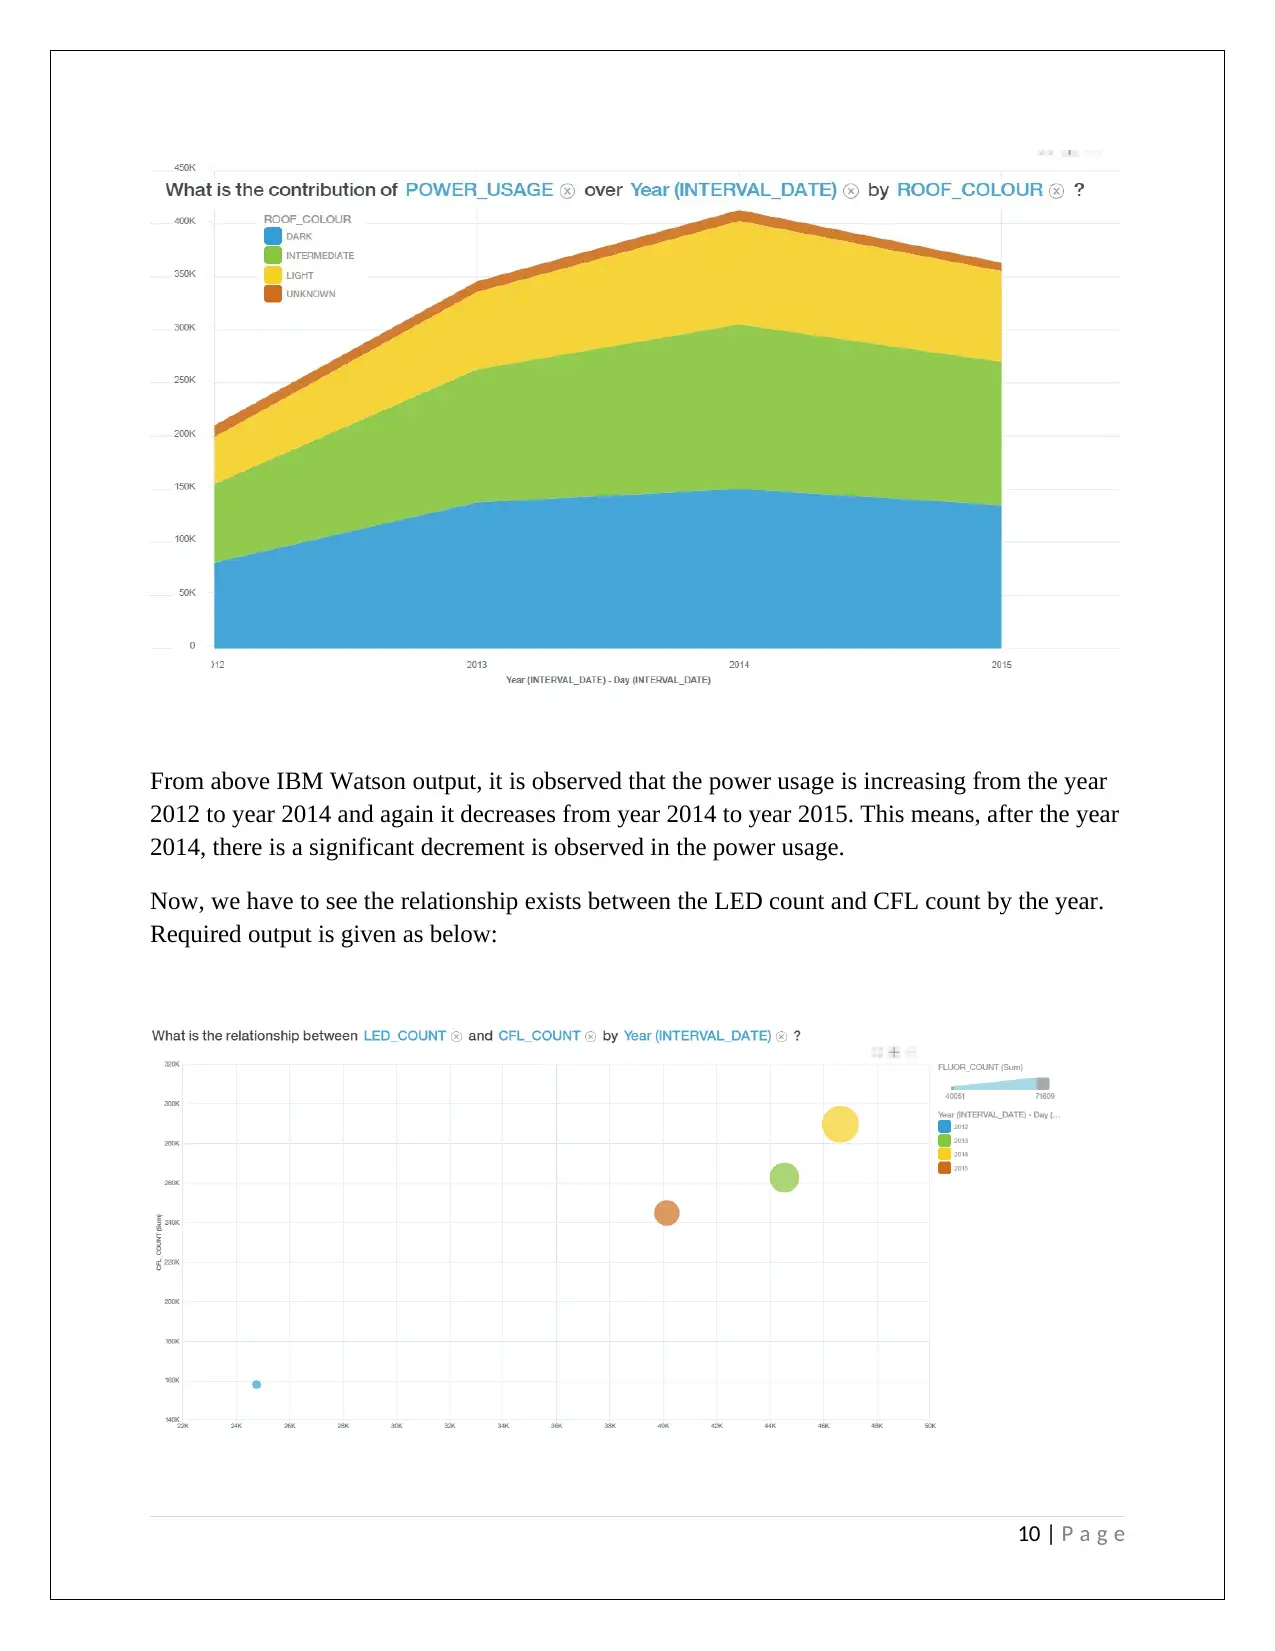
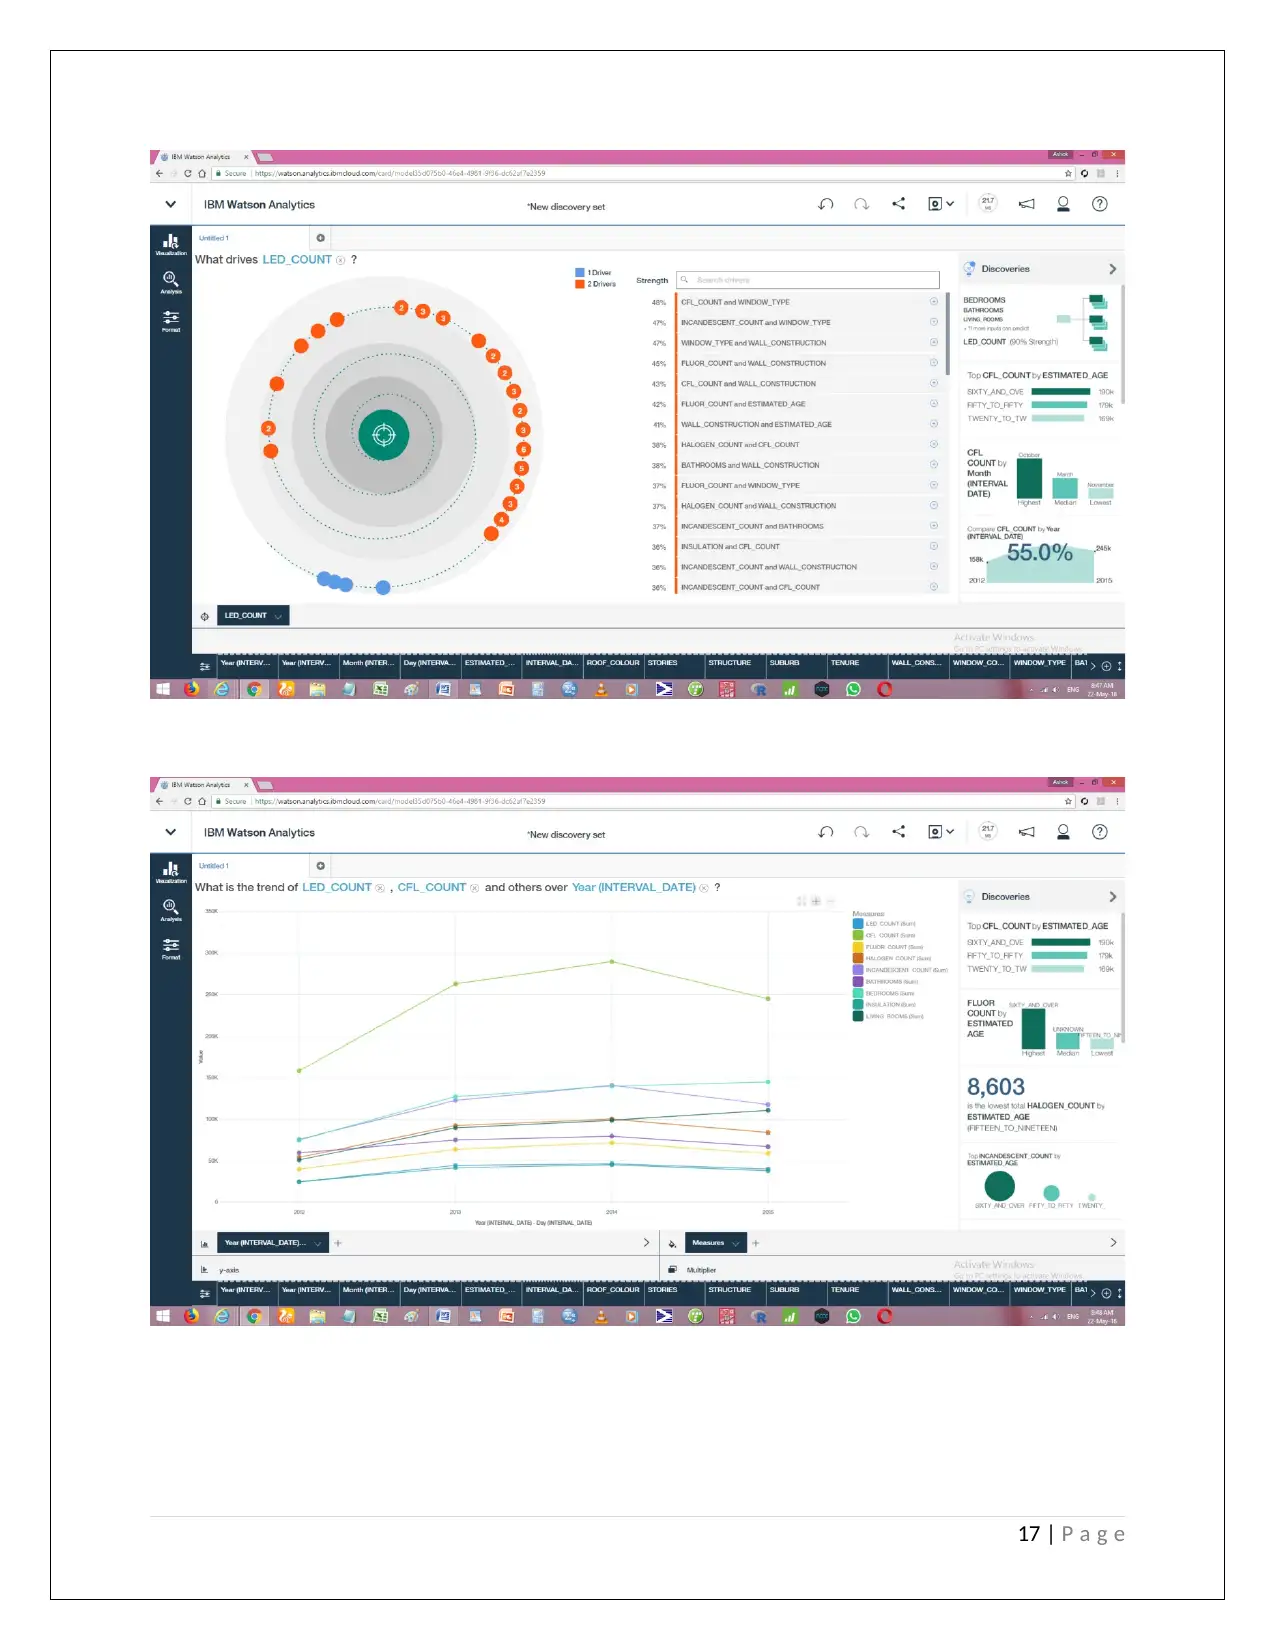
From above IBM Watson output, it is observed that the power usage is increasing from the year
2012 to year 2014 and again it decreases from year 2014 to year 2015. This means, after the year
2014, there is a significant decrement is observed in the power usage.
Now, we have to see the relationship exists between the LED count and CFL count by the year.
Required output is given as below:
10 | P a g e
Secure Best Marks with AI Grader
Need help grading? Try our AI Grader for instant feedback on your assignments.
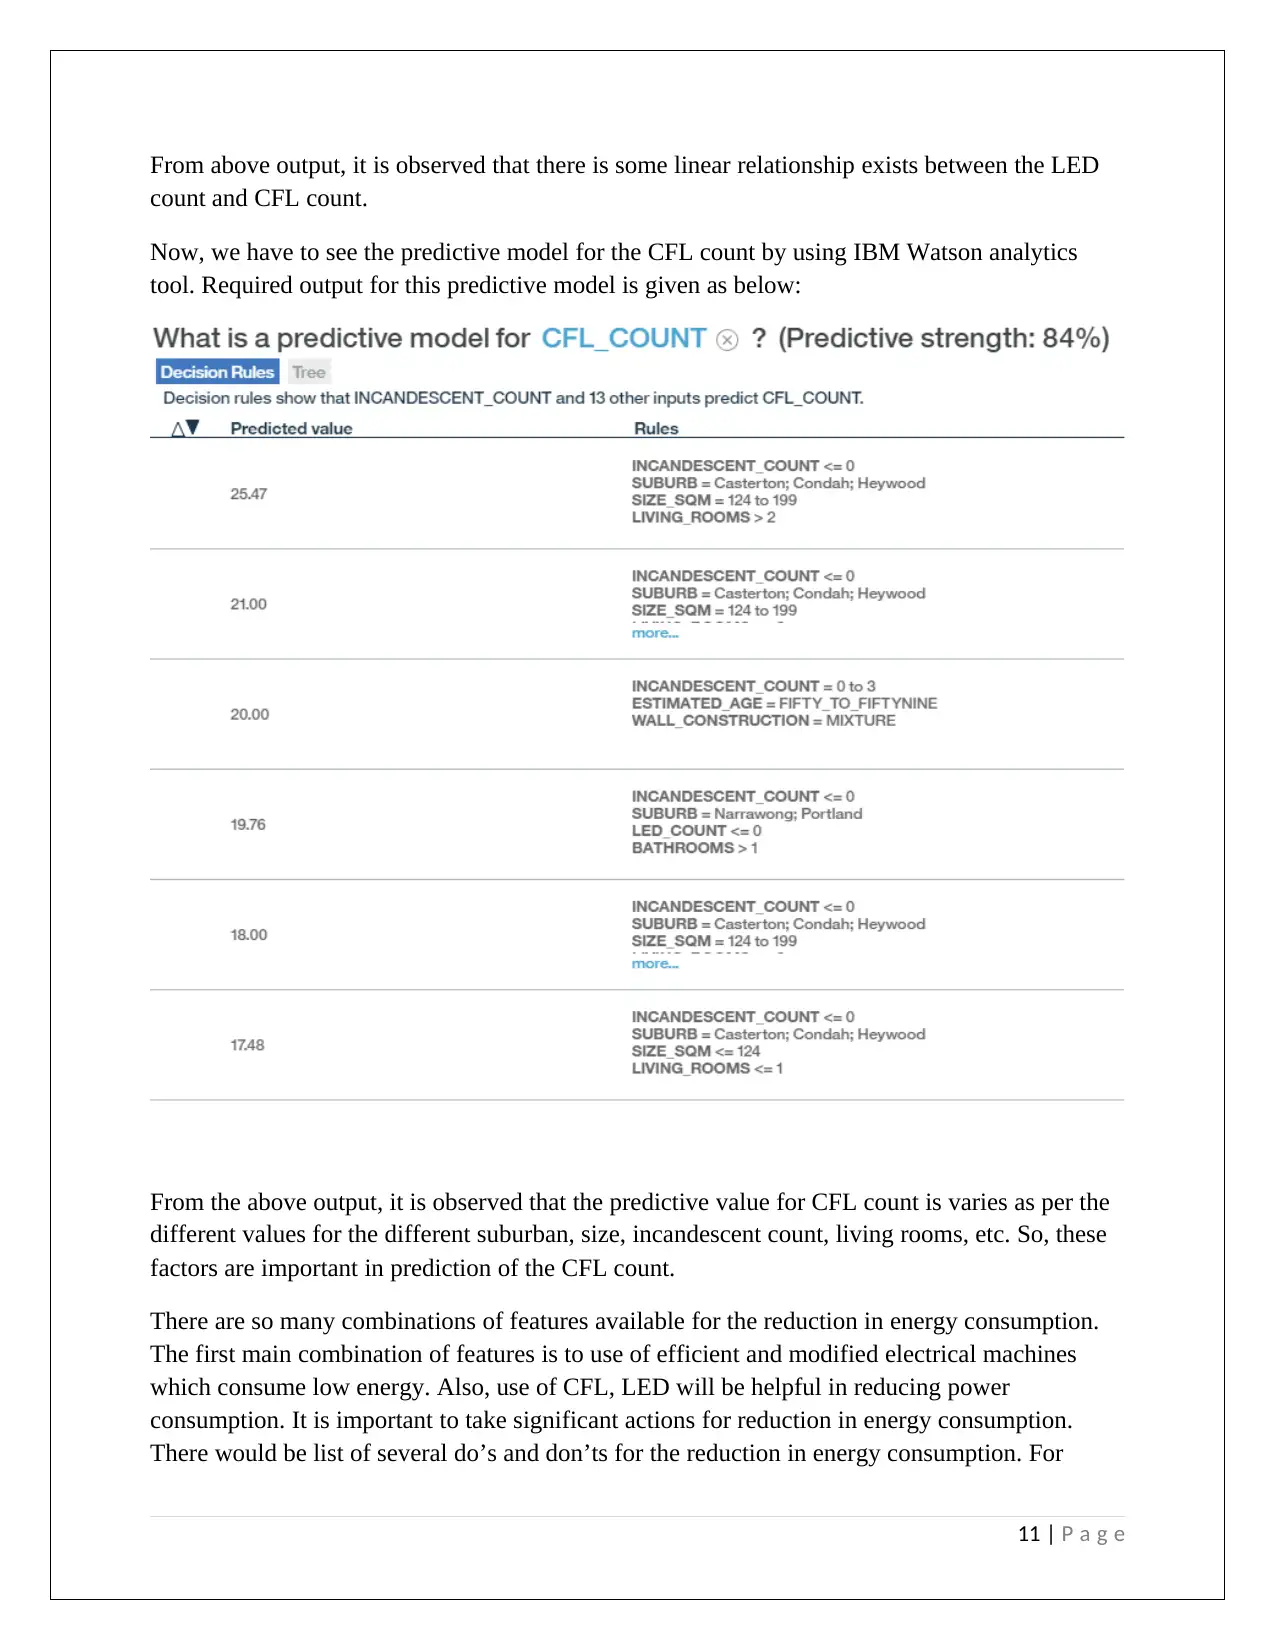
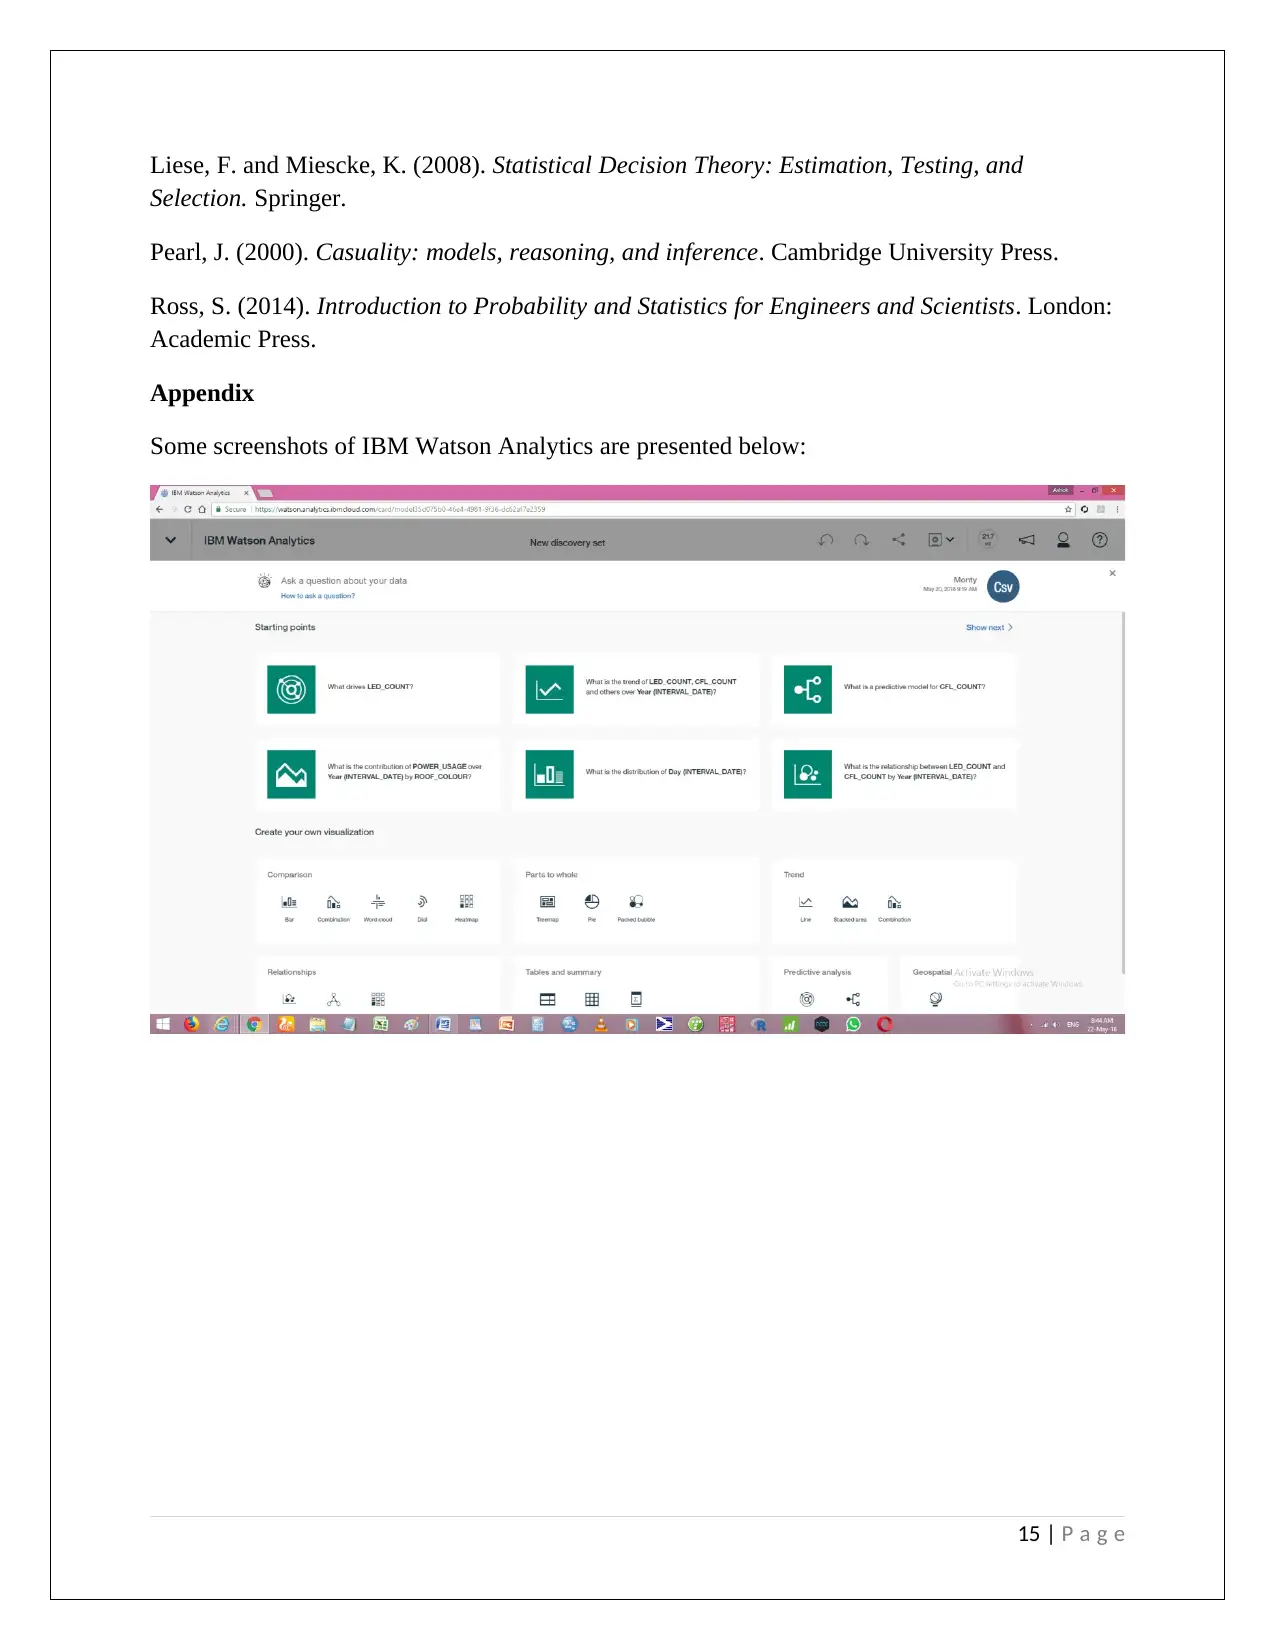
From above output, it is observed that there is some linear relationship exists between the LED
count and CFL count.
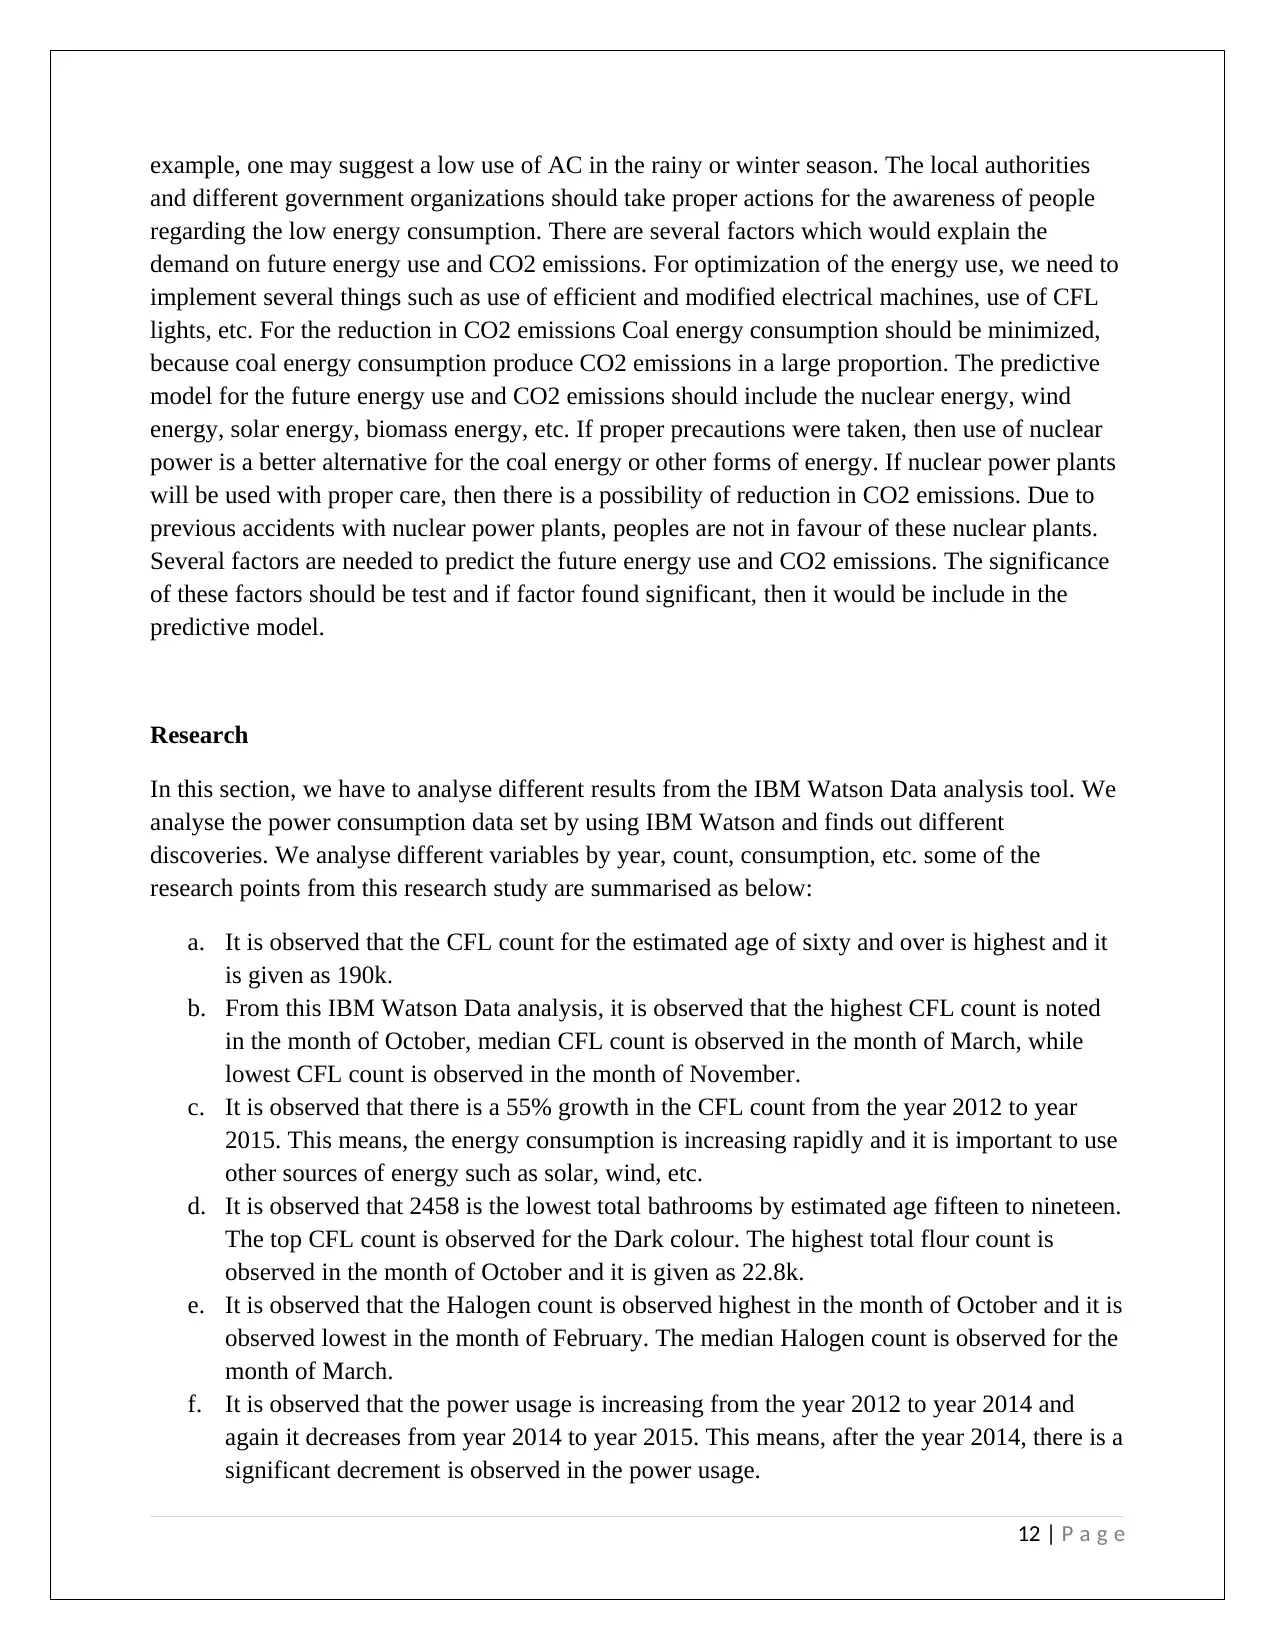
Now, we have to see the predictive model for the CFL count by using IBM Watson analytics
tool. Required output for this predictive model is given as below:
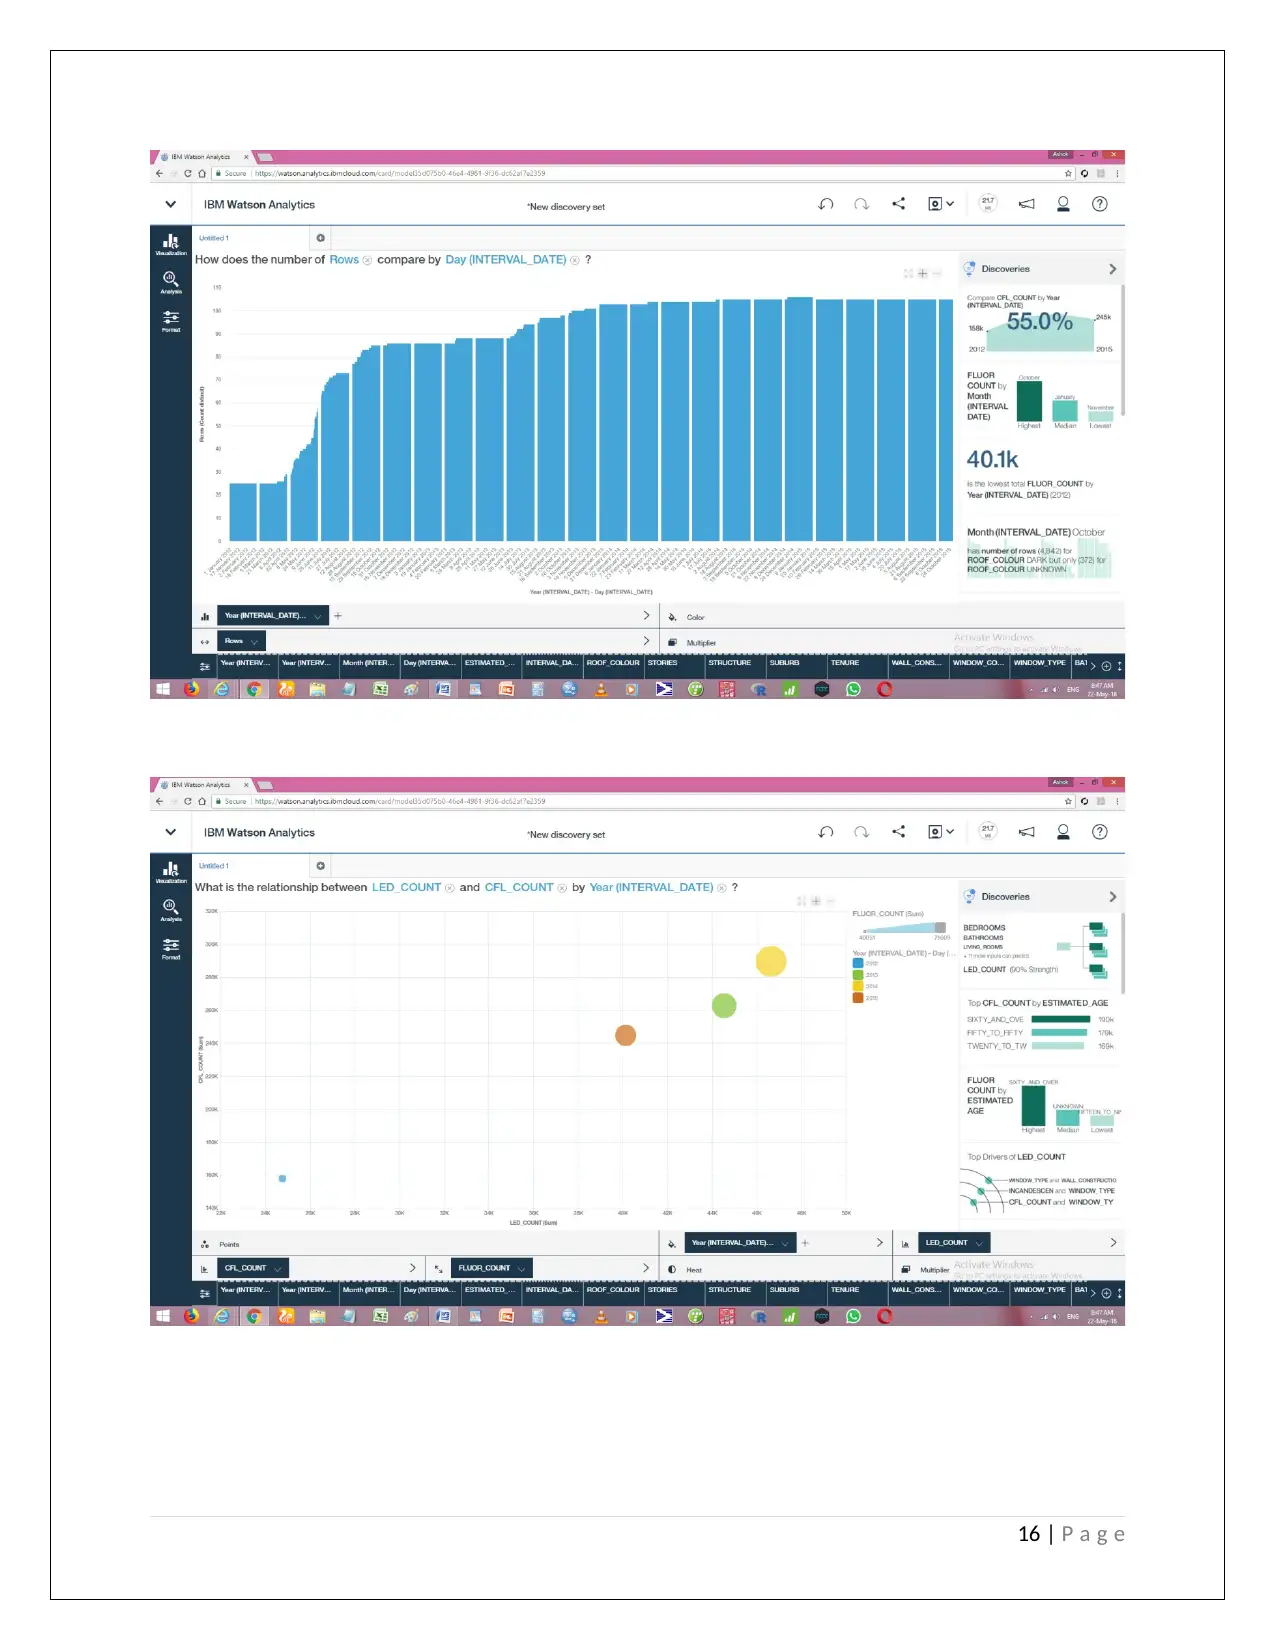
From the above output, it is observed that the predictive value for CFL count is varies as per the
different values for the different suburban, size, incandescent count, living rooms, etc. So, these
factors are important in prediction of the CFL count.
There are so many combinations of features available for the reduction in energy consumption.
The first main combination of features is to use of efficient and modified electrical machines
which consume low energy. Also, use of CFL, LED will be helpful in reducing power
consumption. It is important to take significant actions for reduction in energy consumption.
There would be list of several do’s and don’ts for the reduction in energy consumption. For
11 | P a g e
count and CFL count.
Now, we have to see the predictive model for the CFL count by using IBM Watson analytics
tool. Required output for this predictive model is given as below:
From the above output, it is observed that the predictive value for CFL count is varies as per the
different values for the different suburban, size, incandescent count, living rooms, etc. So, these
factors are important in prediction of the CFL count.
There are so many combinations of features available for the reduction in energy consumption.
The first main combination of features is to use of efficient and modified electrical machines
which consume low energy. Also, use of CFL, LED will be helpful in reducing power
consumption. It is important to take significant actions for reduction in energy consumption.
There would be list of several do’s and don’ts for the reduction in energy consumption. For
11 | P a g e
example, one may suggest a low use of AC in the rainy or winter season. The local authorities
and different government organizations should take proper actions for the awareness of people
regarding the low energy consumption. There are several factors which would explain the
demand on future energy use and CO2 emissions. For optimization of the energy use, we need to
implement several things such as use of efficient and modified electrical machines, use of CFL
lights, etc. For the reduction in CO2 emissions Coal energy consumption should be minimized,
because coal energy consumption produce CO2 emissions in a large proportion. The predictive
model for the future energy use and CO2 emissions should include the nuclear energy, wind
energy, solar energy, biomass energy, etc. If proper precautions were taken, then use of nuclear
power is a better alternative for the coal energy or other forms of energy. If nuclear power plants
will be used with proper care, then there is a possibility of reduction in CO2 emissions. Due to
previous accidents with nuclear power plants, peoples are not in favour of these nuclear plants.
Several factors are needed to predict the future energy use and CO2 emissions. The significance
of these factors should be test and if factor found significant, then it would be include in the
predictive model.
Research
In this section, we have to analyse different results from the IBM Watson Data analysis tool. We
analyse the power consumption data set by using IBM Watson and finds out different
discoveries. We analyse different variables by year, count, consumption, etc. some of the
research points from this research study are summarised as below:
a. It is observed that the CFL count for the estimated age of sixty and over is highest and it
is given as 190k.
b. From this IBM Watson Data analysis, it is observed that the highest CFL count is noted
in the month of October, median CFL count is observed in the month of March, while
lowest CFL count is observed in the month of November.
c. It is observed that there is a 55% growth in the CFL count from the year 2012 to year
2015. This means, the energy consumption is increasing rapidly and it is important to use
other sources of energy such as solar, wind, etc.
d. It is observed that 2458 is the lowest total bathrooms by estimated age fifteen to nineteen.
The top CFL count is observed for the Dark colour. The highest total flour count is
observed in the month of October and it is given as 22.8k.
e. It is observed that the Halogen count is observed highest in the month of October and it is
observed lowest in the month of February. The median Halogen count is observed for the
month of March.
f. It is observed that the power usage is increasing from the year 2012 to year 2014 and
again it decreases from year 2014 to year 2015. This means, after the year 2014, there is a
significant decrement is observed in the power usage.
12 | P a g e
g. It is observed that there is some linear relationship exists between the LED count and
CFL count.
h. It is observed that the predictive value for CFL count is varies as per the different values
for the different suburban, size, incandescent count, living rooms, etc.
Recommendations
From this research study, most important recommendations are summarised as below:
A. The use of energy is increasing day by day and therefore it is important to start use of
alternative energy sources such as solar energy, wind energy, etc.
B. Coal energy consumption should be minimized for avoidance of CO2 emissions.
C. Power consumption would be minimized by using instruments with less energy
consumption such as CFL, LED, etc.
D. Most of the electrical instruments should be optimized for energy use.
E. Some changes in infrastructure would help in minimizing power consumption.
Reflection
From this research study for the big data set, it is reflected that the use of energy is increasing
continuously and also demand for energy use is continuously increasing. For overcoming these
increasing demands of energy, it is required to use some other sources of energy such as solar
energy, wind energy, etc. These alternative sources of energy will help in reduction in the
environmental pollution. The level of CO2 emissions will be decreasing if we use eco-friendly
sources of energy. Also, we can reduce the energy use by improving electrical instruments. Now
a day there is tremendous changes in the electrical gadgets and instruments and these instruments
are working on low energy. From this study, it is reflected that the CFL count for the estimated
age of sixty and over is highest and it is given as 190k. Also, it is reflected that the highest CFL
count is noted in the month of October, median CFL count is observed in the month of March,
while lowest CFL count is observed in the month of November. It is observed that there is a 55%
growth in the CFL count from the year 2012 to year 2015. This means, the energy consumption
is increasing rapidly and it is important to use other sources of energy such as solar, wind, etc.
Which combinations of features highlight where efficiencies could be made in the reduction
in energy consumption?
Answer:
There are so many combinations of features available for the reduction in energy consumption.
The first main combination of features is to use of efficient and modified electrical machines
which consume low energy. Also, use of CFL, LED will be helpful in reducing power
consumption. It is important to take significant actions for reduction in energy consumption.
13 | P a g e
Paraphrase This Document
Need a fresh take? Get an instant paraphrase of this document with our AI Paraphraser
There would be list of several do’s and don’ts for the reduction in energy consumption. For
example, one may suggest a low use of AC in the rainy or winter season. The local authorities
and different government organizations should take proper actions for the awareness of people
regarding the low energy consumption.
What would you include in a predictive model that would explain the demand on future
energy use and CO2 emissions?
Answers:
There are several factors which would explain the demand on future energy use and CO2
emissions. For optimization of the energy use, we need to implement several things such as use
of efficient and modified electrical machines, use of CFL lights, etc. For the reduction in CO2
emissions Coal energy consumption should be minimized, because coal energy consumption
produce CO2 emissions in a large proportion. The predictive model for the future energy use and
CO2 emissions should include the nuclear energy, wind energy, solar energy, biomass energy,
etc. If proper precautions were taken, then use of nuclear power is a better alternative for the coal
energy or other forms of energy. If nuclear power plants will be used with proper care, then there
is a possibility of reduction in CO2 emissions. Due to previous accidents with nuclear power
plants, peoples are not in favour of these nuclear plants. Several factors are needed to predict the
future energy use and CO2 emissions. The significance of these factors should be test and if
factor found significant, then it would be include in the predictive model.
References
Casella, G. and Berger, R. L. (2002). Statistical Inference. Duxbury Press.
Cox, D. R. and Hinkley, D. V. (2000). Theoretical Statistics. Chapman and Hall Ltd.
Degroot, M. and Schervish, M. (2002). Probability and Statistics. Addison - Wesley.
Dobson, A. J. (2001). An introduction to generalized linear models. Chapman and Hall Ltd.
Evans, M. (2004). Probability and Statistics: The Science of Uncertainty. Freeman and
Company.
Hastle, T., Tibshirani, R. and Friedman, J. H. (2001). The elements of statistical learning: data
mining, inference, and prediction: with 200 full-color illustrations. Springer - Verlag Inc.
Hogg, R., Craig, A., and McKean, J. (2004). An Introduction to Mathematical Statistics.
Prentice Hall.
14 | P a g e
Liese, F. and Miescke, K. (2008). Statistical Decision Theory: Estimation, Testing, and
Selection. Springer.
Pearl, J. (2000). Casuality: models, reasoning, and inference. Cambridge University Press.
Ross, S. (2014). Introduction to Probability and Statistics for Engineers and Scientists. London:
Academic Press.
Appendix
Some screenshots of IBM Watson Analytics are presented below:
15 | P a g e
16 | P a g e
Secure Best Marks with AI Grader
Need help grading? Try our AI Grader for instant feedback on your assignments.
17 | P a g e

18 | P a g e
1 out of 18


Your All-in-One AI-Powered Toolkit for Academic Success.
+13062052269
info@desklib.com
Available 24*7 on WhatsApp / Email
![[object Object]](/_next/static/media/star-bottom.7253800d.svg)
Unlock your academic potential
© 2024 | Zucol Services PVT LTD | All rights reserved.