Staff Employment Analysis at a University
VerifiedAdded on 2020/03/04
|18
|1606
|65
AI Summary
This assignment focuses on analyzing staff employment data within a university setting. It involves creating visual representations (pie charts) to illustrate the distribution of staff members based on their length of employment across different colleges (Business, Law & Governance; Health Sciences; Medicine & Dentistry; Marine & Environment; Public Health, Medical & Veterinary). Additionally, the analysis compares the employment patterns of male and female staff. The assignment concludes by generating bar charts depicting modes of transportation used by staff.
Contribute Materials
Your contribution can guide someone’s learning journey. Share your
documents today.
Data analysis 1
Title
Student’s name
Professor
Course title
Date
Vice chancellor’s report on equality at James Cook University
Title
Student’s name
Professor
Course title
Date
Vice chancellor’s report on equality at James Cook University
Secure Best Marks with AI Grader
Need help grading? Try our AI Grader for instant feedback on your assignments.
Data analysis 2
Table of content Page
1.0 Data analysis and results 3
1.1 Descriptive statistics for salary 3
1.2 Coefficient of variation 4
2.0 Correlation analysis 5
2.1 Scatter plot for salary and age 6
3.0 Workers’ salary and age 6
4.0 Contingency table 9
5.0 Pie chart for length of employment 11
6.0 Bar graphs on modes of transport 17
7.0 References 18
Data analysis 3
1.0 Data analysis and results
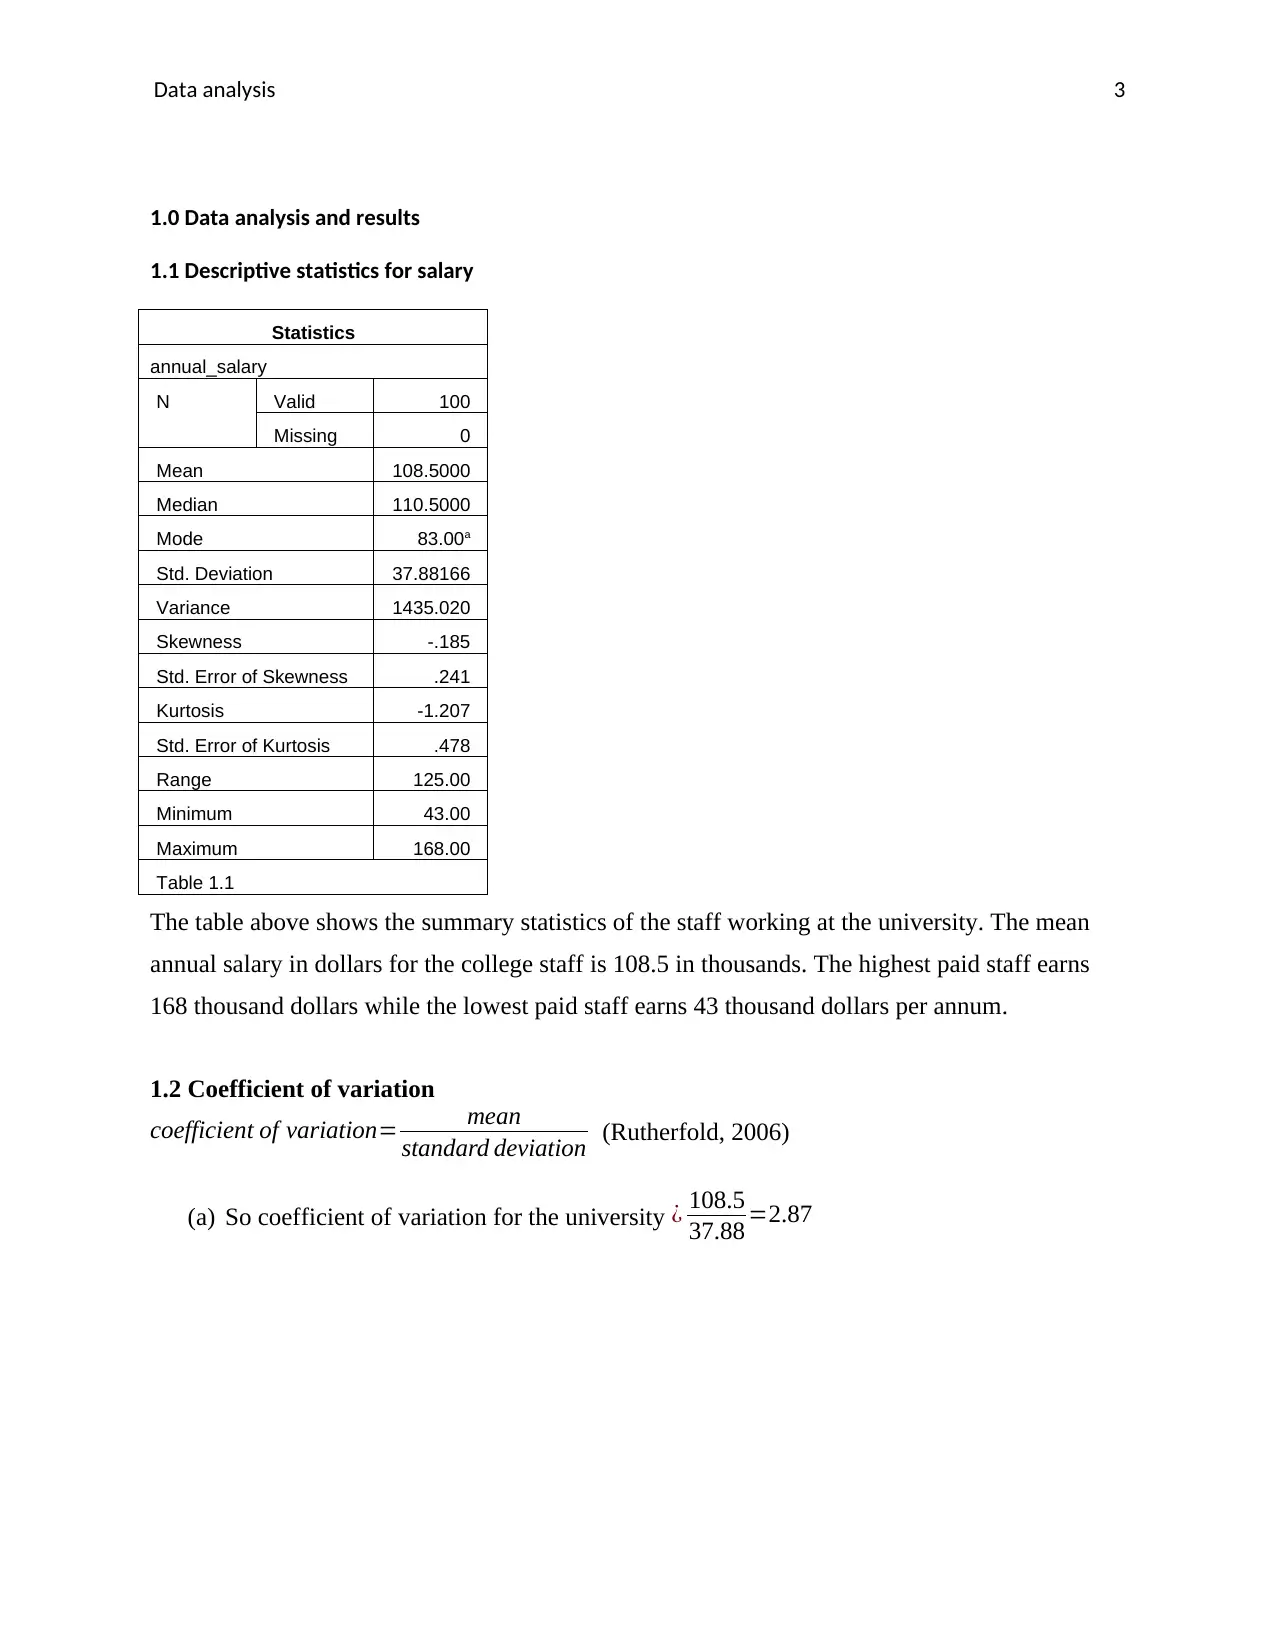
1.1 Descriptive statistics for salary
Statistics
annual_salary
N Valid 100
Missing 0
Mean 108.5000
Median 110.5000
Mode 83.00a
Std. Deviation 37.88166
Variance 1435.020
Skewness -.185
Std. Error of Skewness .241
Kurtosis -1.207
Std. Error of Kurtosis .478
Range 125.00
Minimum 43.00
Maximum 168.00
Table 1.1
The table above shows the summary statistics of the staff working at the university. The mean
annual salary in dollars for the college staff is 108.5 in thousands. The highest paid staff earns
168 thousand dollars while the lowest paid staff earns 43 thousand dollars per annum.
1.2 Coefficient of variation
coefficient of variation= mean
standard deviation (Rutherfold, 2006)
(a) So coefficient of variation for the university ¿ 108.5
37.88 =2.87
1.0 Data analysis and results
1.1 Descriptive statistics for salary
Statistics
annual_salary
N Valid 100
Missing 0
Mean 108.5000
Median 110.5000
Mode 83.00a
Std. Deviation 37.88166
Variance 1435.020
Skewness -.185
Std. Error of Skewness .241
Kurtosis -1.207
Std. Error of Kurtosis .478
Range 125.00
Minimum 43.00
Maximum 168.00
Table 1.1
The table above shows the summary statistics of the staff working at the university. The mean
annual salary in dollars for the college staff is 108.5 in thousands. The highest paid staff earns
168 thousand dollars while the lowest paid staff earns 43 thousand dollars per annum.
1.2 Coefficient of variation
coefficient of variation= mean
standard deviation (Rutherfold, 2006)
(a) So coefficient of variation for the university ¿ 108.5
37.88 =2.87
Data analysis 4
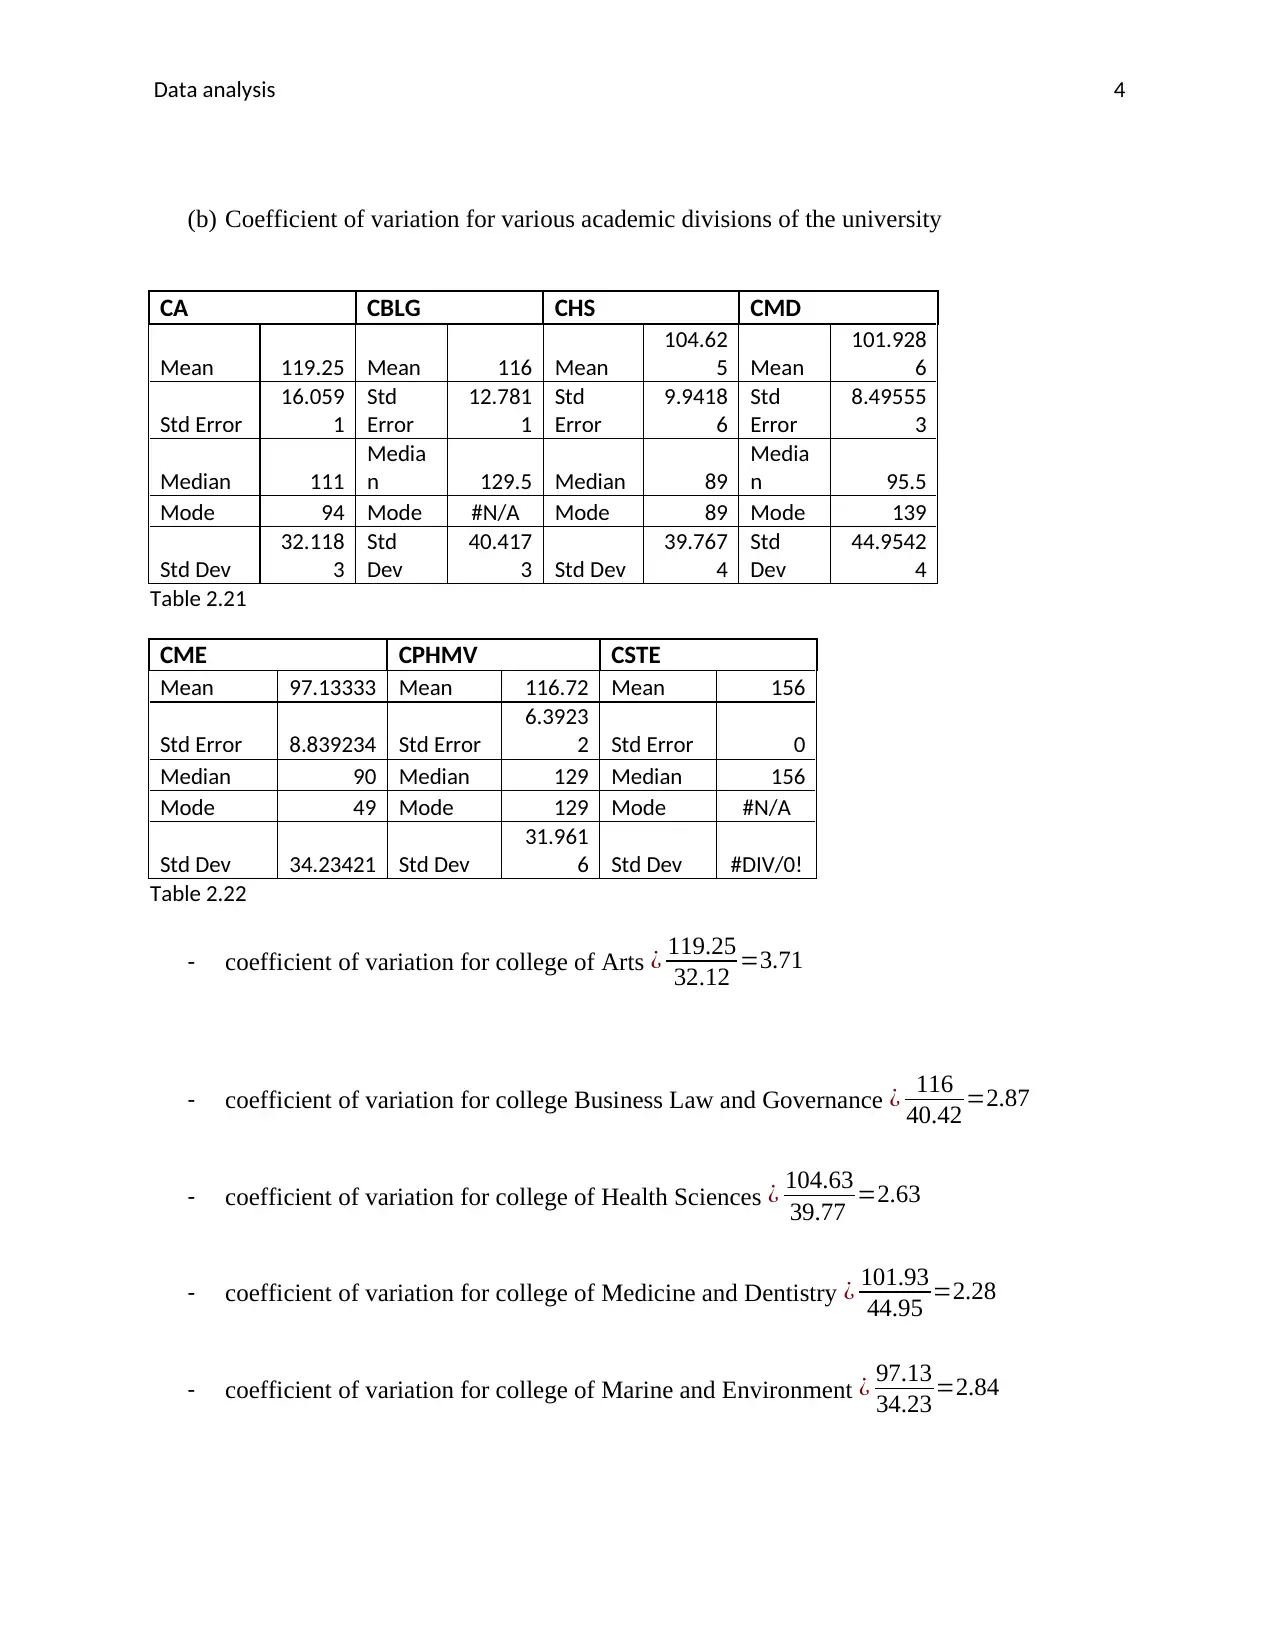
(b) Coefficient of variation for various academic divisions of the university
CA CBLG CHS CMD
Mean 119.25 Mean 116 Mean
104.62
5 Mean
101.928
6
Std Error
16.059
1
Std
Error
12.781
1
Std
Error
9.9418
6
Std
Error
8.49555
3
Median 111
Media
n 129.5 Median 89
Media
n 95.5
Mode 94 Mode #N/A Mode 89 Mode 139
Std Dev
32.118
3
Std
Dev
40.417
3 Std Dev
39.767
4
Std
Dev
44.9542
4
Table 2.21
CME CPHMV CSTE
Mean 97.13333 Mean 116.72 Mean 156
Std Error 8.839234 Std Error
6.3923
2 Std Error 0
Median 90 Median 129 Median 156
Mode 49 Mode 129 Mode #N/A
Std Dev 34.23421 Std Dev
31.961
6 Std Dev #DIV/0!
Table 2.22
- coefficient of variation for college of Arts ¿ 119.25
32.12 =3.71
- coefficient of variation for college Business Law and Governance ¿ 116
40.42 =2.87
- coefficient of variation for college of Health Sciences ¿ 104.63
39.77 =2.63
- coefficient of variation for college of Medicine and Dentistry ¿ 101.93
44.95 =2.28
- coefficient of variation for college of Marine and Environment ¿ 97.13
34.23 =2.84
Secure Best Marks with AI Grader
Need help grading? Try our AI Grader for instant feedback on your assignments.
Data analysis 5
- coefficient of variation for college of Public Health, Medical & Veterinary
¿ 116.72
31.96 =3.65
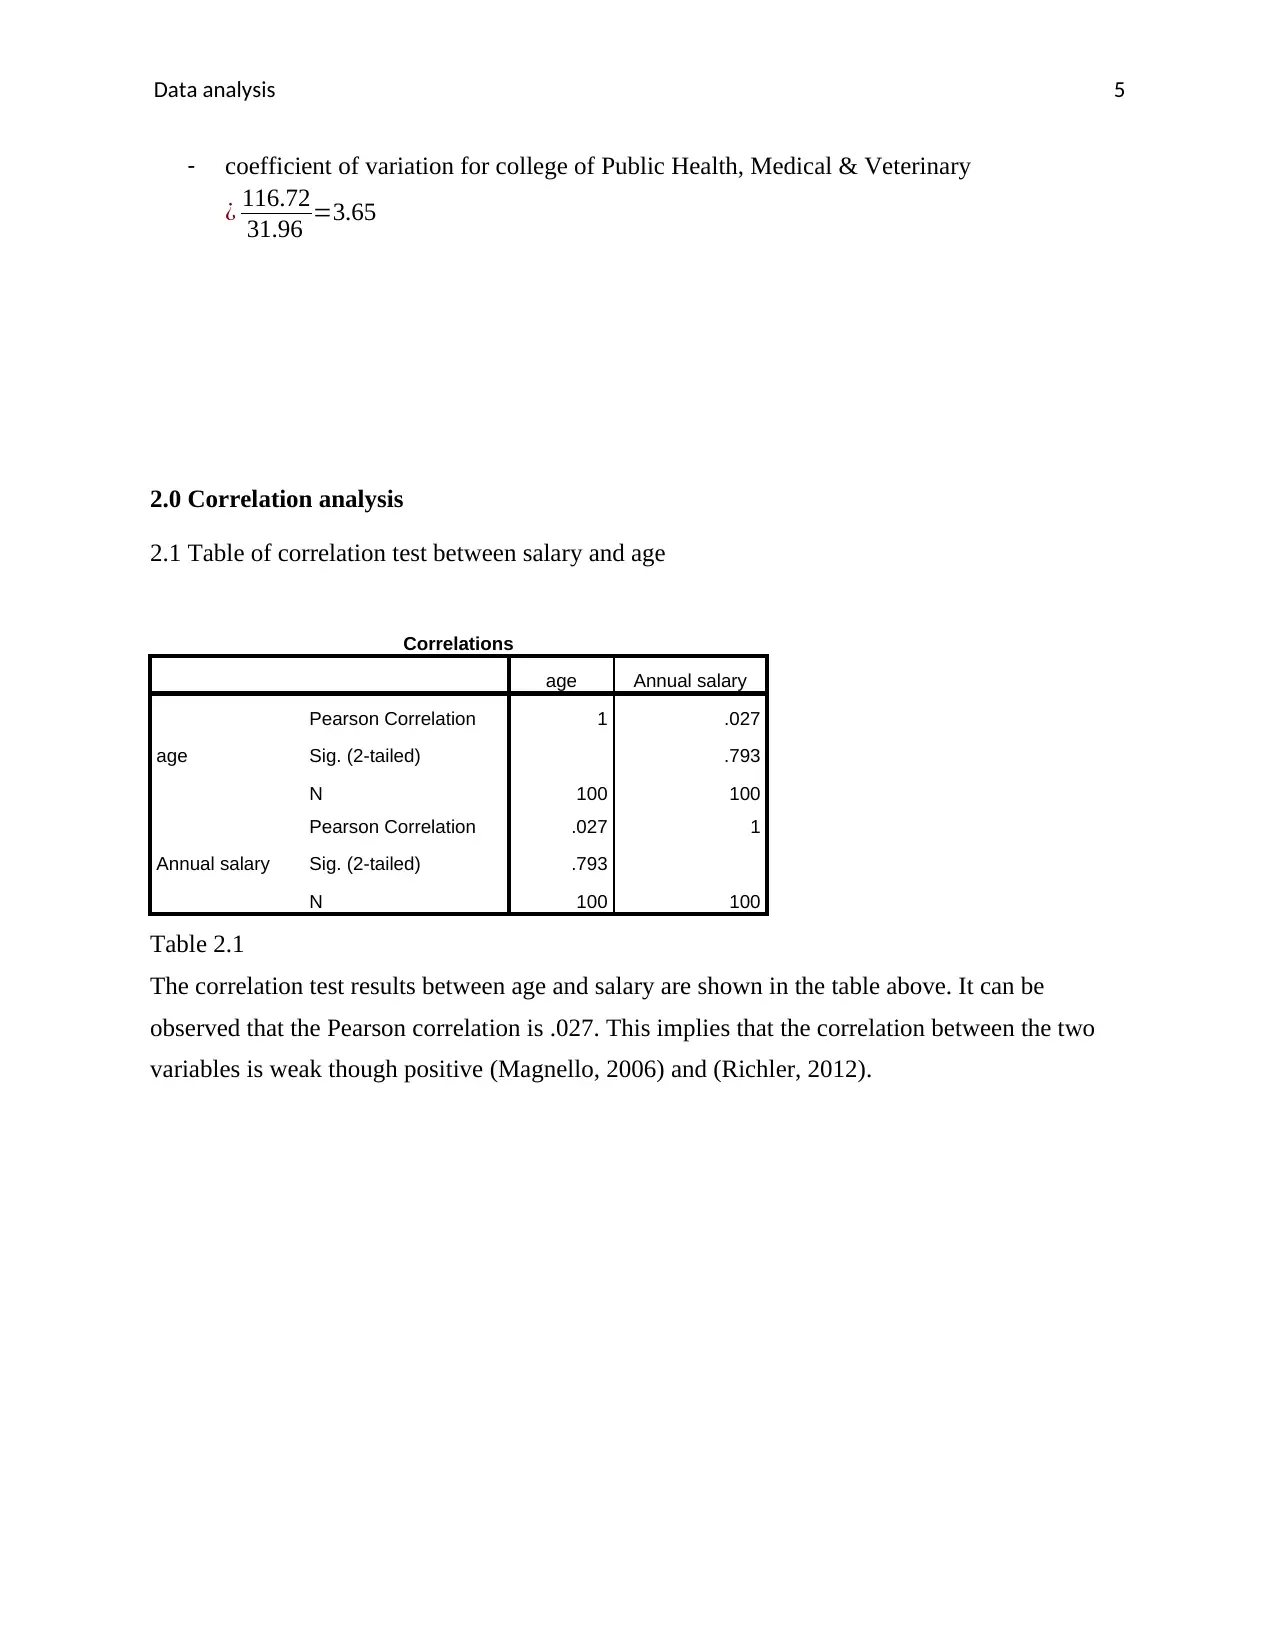
2.0 Correlation analysis
2.1 Table of correlation test between salary and age
Correlations
age Annual salary
age
Pearson Correlation 1 .027
Sig. (2-tailed) .793
N 100 100
Annual salary
Pearson Correlation .027 1
Sig. (2-tailed) .793
N 100 100
Table 2.1
The correlation test results between age and salary are shown in the table above. It can be
observed that the Pearson correlation is .027. This implies that the correlation between the two
variables is weak though positive (Magnello, 2006) and (Richler, 2012).
- coefficient of variation for college of Public Health, Medical & Veterinary
¿ 116.72
31.96 =3.65
2.0 Correlation analysis
2.1 Table of correlation test between salary and age
Correlations
age Annual salary
age
Pearson Correlation 1 .027
Sig. (2-tailed) .793
N 100 100
Annual salary
Pearson Correlation .027 1
Sig. (2-tailed) .793
N 100 100
Table 2.1
The correlation test results between age and salary are shown in the table above. It can be
observed that the Pearson correlation is .027. This implies that the correlation between the two
variables is weak though positive (Magnello, 2006) and (Richler, 2012).
Data analysis 6
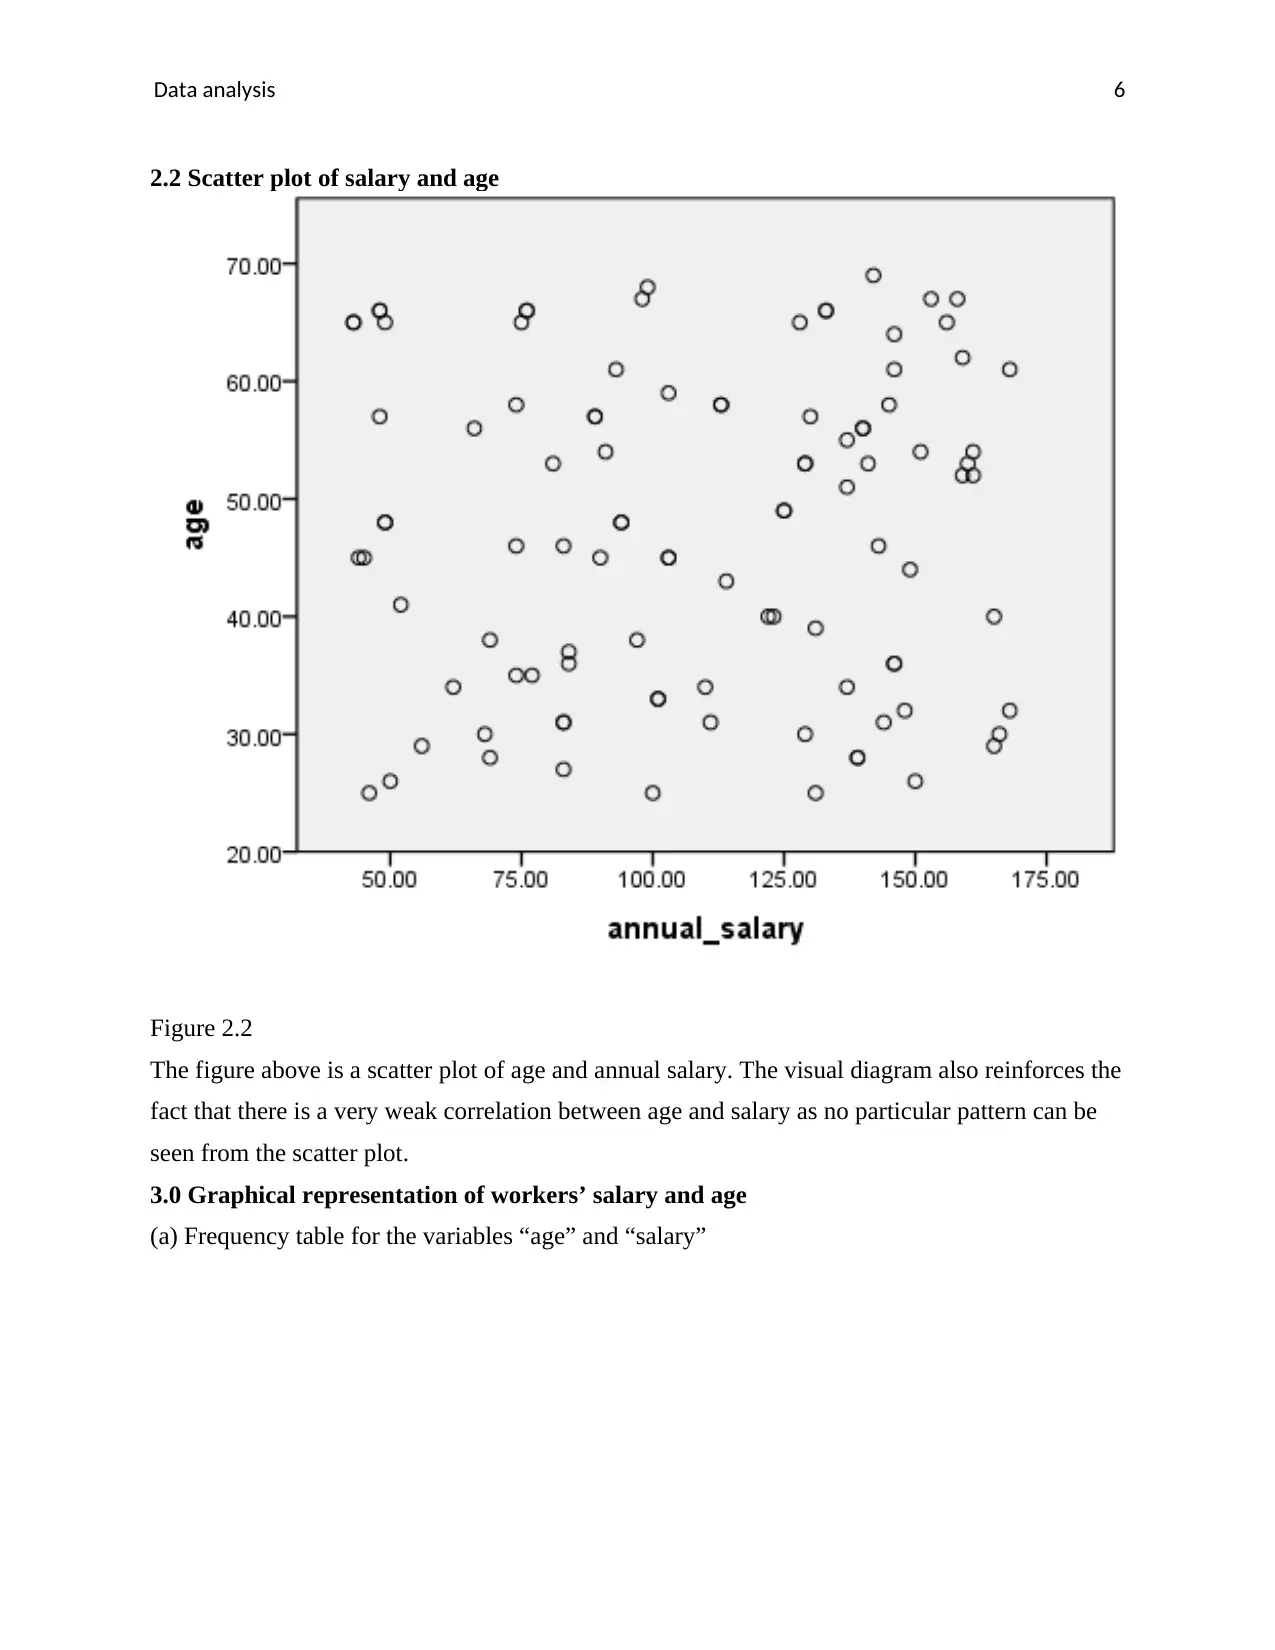
2.2 Scatter plot of salary and age
Figure 2.2
The figure above is a scatter plot of age and annual salary. The visual diagram also reinforces the
fact that there is a very weak correlation between age and salary as no particular pattern can be
seen from the scatter plot.
3.0 Graphical representation of workers’ salary and age
(a) Frequency table for the variables “age” and “salary”
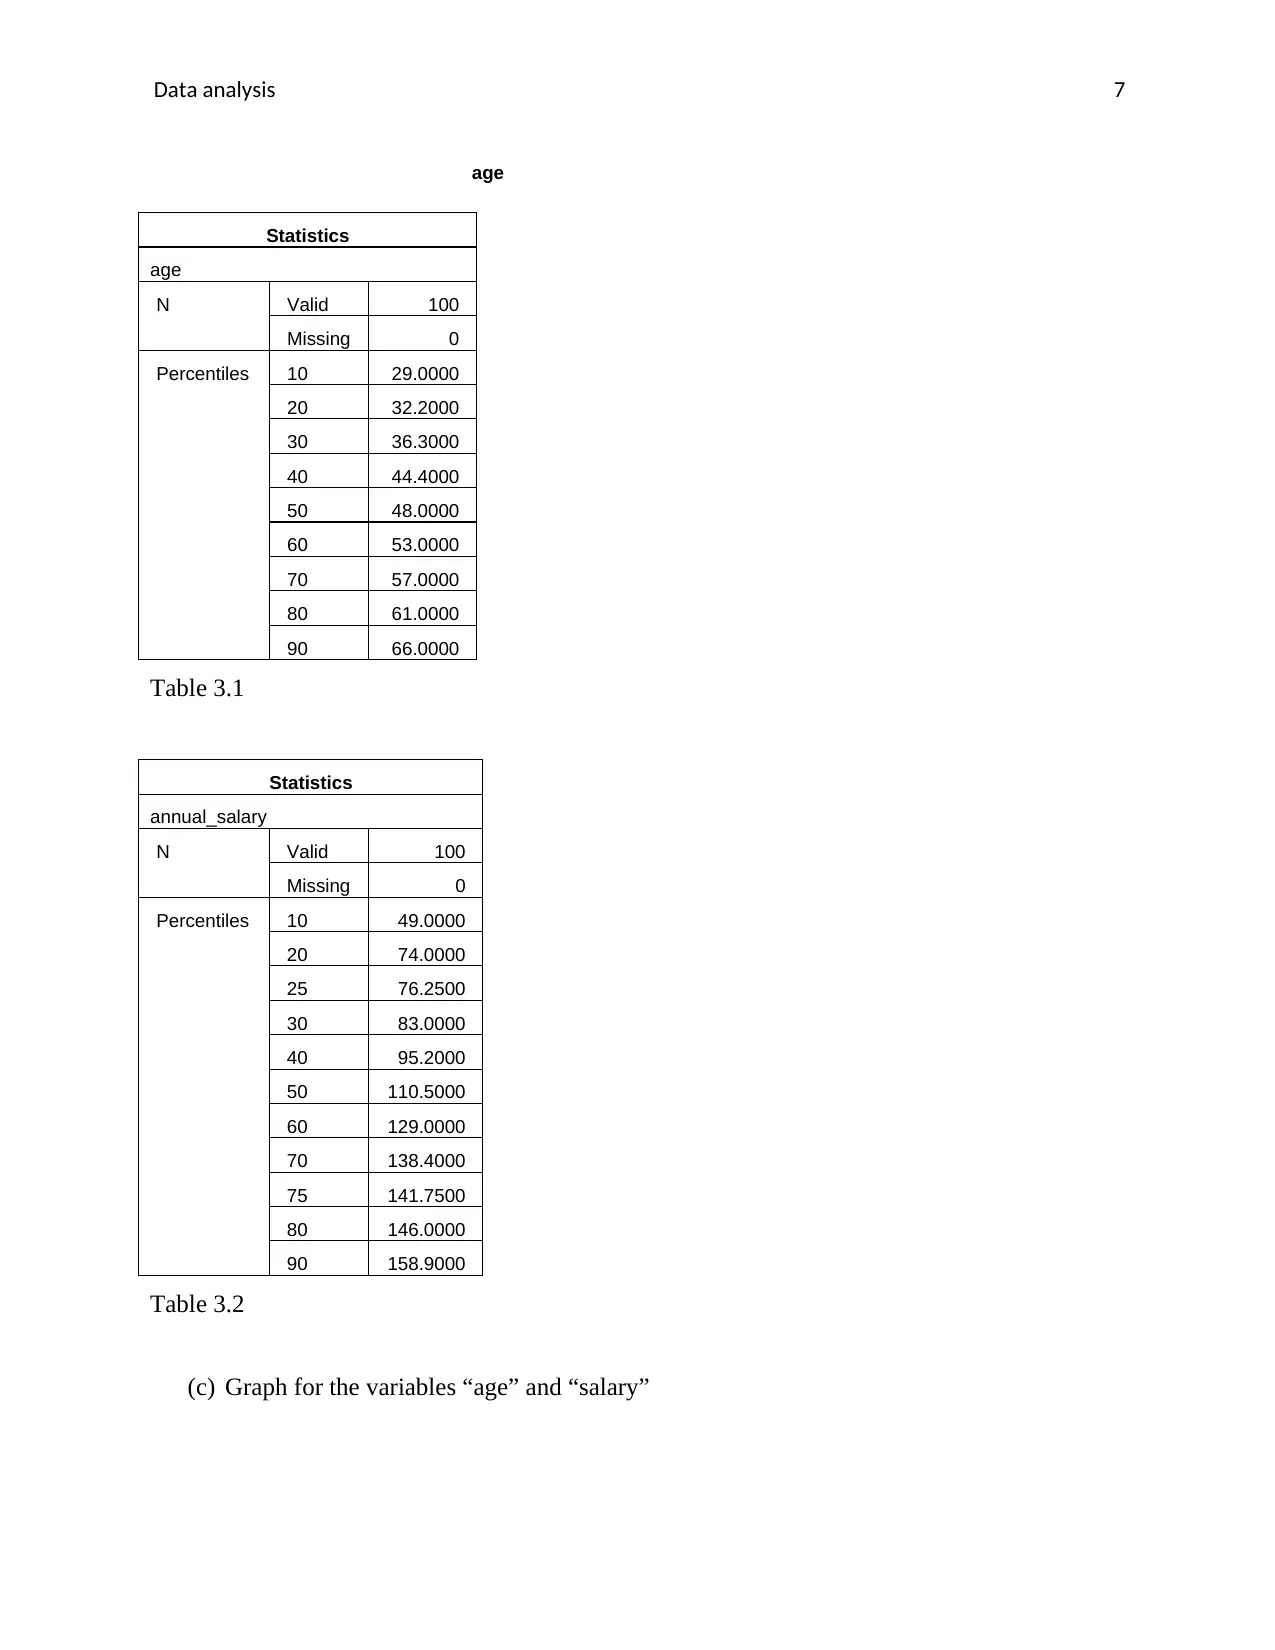
Data analysis 7
age
Statistics
age
N Valid 100
Missing 0
Percentiles 10 29.0000
20 32.2000
30 36.3000
40 44.4000
50 48.0000
60 53.0000
70 57.0000
80 61.0000
90 66.0000
Table 3.1
Statistics
annual_salary
N Valid 100
Missing 0
Percentiles 10 49.0000
20 74.0000
25 76.2500
30 83.0000
40 95.2000
50 110.5000
60 129.0000
70 138.4000
75 141.7500
80 146.0000
90 158.9000
Table 3.2
(c) Graph for the variables “age” and “salary”
age
Statistics
age
N Valid 100
Missing 0
Percentiles 10 29.0000
20 32.2000
30 36.3000
40 44.4000
50 48.0000
60 53.0000
70 57.0000
80 61.0000
90 66.0000
Table 3.1
Statistics
annual_salary
N Valid 100
Missing 0
Percentiles 10 49.0000
20 74.0000
25 76.2500
30 83.0000
40 95.2000
50 110.5000
60 129.0000
70 138.4000
75 141.7500
80 146.0000
90 158.9000
Table 3.2
(c) Graph for the variables “age” and “salary”
Paraphrase This Document
Need a fresh take? Get an instant paraphrase of this document with our AI Paraphraser
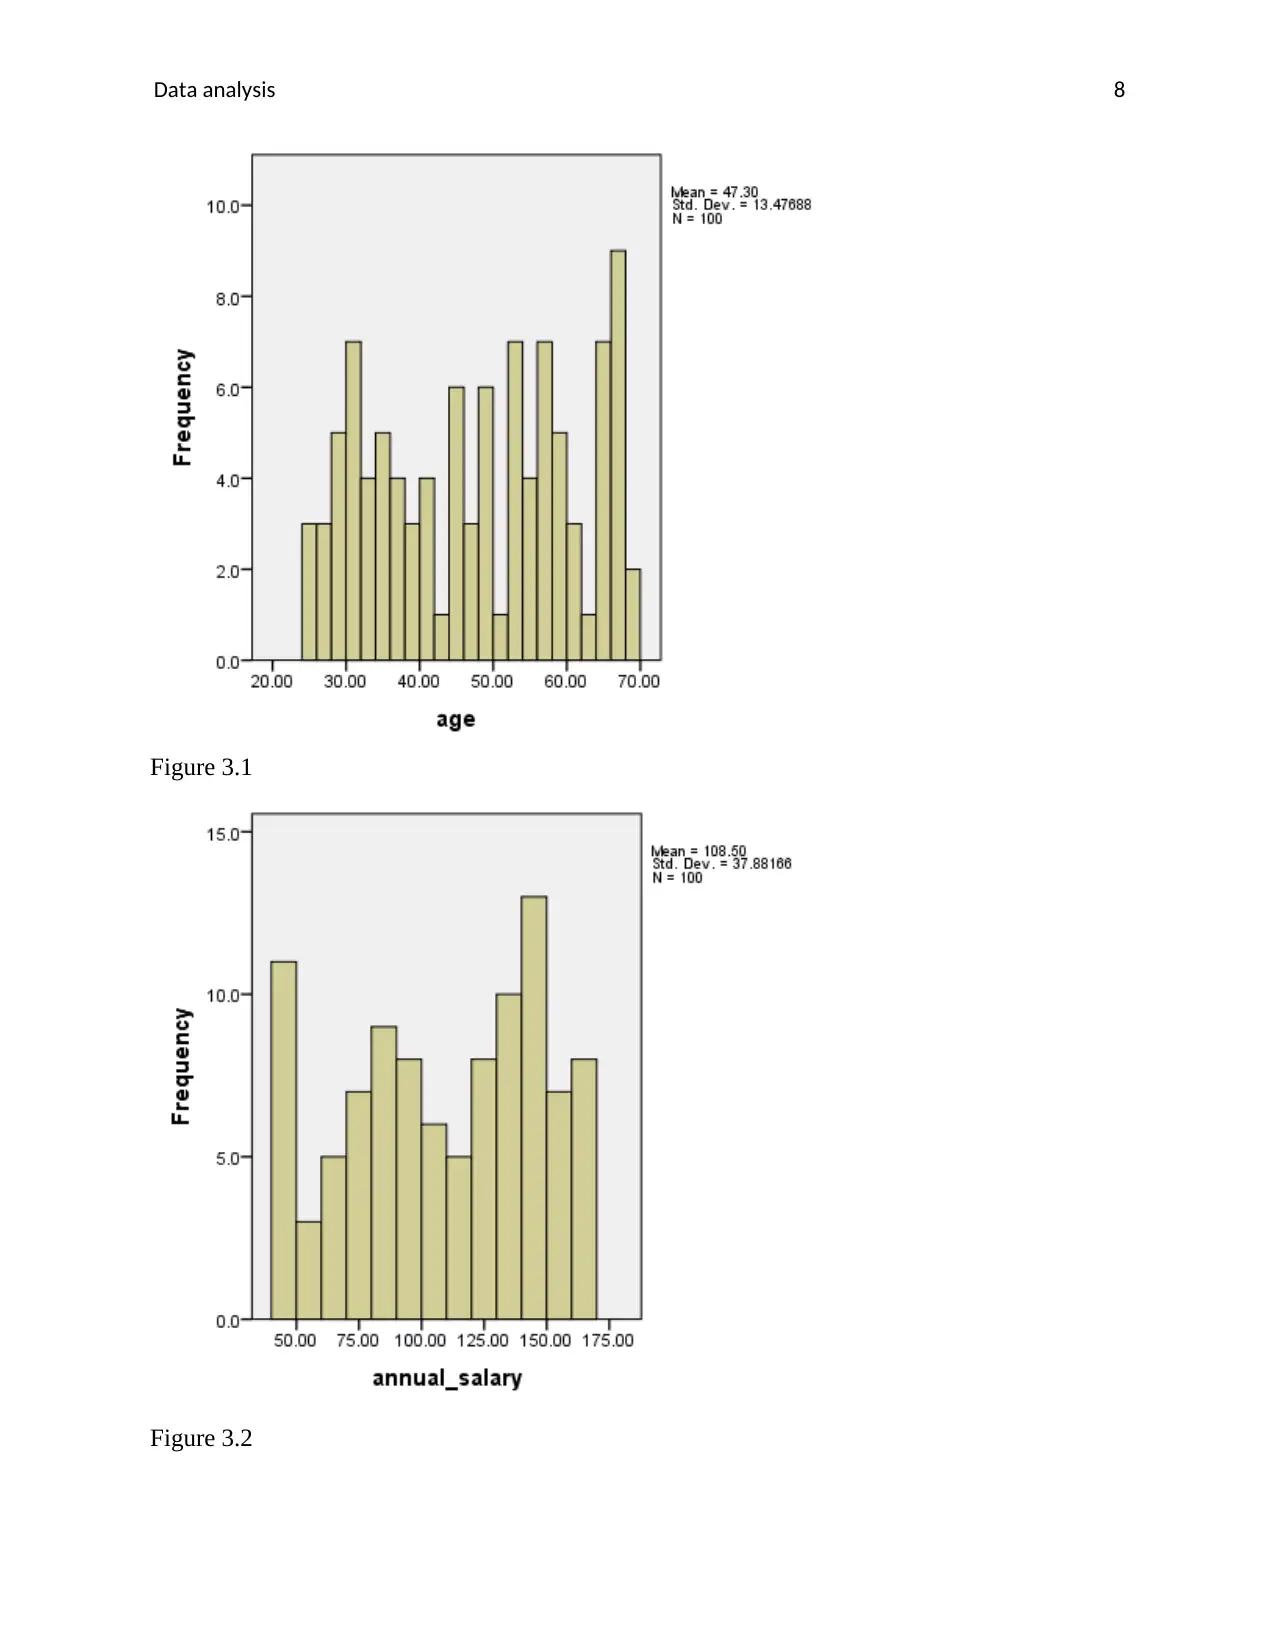
Data analysis 8
Figure 3.1
Figure 3.2
Figure 3.1
Figure 3.2
Data analysis 9
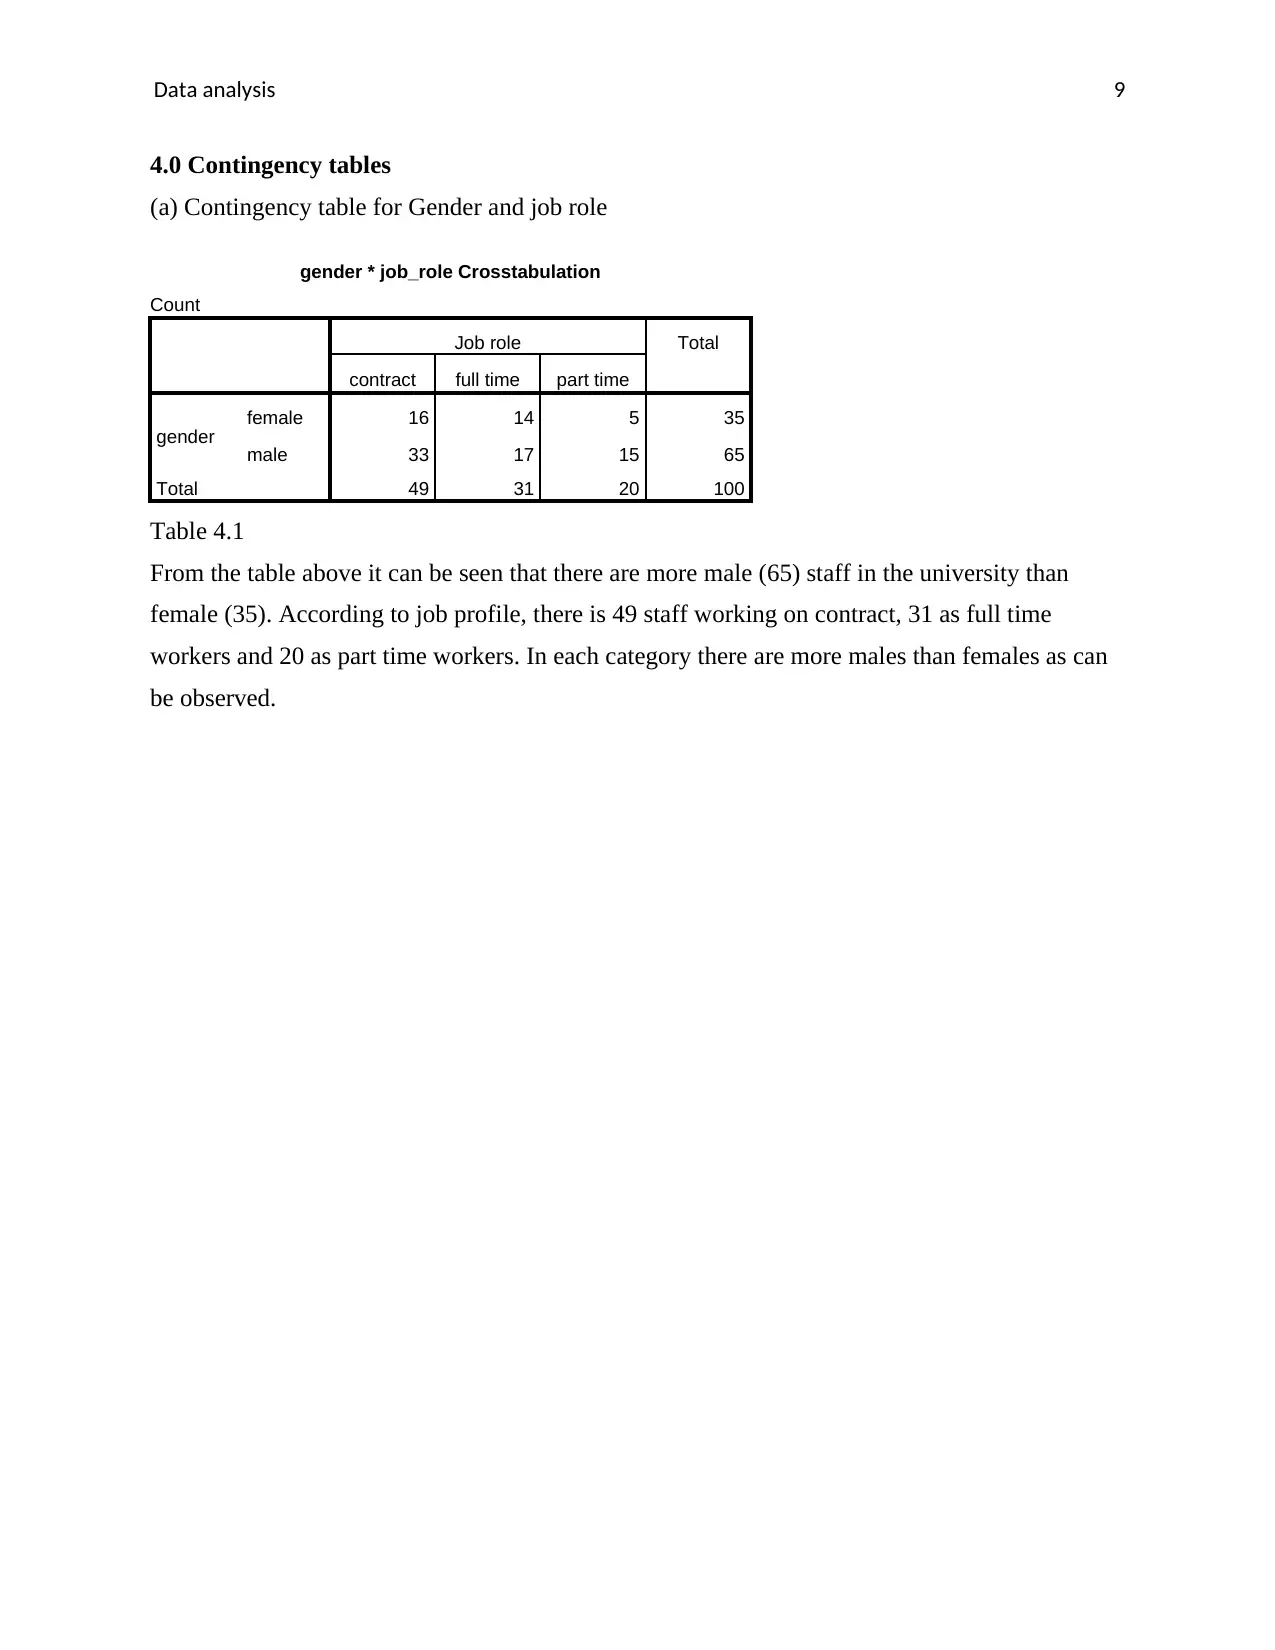
4.0 Contingency tables
(a) Contingency table for Gender and job role
gender * job_role Crosstabulation
Count
Job role Total
contract full time part time
gender female 16 14 5 35
male 33 17 15 65
Total 49 31 20 100
Table 4.1
From the table above it can be seen that there are more male (65) staff in the university than
female (35). According to job profile, there is 49 staff working on contract, 31 as full time
workers and 20 as part time workers. In each category there are more males than females as can
be observed.
Data analysis
10
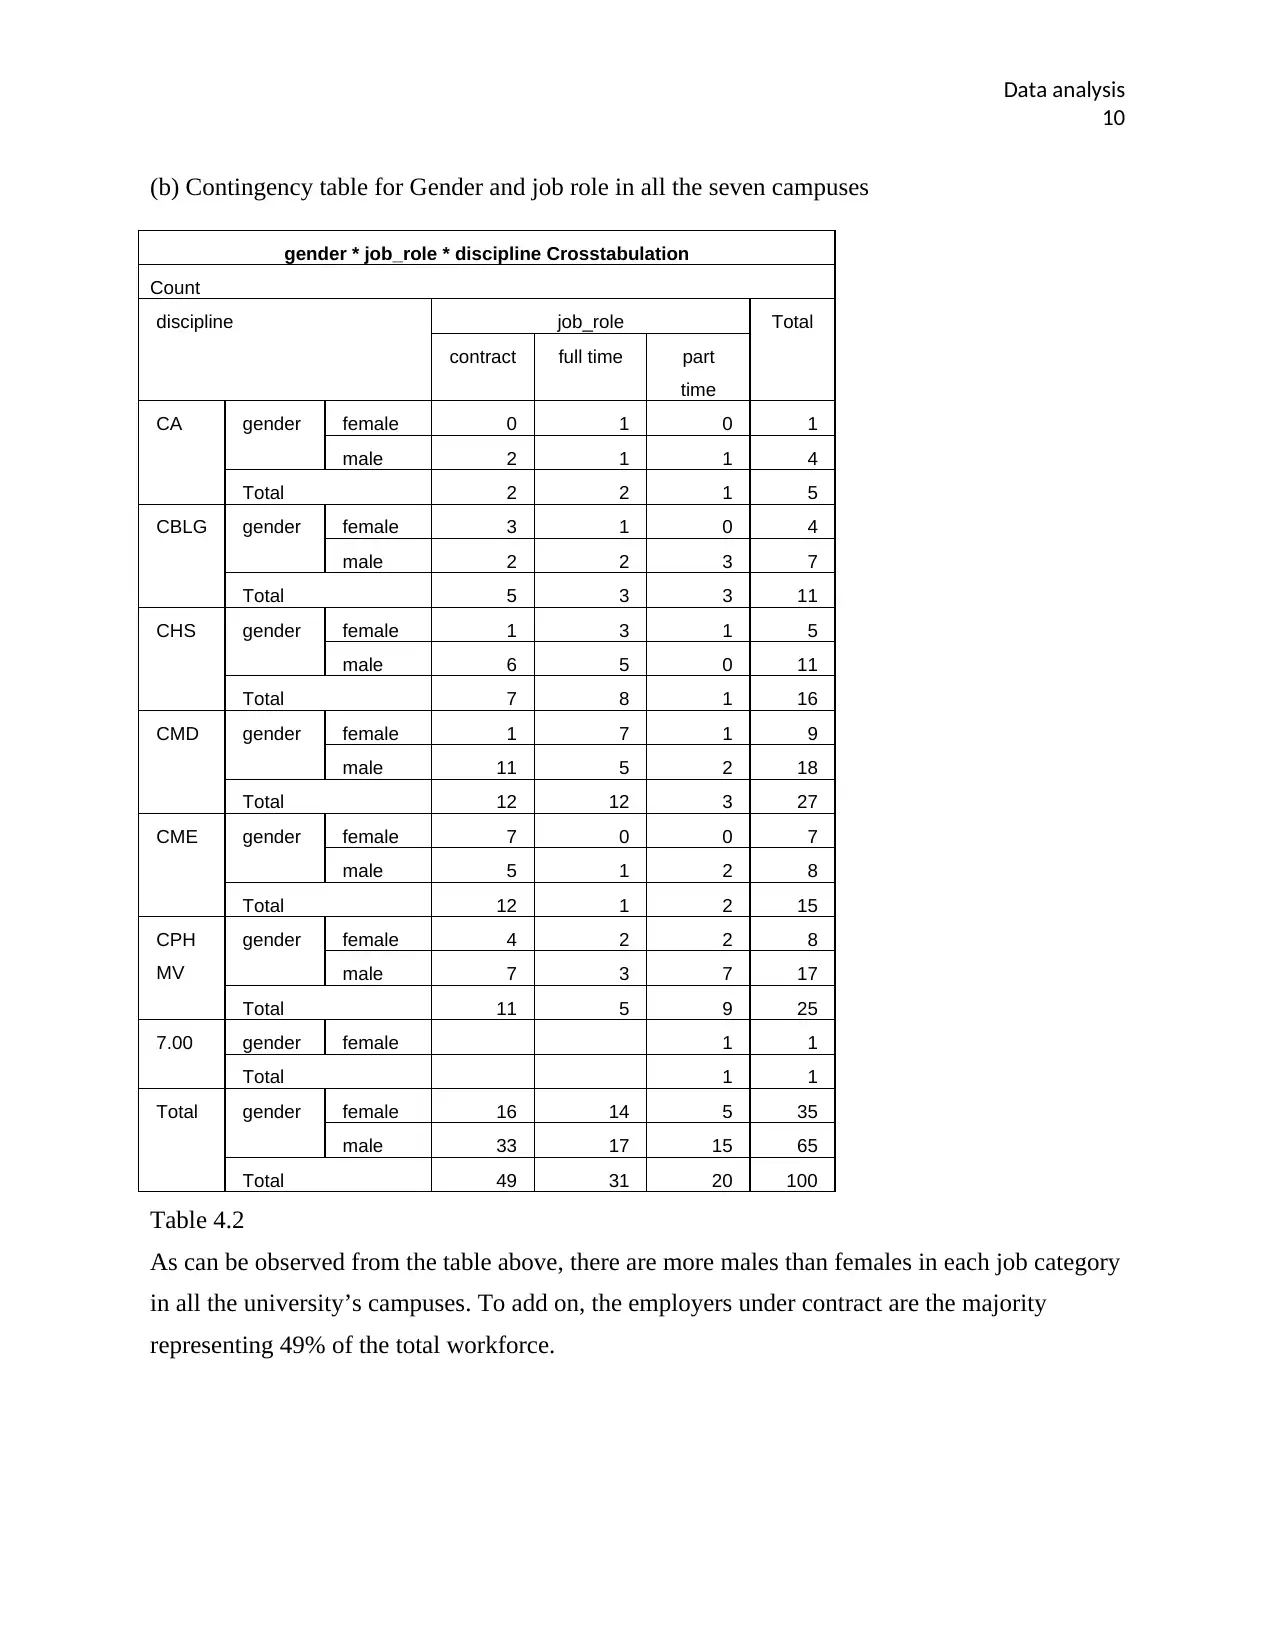
(b) Contingency table for Gender and job role in all the seven campuses
gender * job_role * discipline Crosstabulation
Count
discipline job_role Total
contract full time part
time
CA gender female 0 1 0 1
male 2 1 1 4
Total 2 2 1 5
CBLG gender female 3 1 0 4
male 2 2 3 7
Total 5 3 3 11
CHS gender female 1 3 1 5
male 6 5 0 11
Total 7 8 1 16
CMD gender female 1 7 1 9
male 11 5 2 18
Total 12 12 3 27
CME gender female 7 0 0 7
male 5 1 2 8
Total 12 1 2 15
CPH
MV
gender female 4 2 2 8
male 7 3 7 17
Total 11 5 9 25
7.00 gender female 1 1
Total 1 1
Total gender female 16 14 5 35
male 33 17 15 65
Total 49 31 20 100
Table 4.2
As can be observed from the table above, there are more males than females in each job category
in all the university’s campuses. To add on, the employers under contract are the majority
representing 49% of the total workforce.
10
(b) Contingency table for Gender and job role in all the seven campuses
gender * job_role * discipline Crosstabulation
Count
discipline job_role Total
contract full time part
time
CA gender female 0 1 0 1
male 2 1 1 4
Total 2 2 1 5
CBLG gender female 3 1 0 4
male 2 2 3 7
Total 5 3 3 11
CHS gender female 1 3 1 5
male 6 5 0 11
Total 7 8 1 16
CMD gender female 1 7 1 9
male 11 5 2 18
Total 12 12 3 27
CME gender female 7 0 0 7
male 5 1 2 8
Total 12 1 2 15
CPH
MV
gender female 4 2 2 8
male 7 3 7 17
Total 11 5 9 25
7.00 gender female 1 1
Total 1 1
Total gender female 16 14 5 35
male 33 17 15 65
Total 49 31 20 100
Table 4.2
As can be observed from the table above, there are more males than females in each job category
in all the university’s campuses. To add on, the employers under contract are the majority
representing 49% of the total workforce.
Secure Best Marks with AI Grader
Need help grading? Try our AI Grader for instant feedback on your assignments.
Data analysis
11
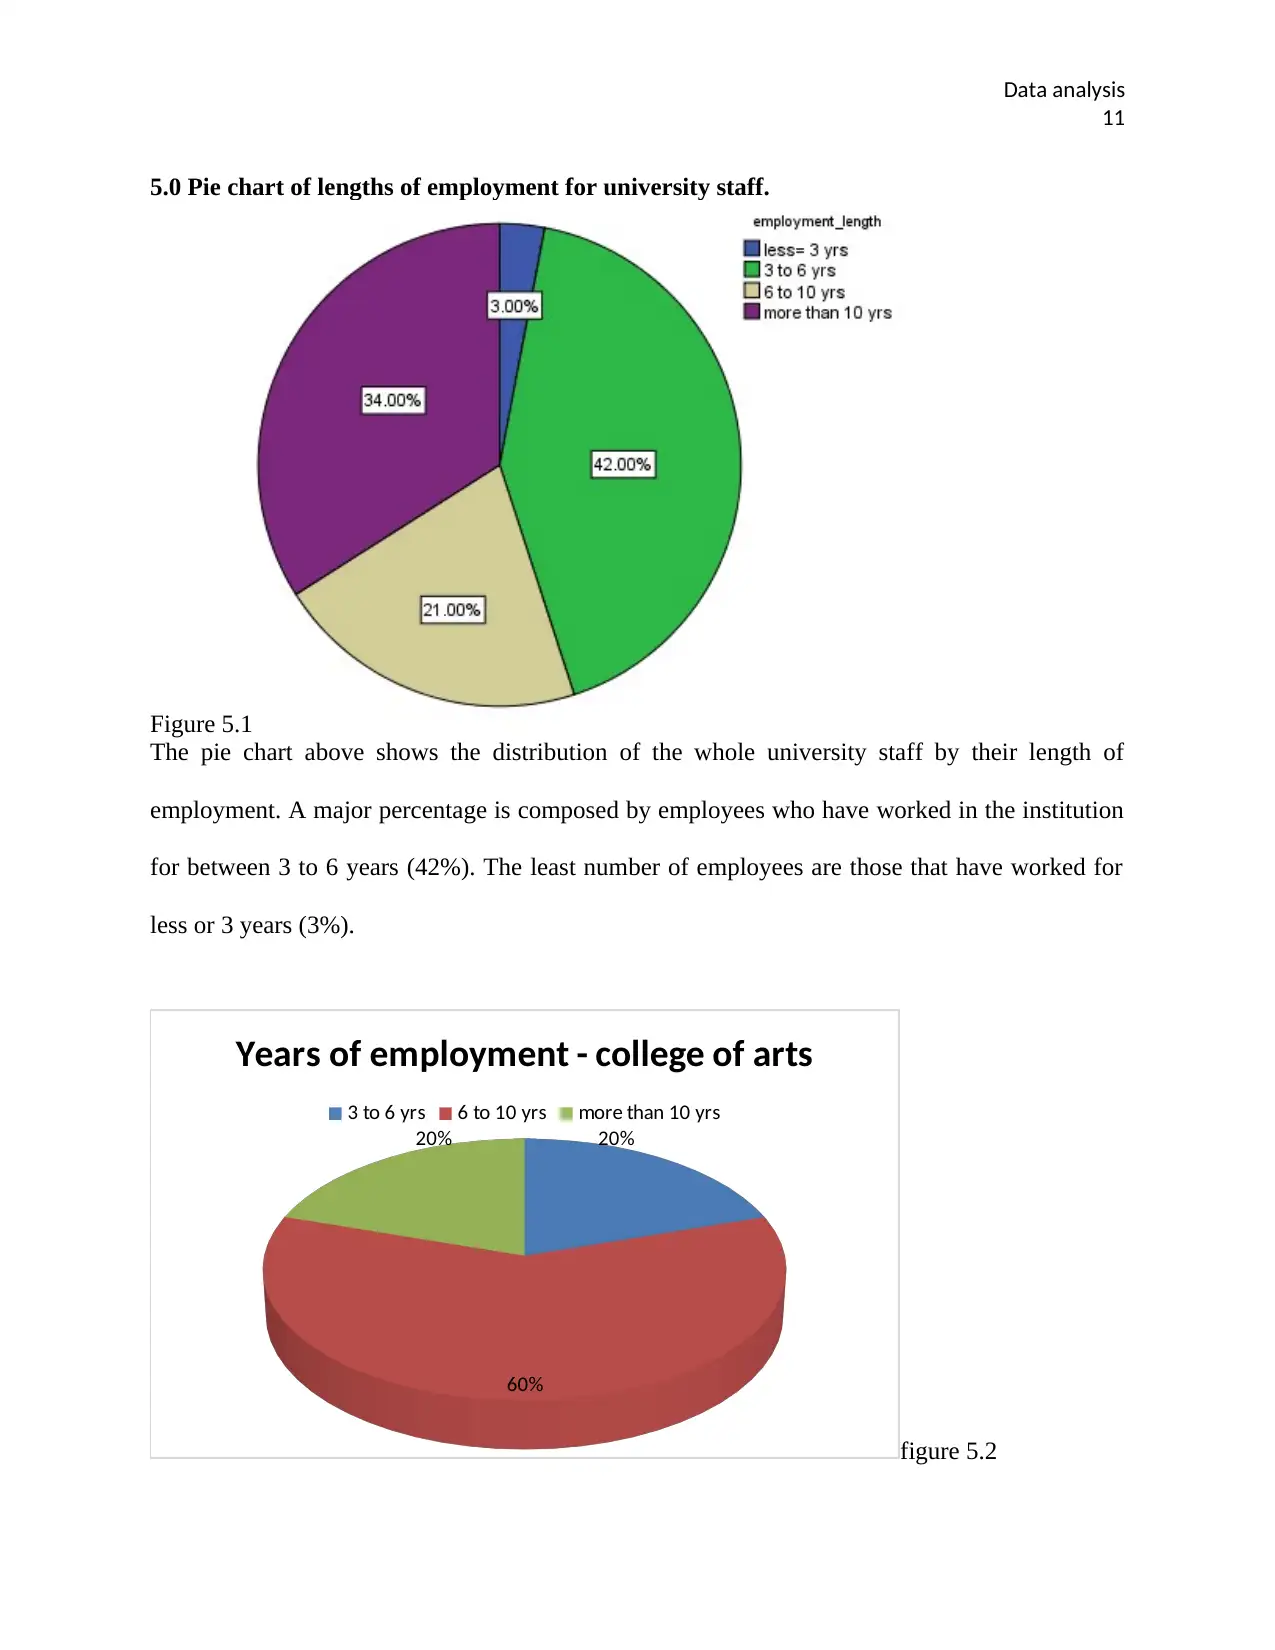
5.0 Pie chart of lengths of employment for university staff.
Figure 5.1
The pie chart above shows the distribution of the whole university staff by their length of
employment. A major percentage is composed by employees who have worked in the institution
for between 3 to 6 years (42%). The least number of employees are those that have worked for
less or 3 years (3%).
20%
60%
20%
Years of employment - college of arts
3 to 6 yrs 6 to 10 yrs more than 10 yrs
figure 5.2
11
5.0 Pie chart of lengths of employment for university staff.
Figure 5.1
The pie chart above shows the distribution of the whole university staff by their length of
employment. A major percentage is composed by employees who have worked in the institution
for between 3 to 6 years (42%). The least number of employees are those that have worked for
less or 3 years (3%).
20%
60%
20%
Years of employment - college of arts
3 to 6 yrs 6 to 10 yrs more than 10 yrs
figure 5.2
Data analysis
12
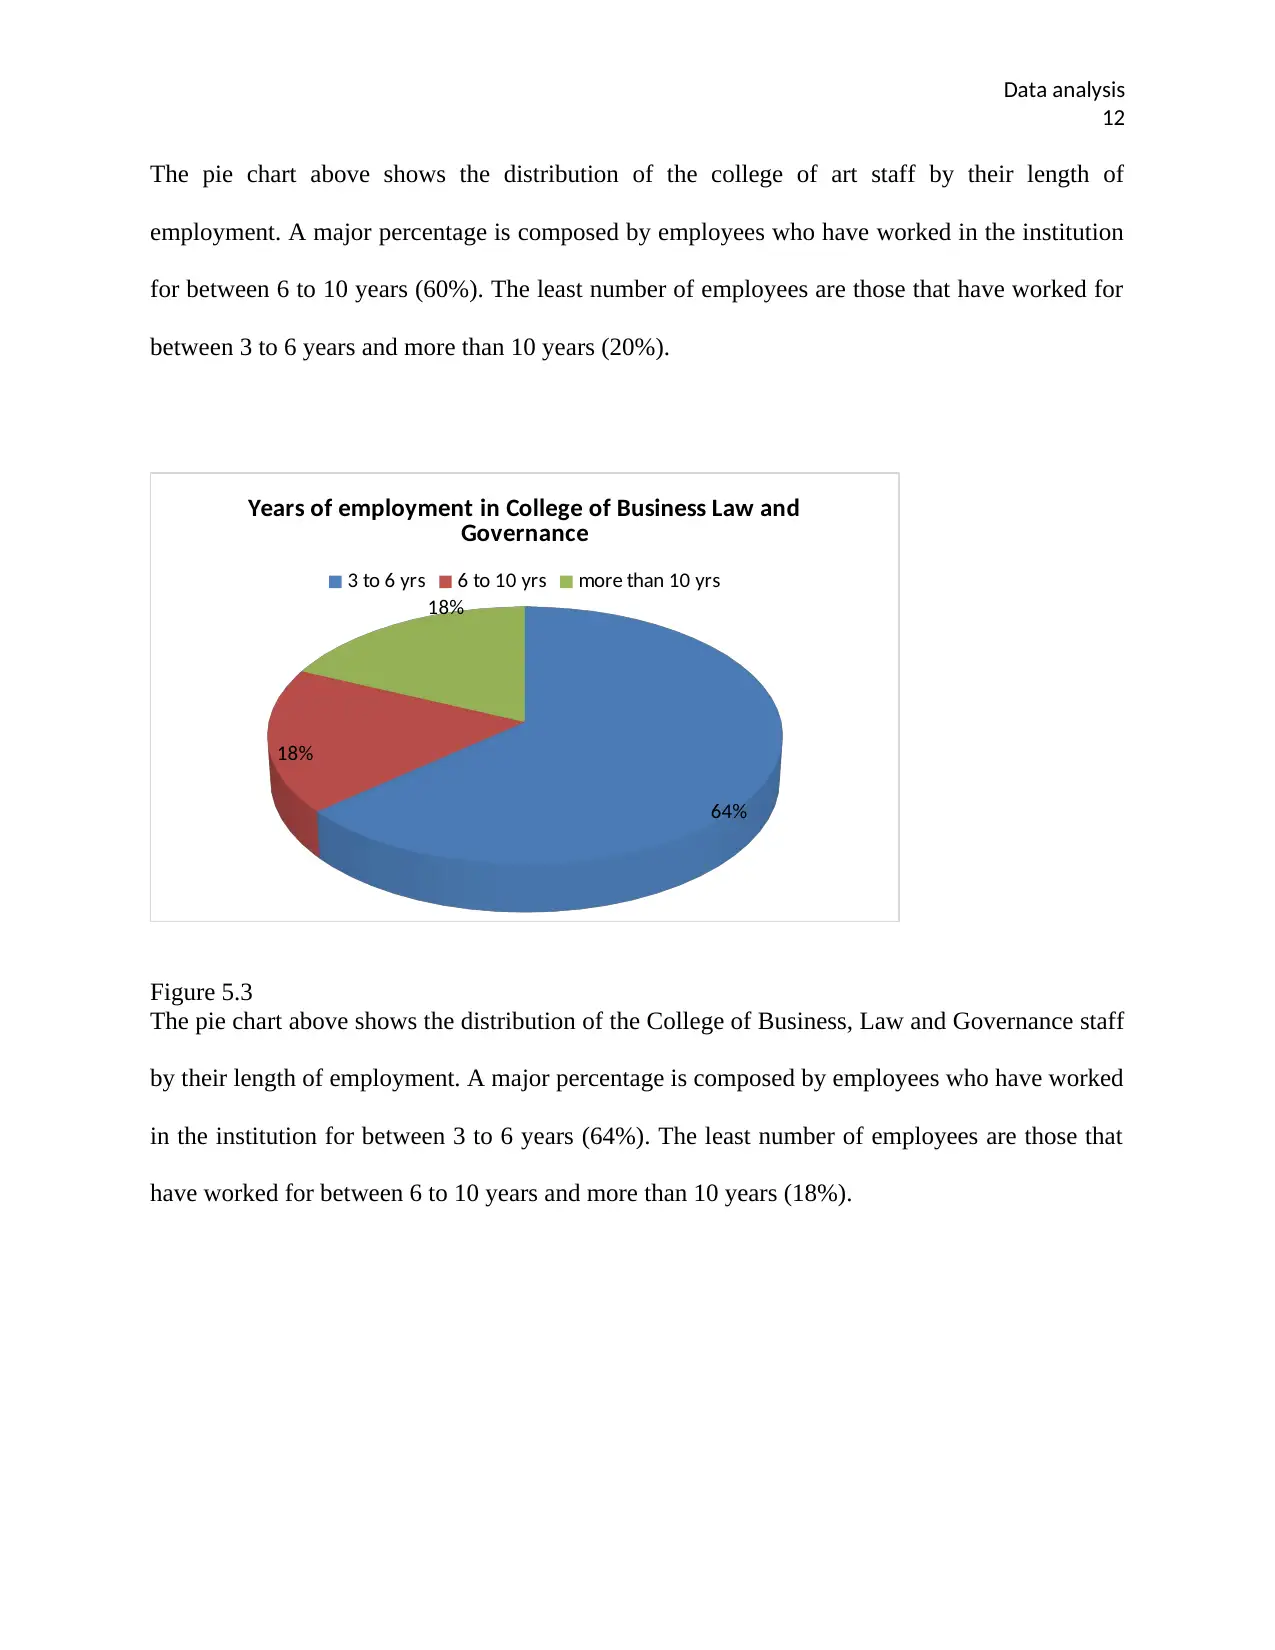
The pie chart above shows the distribution of the college of art staff by their length of
employment. A major percentage is composed by employees who have worked in the institution
for between 6 to 10 years (60%). The least number of employees are those that have worked for
between 3 to 6 years and more than 10 years (20%).
64%
18%
18%
Years of employment in College of Business Law and
Governance
3 to 6 yrs 6 to 10 yrs more than 10 yrs
Figure 5.3
The pie chart above shows the distribution of the College of Business, Law and Governance staff
by their length of employment. A major percentage is composed by employees who have worked
in the institution for between 3 to 6 years (64%). The least number of employees are those that
have worked for between 6 to 10 years and more than 10 years (18%).
12
The pie chart above shows the distribution of the college of art staff by their length of
employment. A major percentage is composed by employees who have worked in the institution
for between 6 to 10 years (60%). The least number of employees are those that have worked for
between 3 to 6 years and more than 10 years (20%).
64%
18%
18%
Years of employment in College of Business Law and
Governance
3 to 6 yrs 6 to 10 yrs more than 10 yrs
Figure 5.3
The pie chart above shows the distribution of the College of Business, Law and Governance staff
by their length of employment. A major percentage is composed by employees who have worked
in the institution for between 3 to 6 years (64%). The least number of employees are those that
have worked for between 6 to 10 years and more than 10 years (18%).
Data analysis
13
31%
25%
44%
Years of employment -health
sciences
3 to 6 yrs 6 to 10 yrs more than 10 yrs
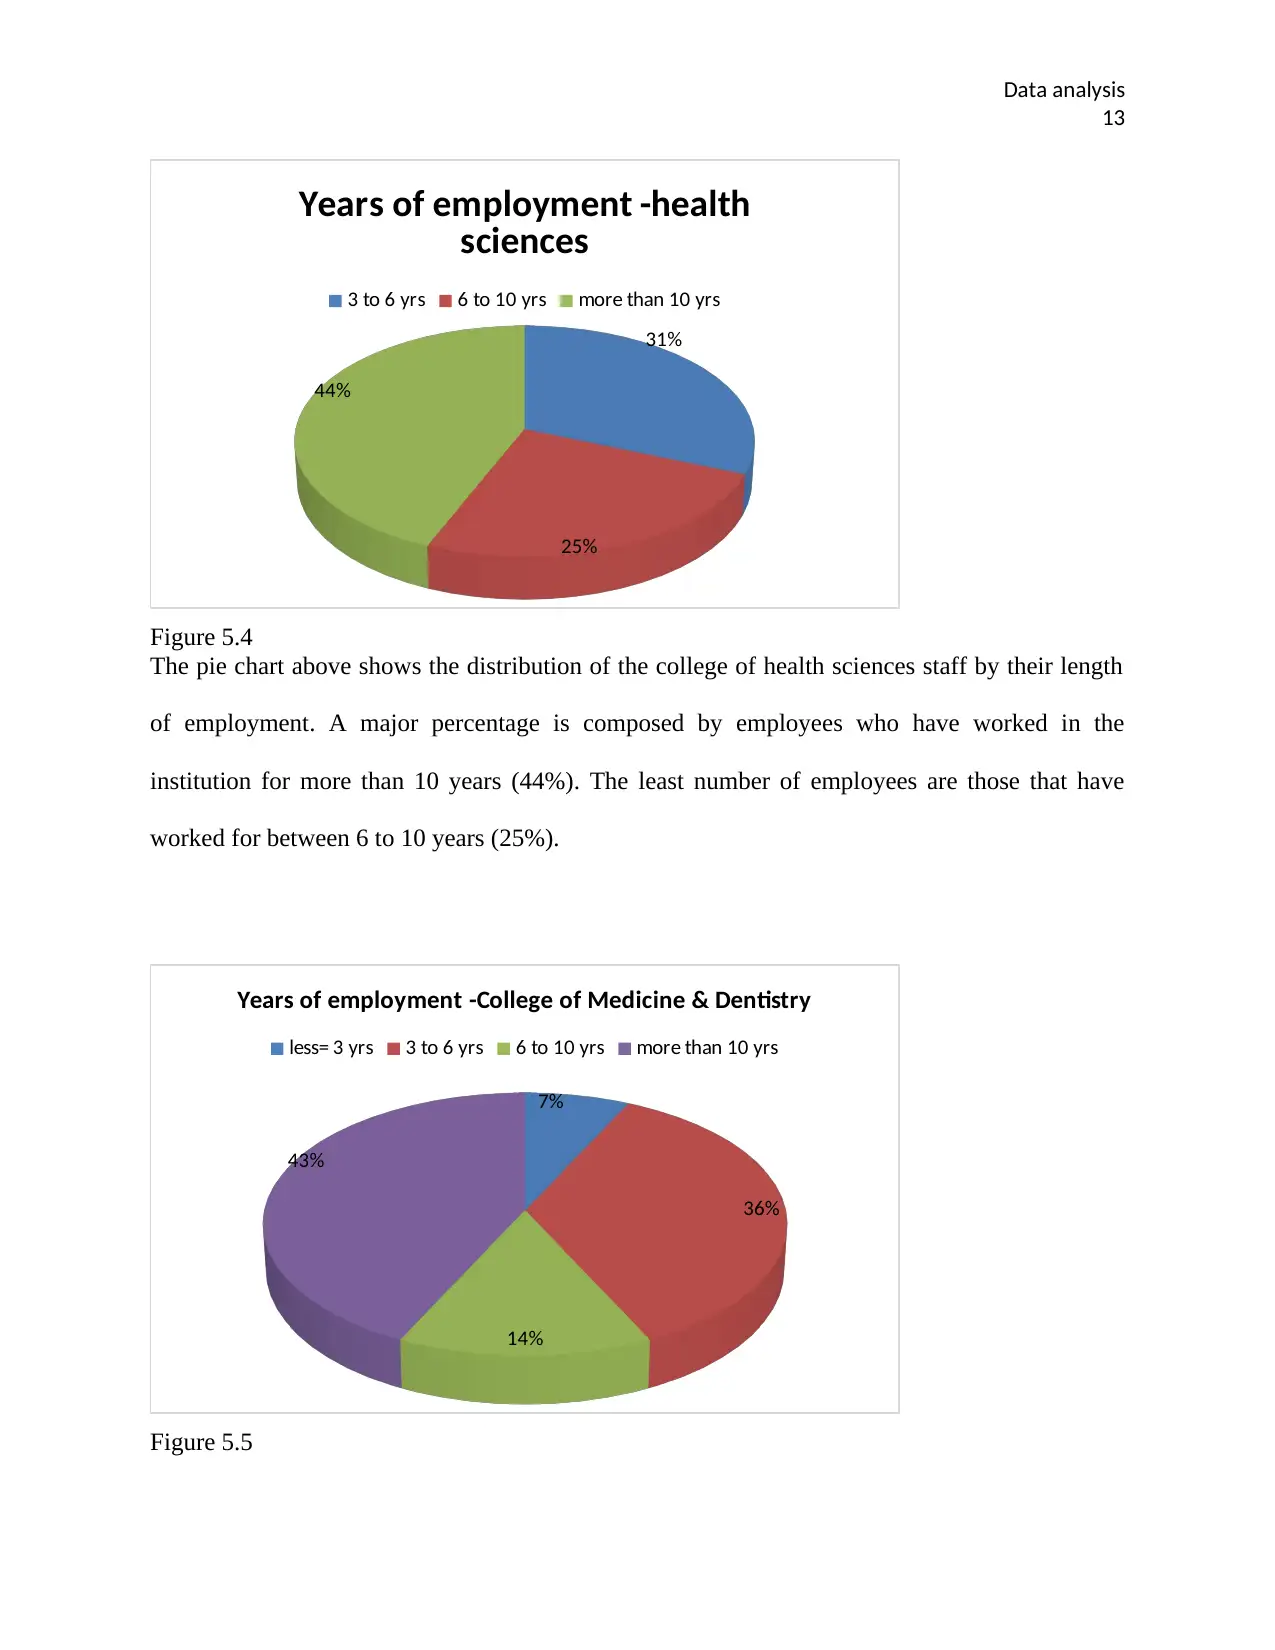
Figure 5.4
The pie chart above shows the distribution of the college of health sciences staff by their length
of employment. A major percentage is composed by employees who have worked in the
institution for more than 10 years (44%). The least number of employees are those that have
worked for between 6 to 10 years (25%).
7%
36%
14%
43%
Years of employment -College of Medicine & Dentistry
less= 3 yrs 3 to 6 yrs 6 to 10 yrs more than 10 yrs
Figure 5.5
13
31%
25%
44%
Years of employment -health
sciences
3 to 6 yrs 6 to 10 yrs more than 10 yrs
Figure 5.4
The pie chart above shows the distribution of the college of health sciences staff by their length
of employment. A major percentage is composed by employees who have worked in the
institution for more than 10 years (44%). The least number of employees are those that have
worked for between 6 to 10 years (25%).
7%
36%
14%
43%
Years of employment -College of Medicine & Dentistry
less= 3 yrs 3 to 6 yrs 6 to 10 yrs more than 10 yrs
Figure 5.5
Paraphrase This Document
Need a fresh take? Get an instant paraphrase of this document with our AI Paraphraser
Data analysis
14
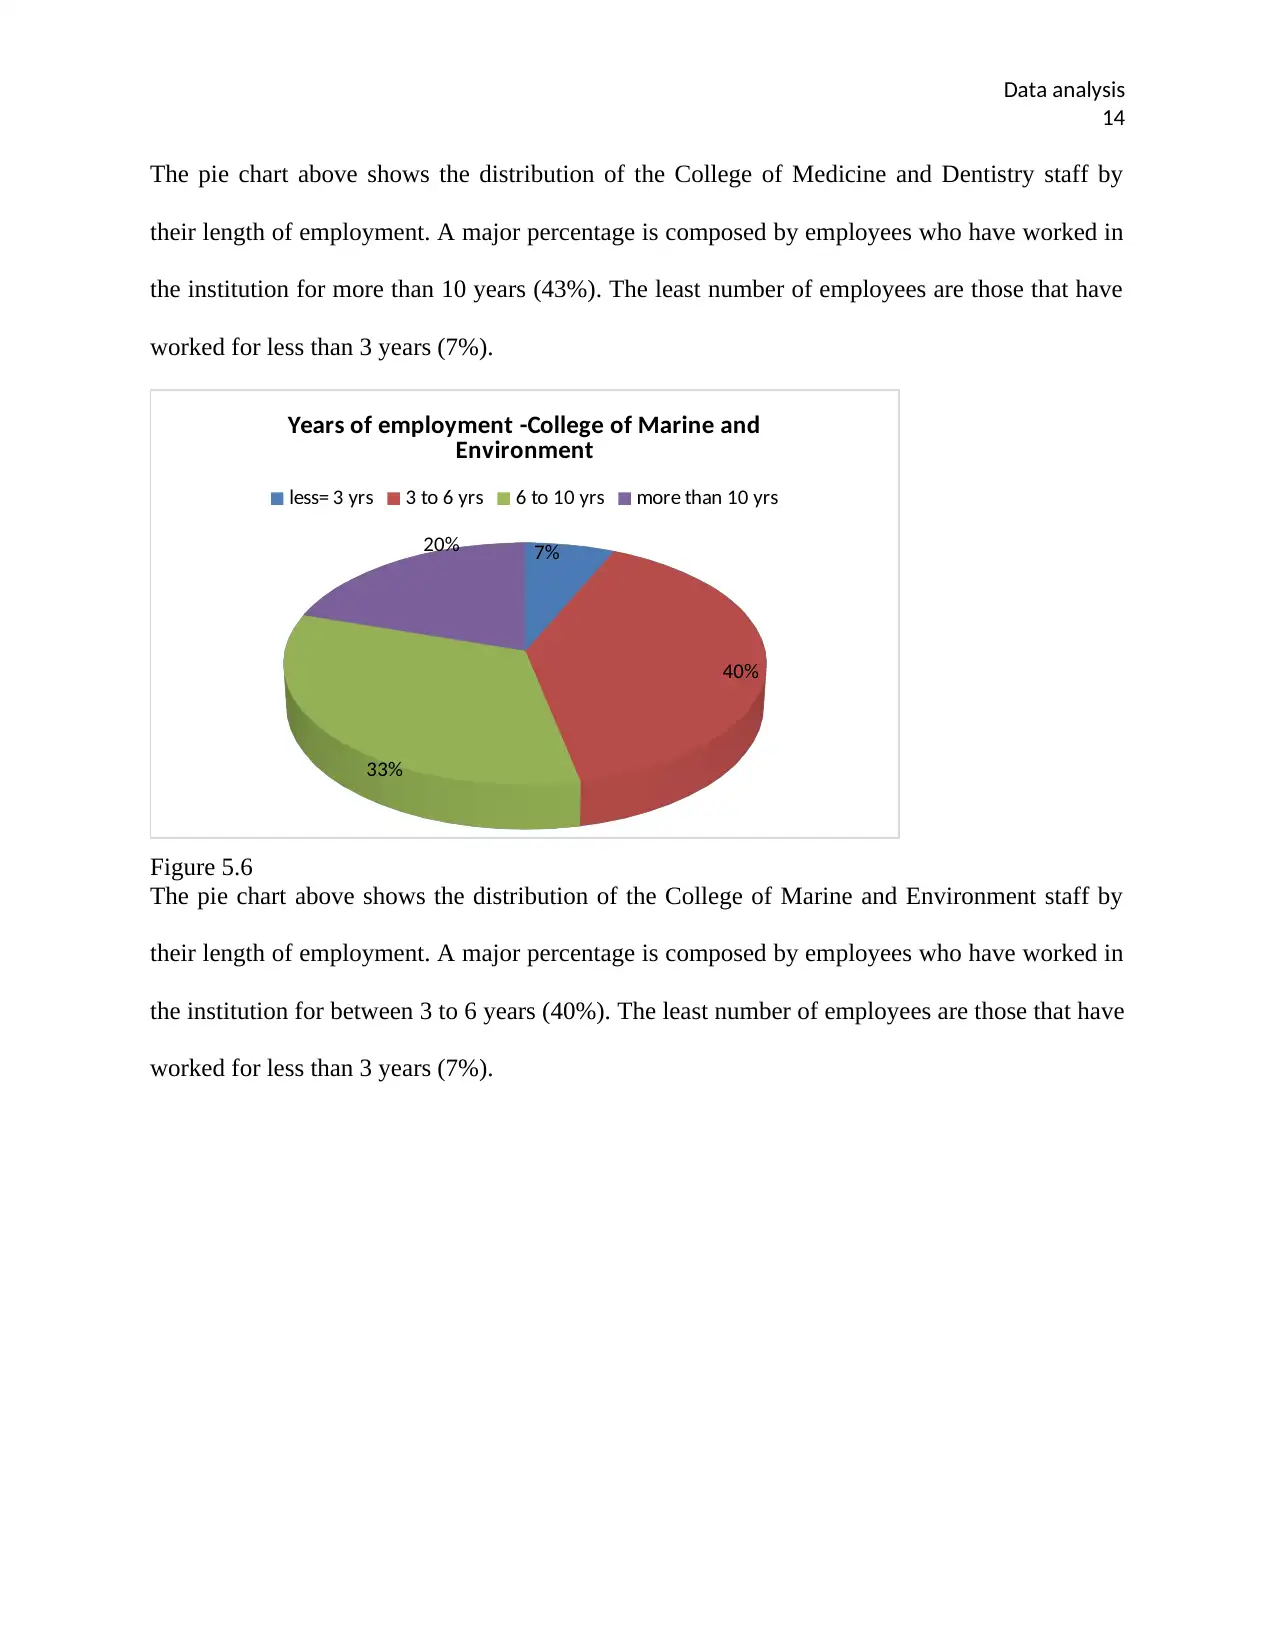
The pie chart above shows the distribution of the College of Medicine and Dentistry staff by
their length of employment. A major percentage is composed by employees who have worked in
the institution for more than 10 years (43%). The least number of employees are those that have
worked for less than 3 years (7%).
7%
40%
33%
20%
Years of employment -College of Marine and
Environment
less= 3 yrs 3 to 6 yrs 6 to 10 yrs more than 10 yrs
Figure 5.6
The pie chart above shows the distribution of the College of Marine and Environment staff by
their length of employment. A major percentage is composed by employees who have worked in
the institution for between 3 to 6 years (40%). The least number of employees are those that have
worked for less than 3 years (7%).
14
The pie chart above shows the distribution of the College of Medicine and Dentistry staff by
their length of employment. A major percentage is composed by employees who have worked in
the institution for more than 10 years (43%). The least number of employees are those that have
worked for less than 3 years (7%).
7%
40%
33%
20%
Years of employment -College of Marine and
Environment
less= 3 yrs 3 to 6 yrs 6 to 10 yrs more than 10 yrs
Figure 5.6
The pie chart above shows the distribution of the College of Marine and Environment staff by
their length of employment. A major percentage is composed by employees who have worked in
the institution for between 3 to 6 years (40%). The least number of employees are those that have
worked for less than 3 years (7%).
Data analysis
15
52%
16%
32%
Years of employment -College of Public Health, Medical
and Veterinary
3 to 6 yrs 6 to 10 yrs more than 10 yrs
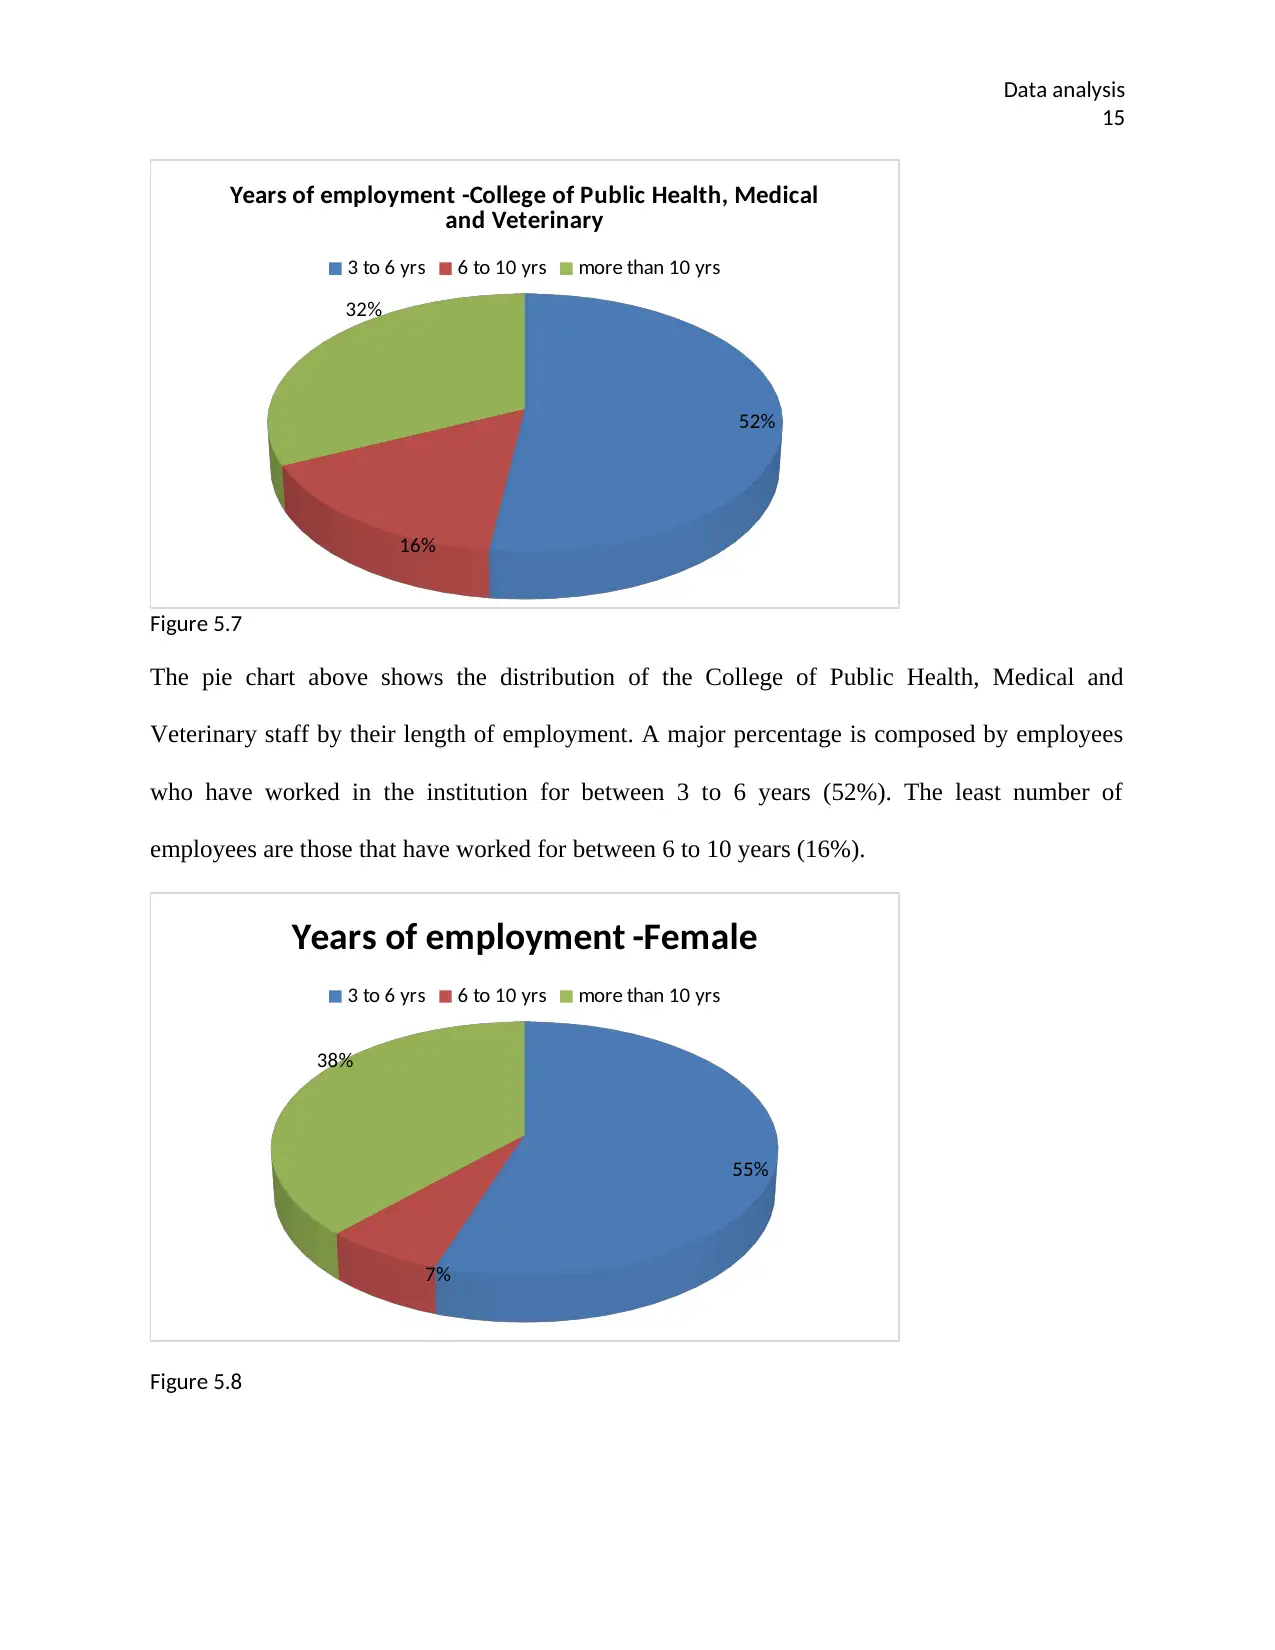
Figure 5.7
The pie chart above shows the distribution of the College of Public Health, Medical and
Veterinary staff by their length of employment. A major percentage is composed by employees
who have worked in the institution for between 3 to 6 years (52%). The least number of
employees are those that have worked for between 6 to 10 years (16%).
55%
7%
38%
Years of employment -Female
3 to 6 yrs 6 to 10 yrs more than 10 yrs
Figure 5.8
15
52%
16%
32%
Years of employment -College of Public Health, Medical
and Veterinary
3 to 6 yrs 6 to 10 yrs more than 10 yrs
Figure 5.7
The pie chart above shows the distribution of the College of Public Health, Medical and
Veterinary staff by their length of employment. A major percentage is composed by employees
who have worked in the institution for between 3 to 6 years (52%). The least number of
employees are those that have worked for between 6 to 10 years (16%).
55%
7%
38%
Years of employment -Female
3 to 6 yrs 6 to 10 yrs more than 10 yrs
Figure 5.8
Data analysis
16
The pie chart above shows the distribution of the female staff by their length of employment. A
major percentage is composed by employees who have worked in the institution for between 3 to
6 years (55%). The least number of employees are those that have worked for between 6 to 10
years (7%).
42%
27%
31%
Years of employment -Male
3 to 6 yrs 6 to 10 yrs more than 10 yrs
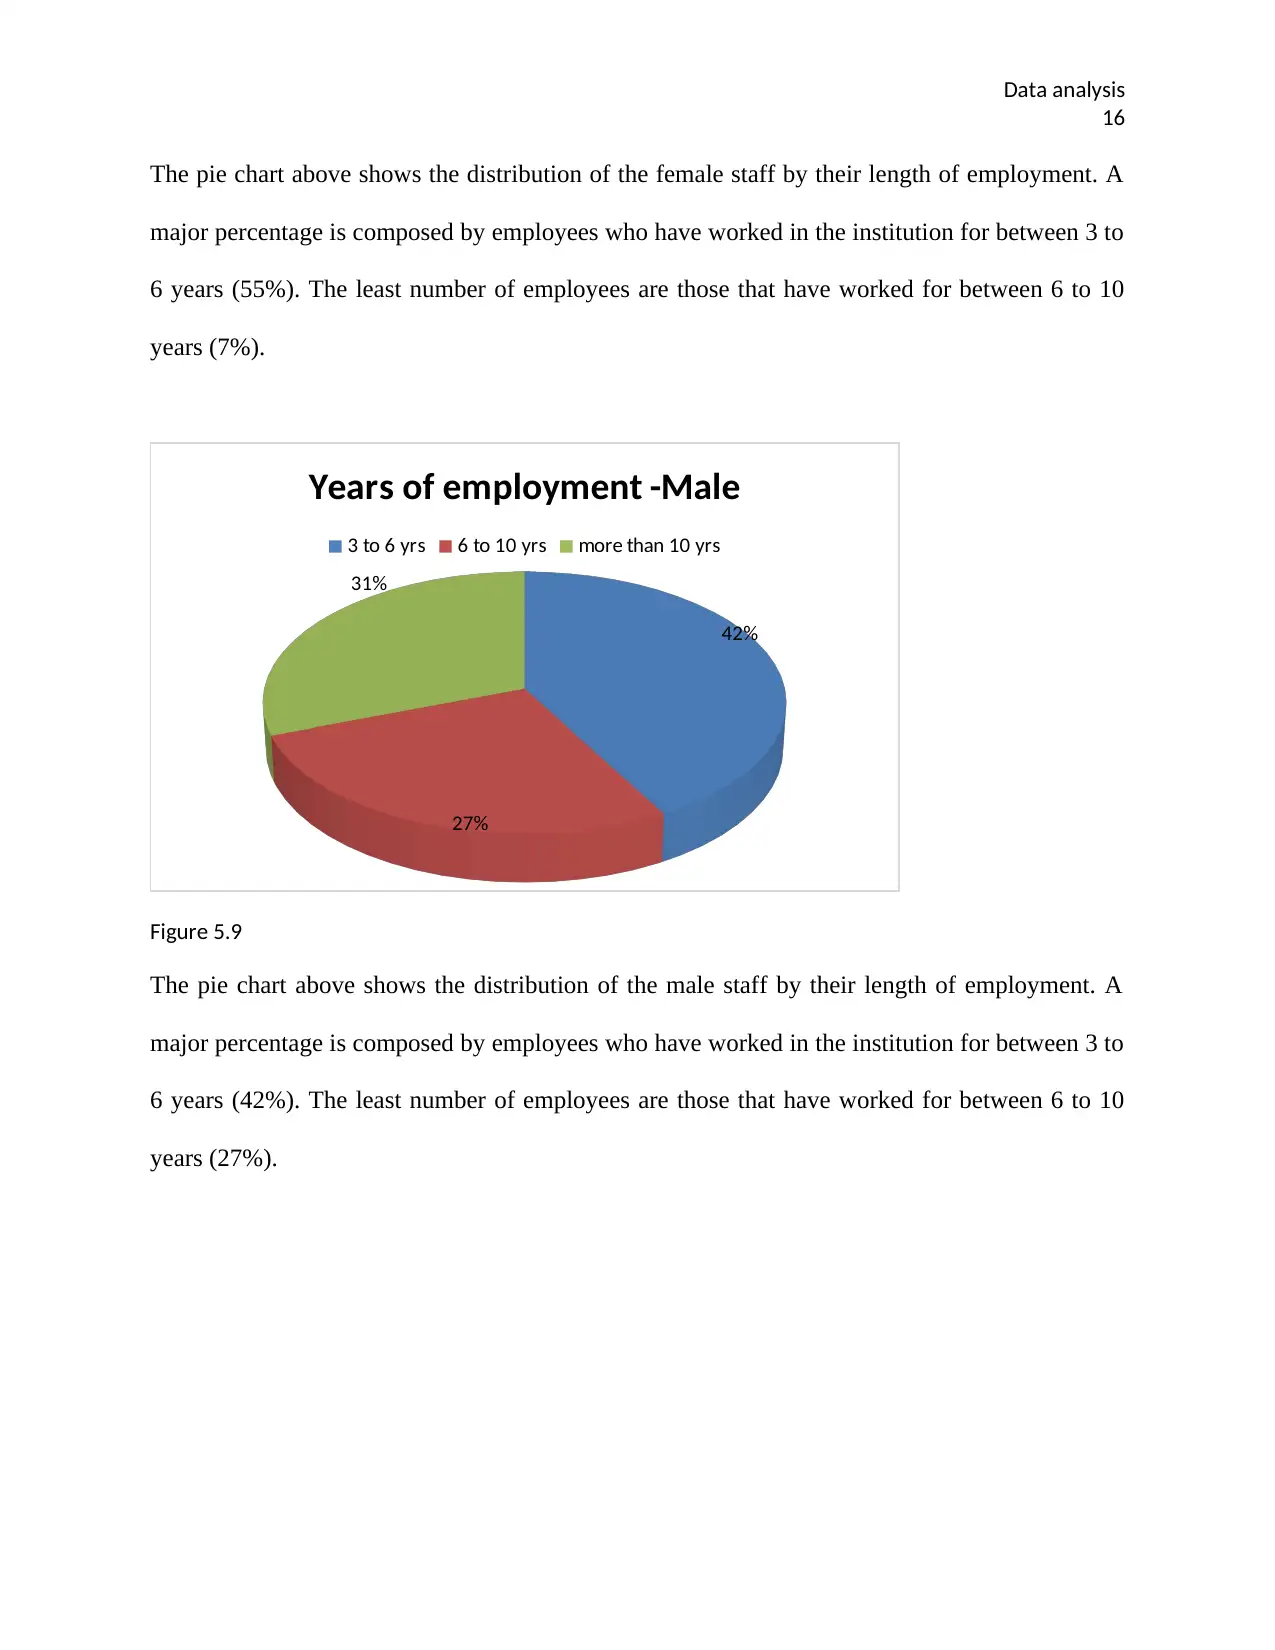
Figure 5.9
The pie chart above shows the distribution of the male staff by their length of employment. A
major percentage is composed by employees who have worked in the institution for between 3 to
6 years (42%). The least number of employees are those that have worked for between 6 to 10
years (27%).
16
The pie chart above shows the distribution of the female staff by their length of employment. A
major percentage is composed by employees who have worked in the institution for between 3 to
6 years (55%). The least number of employees are those that have worked for between 6 to 10
years (7%).
42%
27%
31%
Years of employment -Male
3 to 6 yrs 6 to 10 yrs more than 10 yrs
Figure 5.9
The pie chart above shows the distribution of the male staff by their length of employment. A
major percentage is composed by employees who have worked in the institution for between 3 to
6 years (42%). The least number of employees are those that have worked for between 6 to 10
years (27%).
Secure Best Marks with AI Grader
Need help grading? Try our AI Grader for instant feedback on your assignments.
Data analysis
17
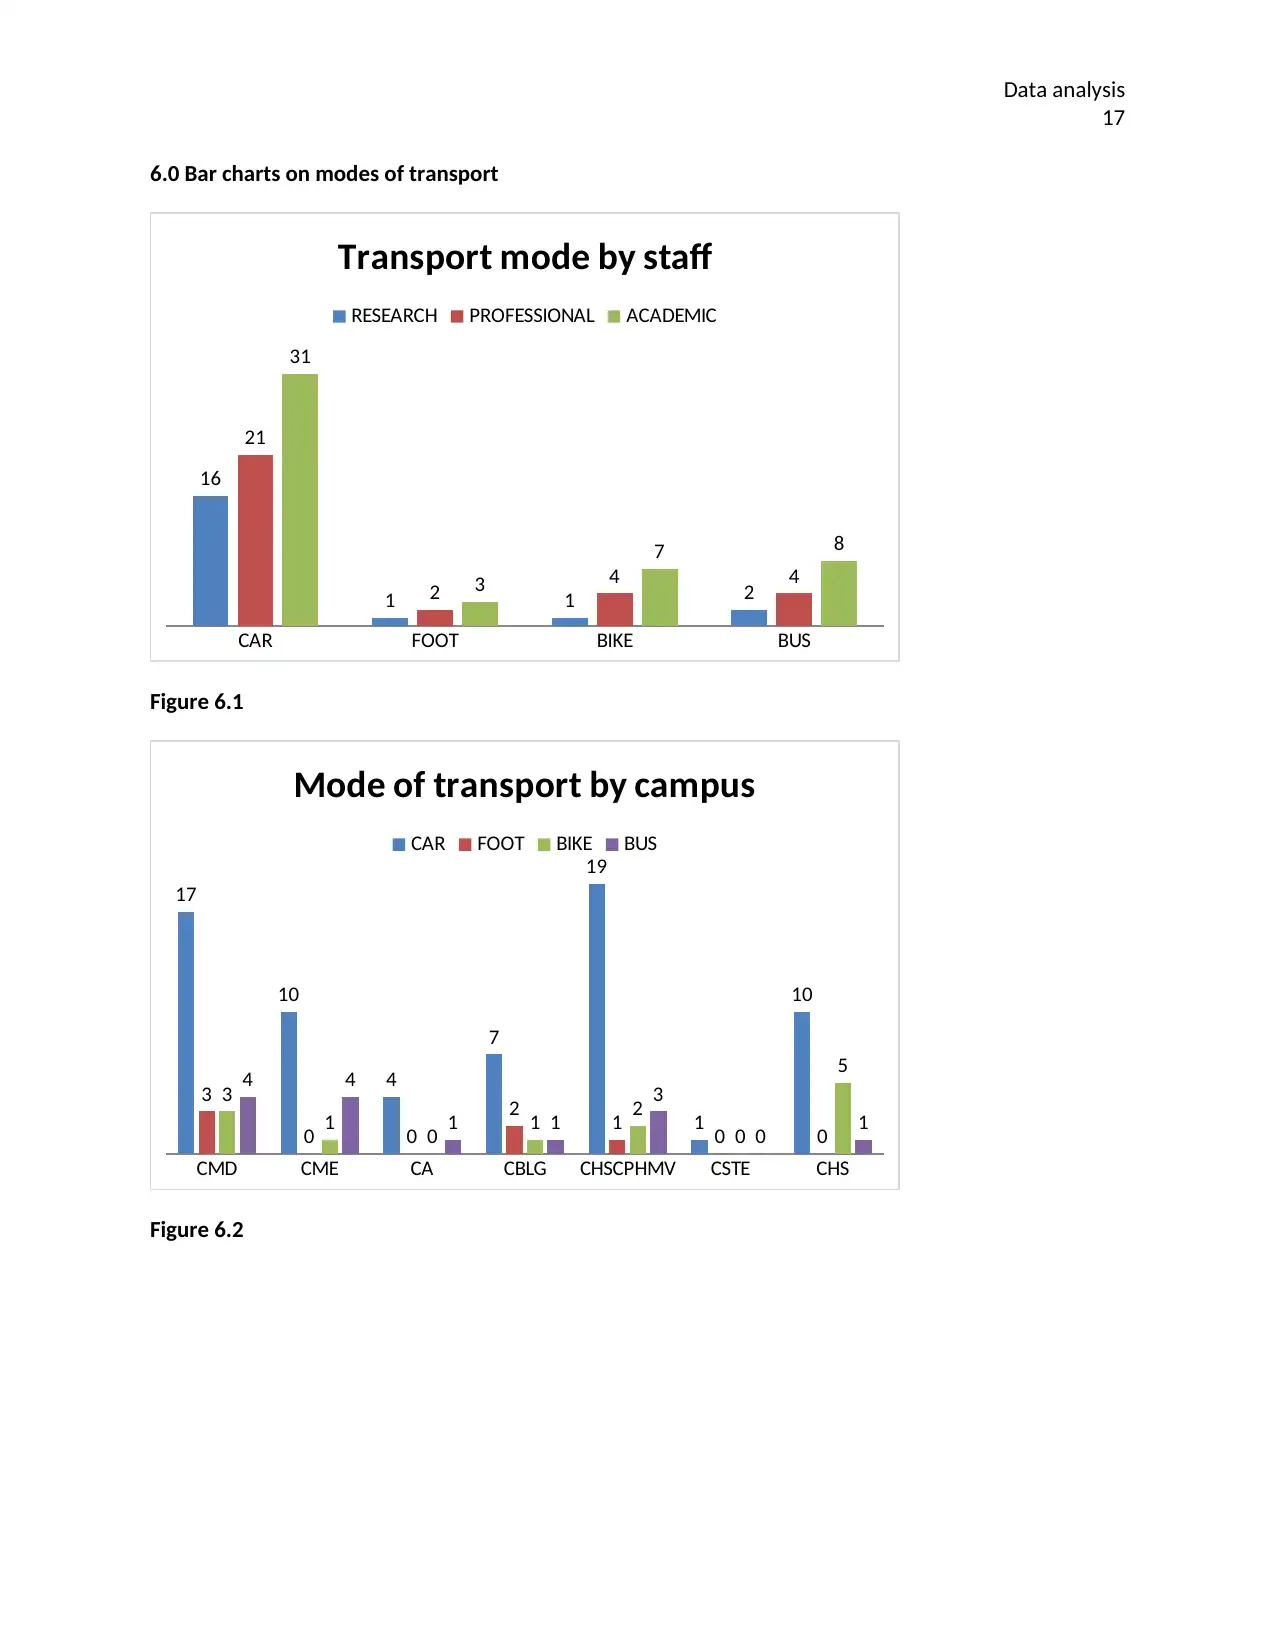
6.0 Bar charts on modes of transport
CAR FOOT BIKE BUS
16
1 1 2
21
2 4 4
31
3
7 8
Transport mode by staff
RESEARCH PROFESSIONAL ACADEMIC
Figure 6.1
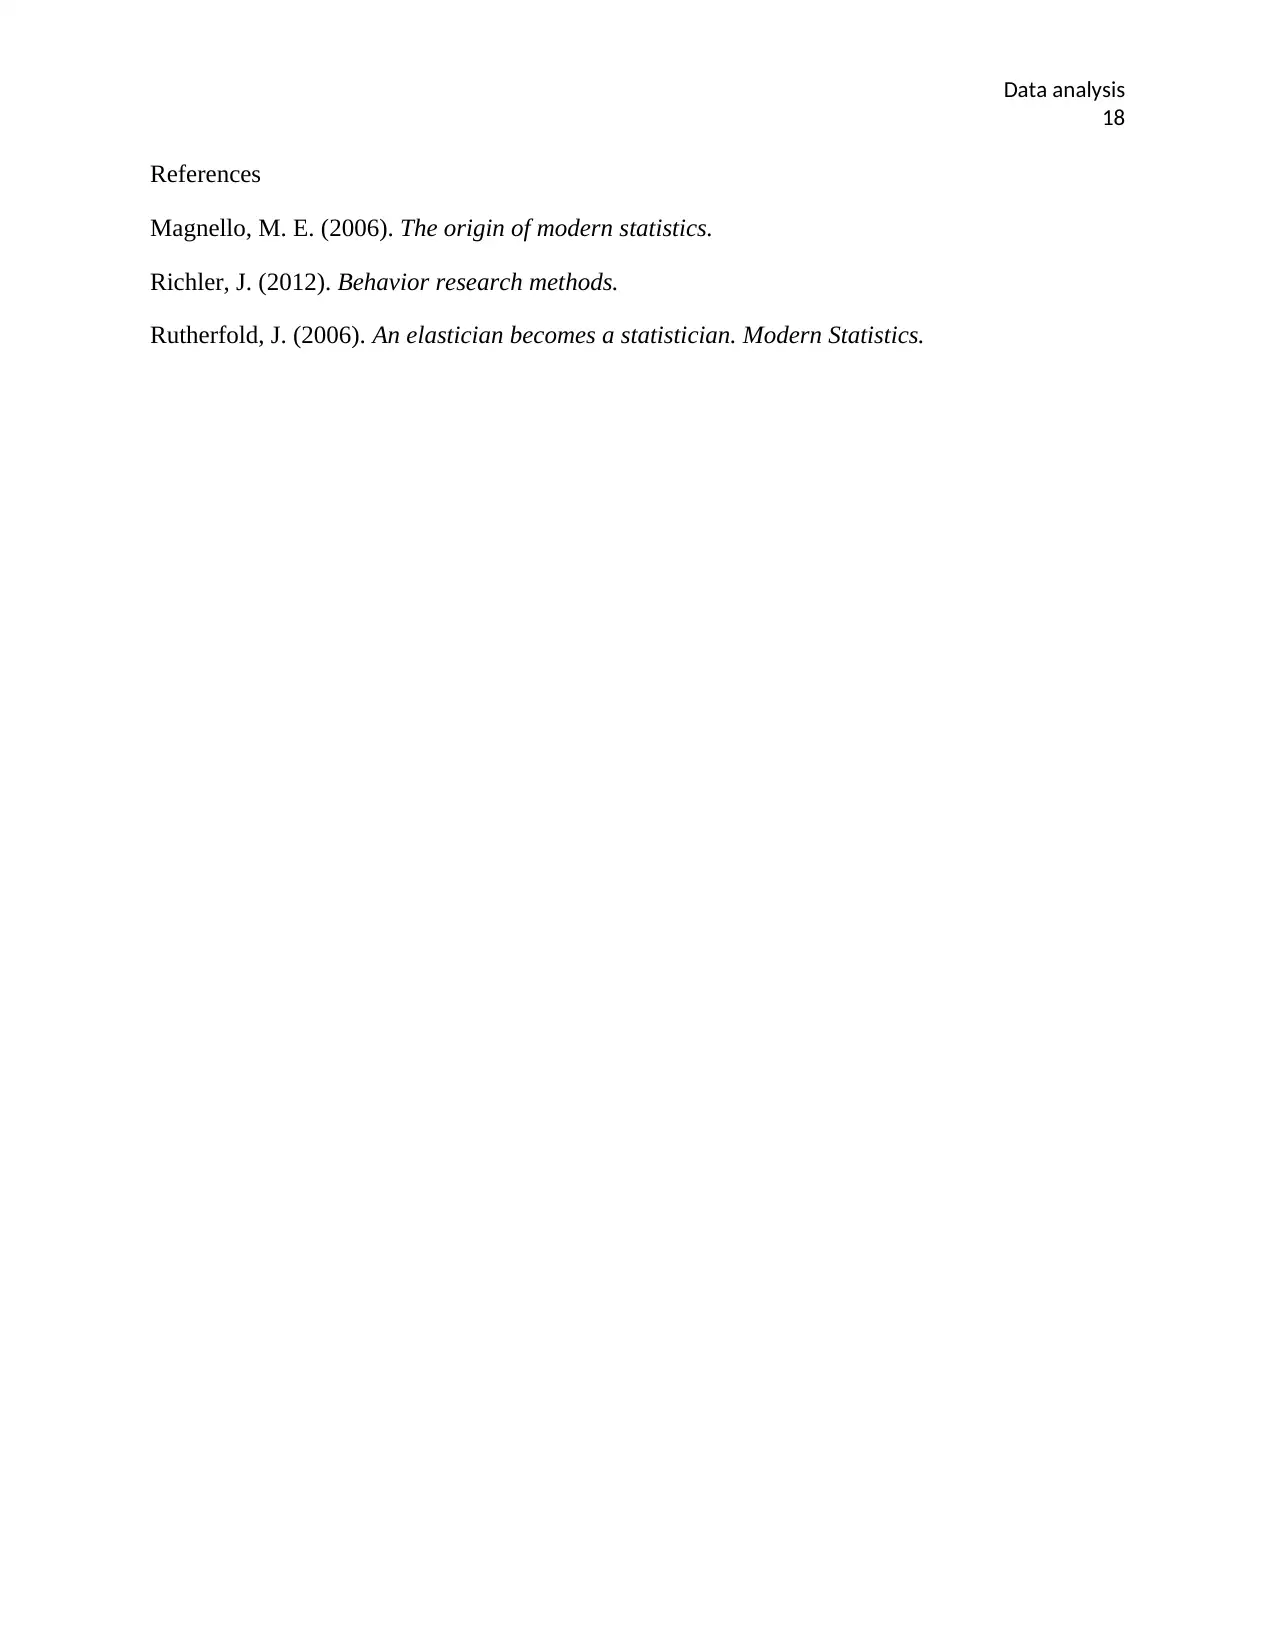
CMD CME CA CBLG CHSCPHMV CSTE CHS
17
10
4
7
19
1
10
3
0 0
2 1 0 0
3
1 0 1 2
0
5
4 4
1 1
3
0 1
Mode of transport by campus
CAR FOOT BIKE BUS
Figure 6.2
17
6.0 Bar charts on modes of transport
CAR FOOT BIKE BUS
16
1 1 2
21
2 4 4
31
3
7 8
Transport mode by staff
RESEARCH PROFESSIONAL ACADEMIC
Figure 6.1
CMD CME CA CBLG CHSCPHMV CSTE CHS
17
10
4
7
19
1
10
3
0 0
2 1 0 0
3
1 0 1 2
0
5
4 4
1 1
3
0 1
Mode of transport by campus
CAR FOOT BIKE BUS
Figure 6.2
Data analysis
18
References
Magnello, M. E. (2006). The origin of modern statistics.
Richler, J. (2012). Behavior research methods.
Rutherfold, J. (2006). An elastician becomes a statistician. Modern Statistics.
18
References
Magnello, M. E. (2006). The origin of modern statistics.
Richler, J. (2012). Behavior research methods.
Rutherfold, J. (2006). An elastician becomes a statistician. Modern Statistics.
1 out of 18
Related Documents


Your All-in-One AI-Powered Toolkit for Academic Success.
+13062052269
info@desklib.com
Available 24*7 on WhatsApp / Email
![[object Object]](/_next/static/media/star-bottom.7253800d.svg)
Unlock your academic potential
© 2024 | Zucol Services PVT LTD | All rights reserved.