BUS105 Computing Assignment - Doc
Added on 2020-05-16
10 Pages1368 Words88 Views
Running Head: BUS105 COMPUTING ASSIGNMENTBus105 computing assignmentName: Paras BhandariStudent number: 1600712Sample ID: 238
The assignment is based on the use of Excel to generate charts. Section one involves defining useful terms to be used in Ms Excel. Section two uses data to do regression. Using the line of best fit, an equation is developed and used to find different estimates. In this section, there is the use of wolframalpha.com to get the different values of Zscore. The consequent sections utilizes Ms Excel to come up with pivot tables and use comparisons of means to come up with the p-values.Section oneA dataset can be expounded as a collection of info that is related in one way or the next. One unique thing about a dataset is the fact that a dataset can be manipulated as a single unit by a computer while carrying out computations.Categorical variable: This is a variable that can go up against one of a restricted, and generally settled, number of conceivable values, assigning every individual or other unit of observation to a specific group or nominal classification based on some subjective property.A nominal variable can be explained as a categorical variable that lacks any significant order. In contrast, an ordinal variable can be said to be a categorical variable that possess a significant order.A ratio variable can be defined as a quantitative variable where a value of 0 does not amount to anything significant, for example, measure of power utilized.An interval variable on the other hand also qualifies as a quantitative variable only that in this case a value of 0 amounts to something significant, for example 00 Celsius.*Summarizing variables and the relationship(s) between themHistograms, Zscores, bar graphs, pivot tables and other charts are examples of useful outputs that can help describe relationships among different sets of data.*Why is important to be able to find patterns in a dataset using a computer
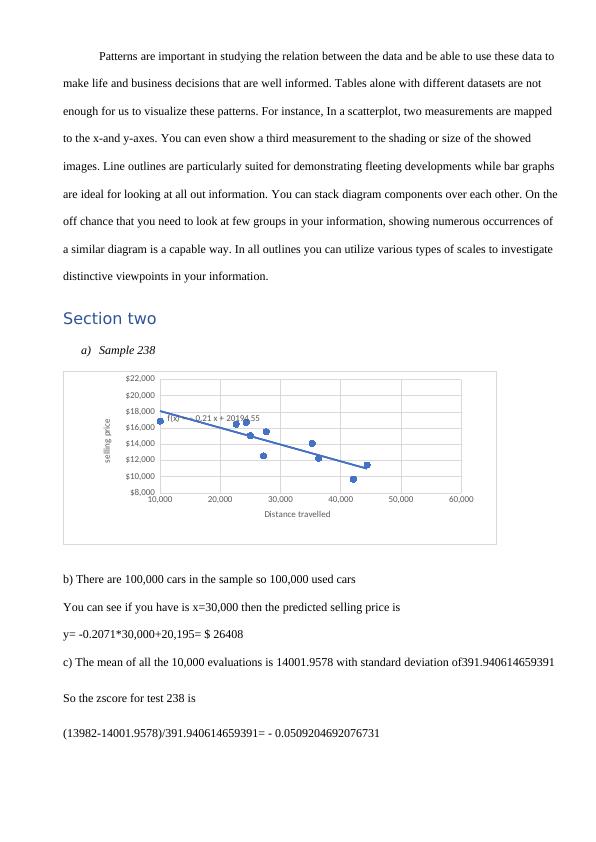
Patterns are important in studying the relation between the data and be able to use these data to make life and business decisions that are well informed. Tables alone with different datasets are not enough for us to visualize these patterns. For instance, In a scatterplot, two measurements are mapped to the x-and y-axes. You can even show a third measurement to the shading or size of the showed images. Line outlines are particularly suited for demonstrating fleeting developments while bar graphs are ideal for looking at all out information. You can stack diagram components over each other. On theoff chance that you need to look at few groups in your information, showing numerous occurrences of a similar diagram is a capable way. In all outlines you can utilize various types of scales to investigate distinctive viewpoints in your information.Section twoa)Sample 23810,00020,00030,00040,00050,00060,000$8,000 $10,000 $12,000 $14,000 $16,000 $18,000 $20,000 $22,000 f(x) = − 0.21 x + 20194.55Distance travelled sellingpriceb) There are 100,000 cars in the sample so 100,000 used cars You can see if you have is x=30,000 then the predicted selling price is y= -0.2071*30,000+20,195= $26408c) The mean of all the 10,000 evaluations is 14001.9578 with standard deviation of391.940614659391 So the zscore for test 238 is (13982-14001.9578)/391.940614659391= - 0.0509204692076731
End of preview
Want to access all the pages? Upload your documents or become a member.
Related Documents
Semester 1, 2018 BUS105 Computing Assignmentlg...
|13
|2177
|341
BUS105 Business Statistic Computing Assignmentlg...
|13
|1555
|43
BUS105 - Computing Assignmentlg...
|16
|2113
|29
bus105 Business Statistics - Computing Assignmentlg...
|15
|2313
|1534
BUS105- Computing Assignment Final Reportlg...
|11
|1700
|170
Table of contents for the study of z score and Z scorelg...
|18
|1639
|163