BUS501- Business Analytics and Statistics | Report
17 Pages3234 Words103 Views
University of the Sunshine Coast Queensland Australia
Business Analytics and Statistics (BUS501)
Added on 2020-03-16
BUS501- Business Analytics and Statistics | Report
University of the Sunshine Coast Queensland Australia
Business Analytics and Statistics (BUS501)
Added on 2020-03-16
ShareRelated Documents
Chapter: 1Business Analytics and StatisticsResearch ReportContentsChapter: 1Business Analytics and StatisticsResearch Report..............................................................11.1Introduction.................................................................................................................................11.2Definition of problem and the business intelligence required......................................................11.3Analytics method selected for the research..................................................................................11.4Scaling.........................................................................................................................................21.5Descriptive analysis.....................................................................................................................31.6What are the top/worst selling products in terms of sales?...........................................................51.7There a difference in payments methods?....................................................................................71.8Are the differences in sales performance based on where the product is located in the shop? How does this affect both profits and revenue?.......................................................................................91.9Is there a difference in sales and gross profits between different months of the year?...............111.10Are their differences in sales performance between different seasons?.....................................111.11Relationship between rainfall and profit....................................................................................131.12Impact of Rainfall and Staff cost on sales..................................................................................131.13Results from the analysis...........................................................................................................14
List of tables Table 1 Descriptive statistics of the variables included in the data set.........................................................6Table 2 Using ANOVA to test the difference in product location and sales.............................................10Table 3 Multiple comparison results from the ANOVA table...................................................................11Table 4 Using ANOVA table to show the results for difference in sales in month of the year..................12Table 5 ANOVA table for season wise difference....................................................................................13Table 6 Multiple comparison for season wise difference...........................................................................14Table 7 Relationship between rainfall and profit.......................................................................................14Table 8 Results from model summary.......................................................................................................15Table 9 Results from ANOVA..................................................................................................................15Table 10 Results from regression coefficients...........................................................................................15List of figures Figure 1 Variable in the data set and their scaling......................................................................................3Figure 2 Variable in the data set and their scaling.......................................................................................4Figure 3 finding the best and worst performers using the box plot.............................................................7Figure 4 Low cost of goods sold and high sales products............................................................................8Figure 5 Measuring difference in payment method from independent sample t test.................................10
1.1Introduction The main motive of every business is to maximize the profits. One can maximize the profit eitherby increasing the revenue or by decreasing the cost of goods sold. Increase in the marginbetween the price and the cost increases the profit.1.2Definition of problem and the business intelligence requiredIn this case the main challenge for the CEO is to increase the average sales of the product and atthe same time to decrease the cost of goods sold(Linof & Berry 2011; Chopra et al. 2011). Eventhough the business has started only two years ago, it is important for the company to makestrategies to cut the cost and increase sales. With such problem in hand, this research will try tofind the answers to the following questions:1.What are the top/worst selling products in terms of sales?2.Are the differences in sales performance based on where the product is located in theshop? How does this affect both profits and revenue?3.Is there a difference in sales and gross profits between different months of the year?4.Are their differences in sales performance between different seasons?5.What is the impact of rainfall and the staff cost on the sales?6.What is the impact of cost of goods sold and total sales on Net profit?1.3Analytics method selected for the researchOn the basis of the research question proposed in the above section, different analyticaltechniques have been used to find the answer. Data analysis was performed in Statistical Packagefor Social Science (SPSS). The first step was to import the data into SPSS correctly and scalethem properly. Apart from that various other statistical techniques such as regression analysis,correlation, ANOVA test, and independent t test and descriptive analysis has also beenperformed(Easterby-Smith et al. 2008; Creswell 2003; Rajasekar et al. 2013). In the first sectionthe scaling and the descriptive analysis have been performed followed by other statistical tests.1.4ScalingAs the first step variable in the SPSS are scaled as the properties of the variables. Mainly thereare three types of scaling that can be used for any variable. This includes nominal, ordinal andratio/interval. The ordinal and the nominal are used for the categorical variable whereas the ratiois used for the continuous variable.
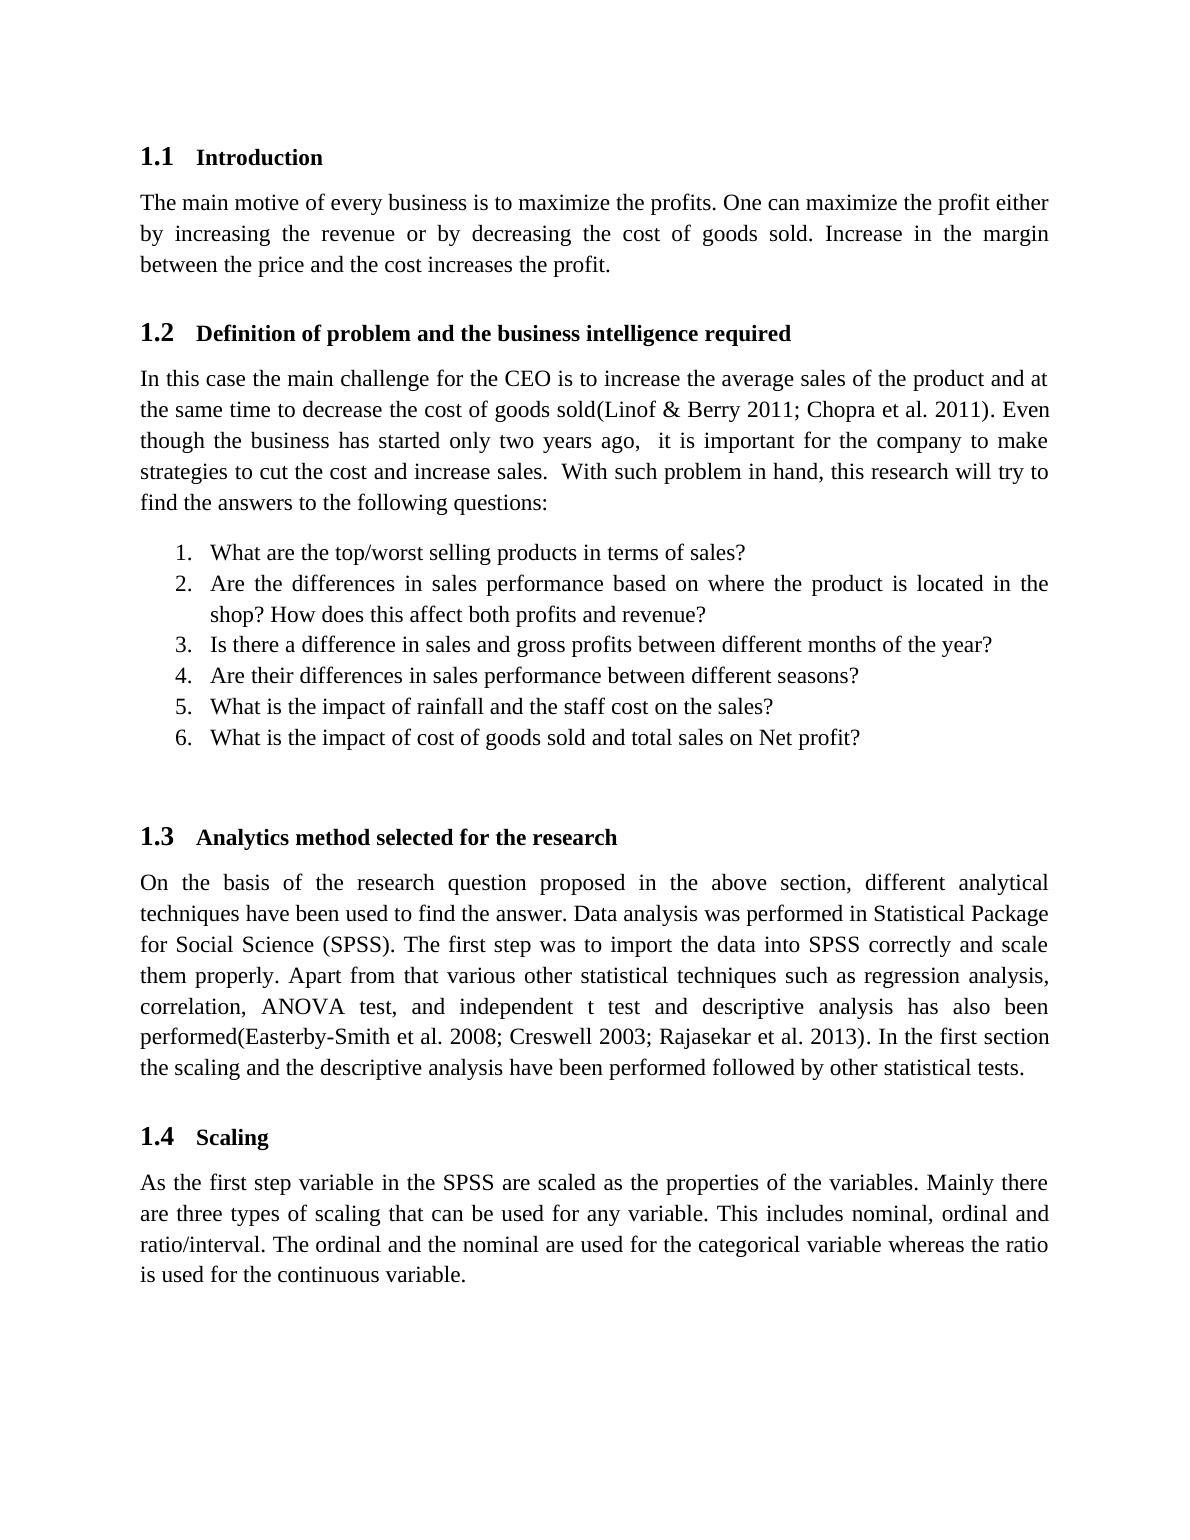
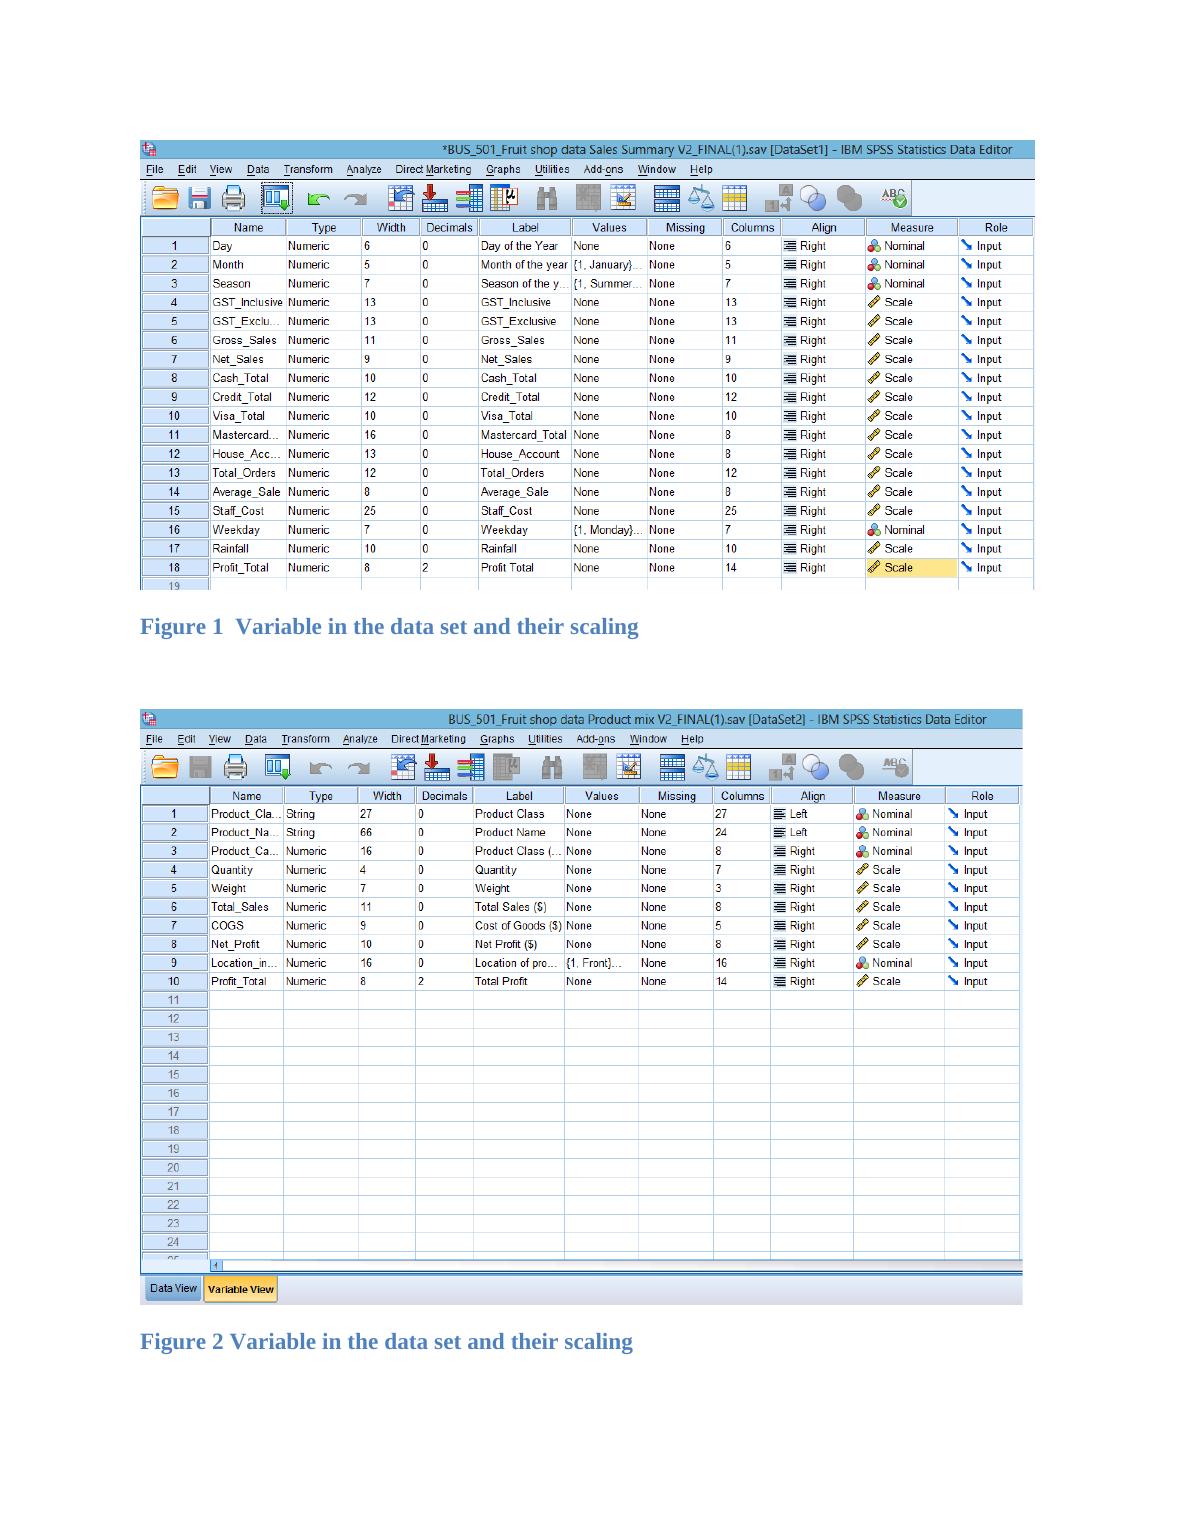
Figure 1 Variable in the data set and their scalingFigure 2 Variable in the data set and their scaling
End of preview
Want to access all the pages? Upload your documents or become a member.
Related Documents
Business Analytics and Statistics Assignment - Revenue Analysislg...
|15
|2570
|33
BUS501 Business Analytics and Statistics : Assignmentlg...
|18
|2940
|327
Business Analytics and Statistics Student Name: 6th October 2017 Introduction 3 Problem Definition 3 Analysis and Findingslg...
|17
|2998
|483
Accounting Fundamentals Assignmentlg...
|19
|2314
|86
Business Analytics and Statistics Research Report - Deskliblg...
|27
|4777
|498
Business Analysis and Statistics Assignmentlg...
|19
|4103
|115