BUS708 Statistics and Data Analysis - Doc
Added on 2021-05-27
9 Pages2145 Words37 Views
Running head: DATA ANALYSIS1BUS708 Statistics and Data AnalysisStatistical Modeling AssignmentTrimester 1, 2018Student NameInstitution
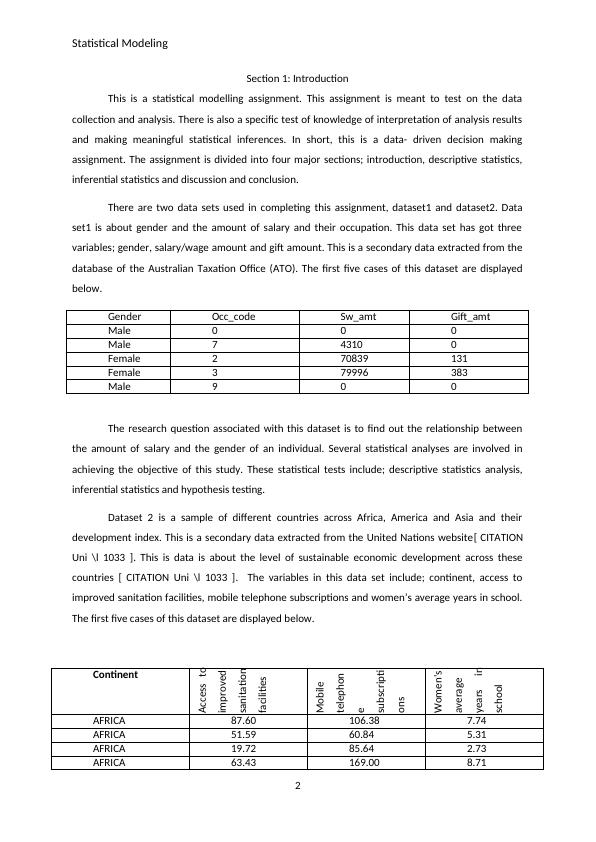
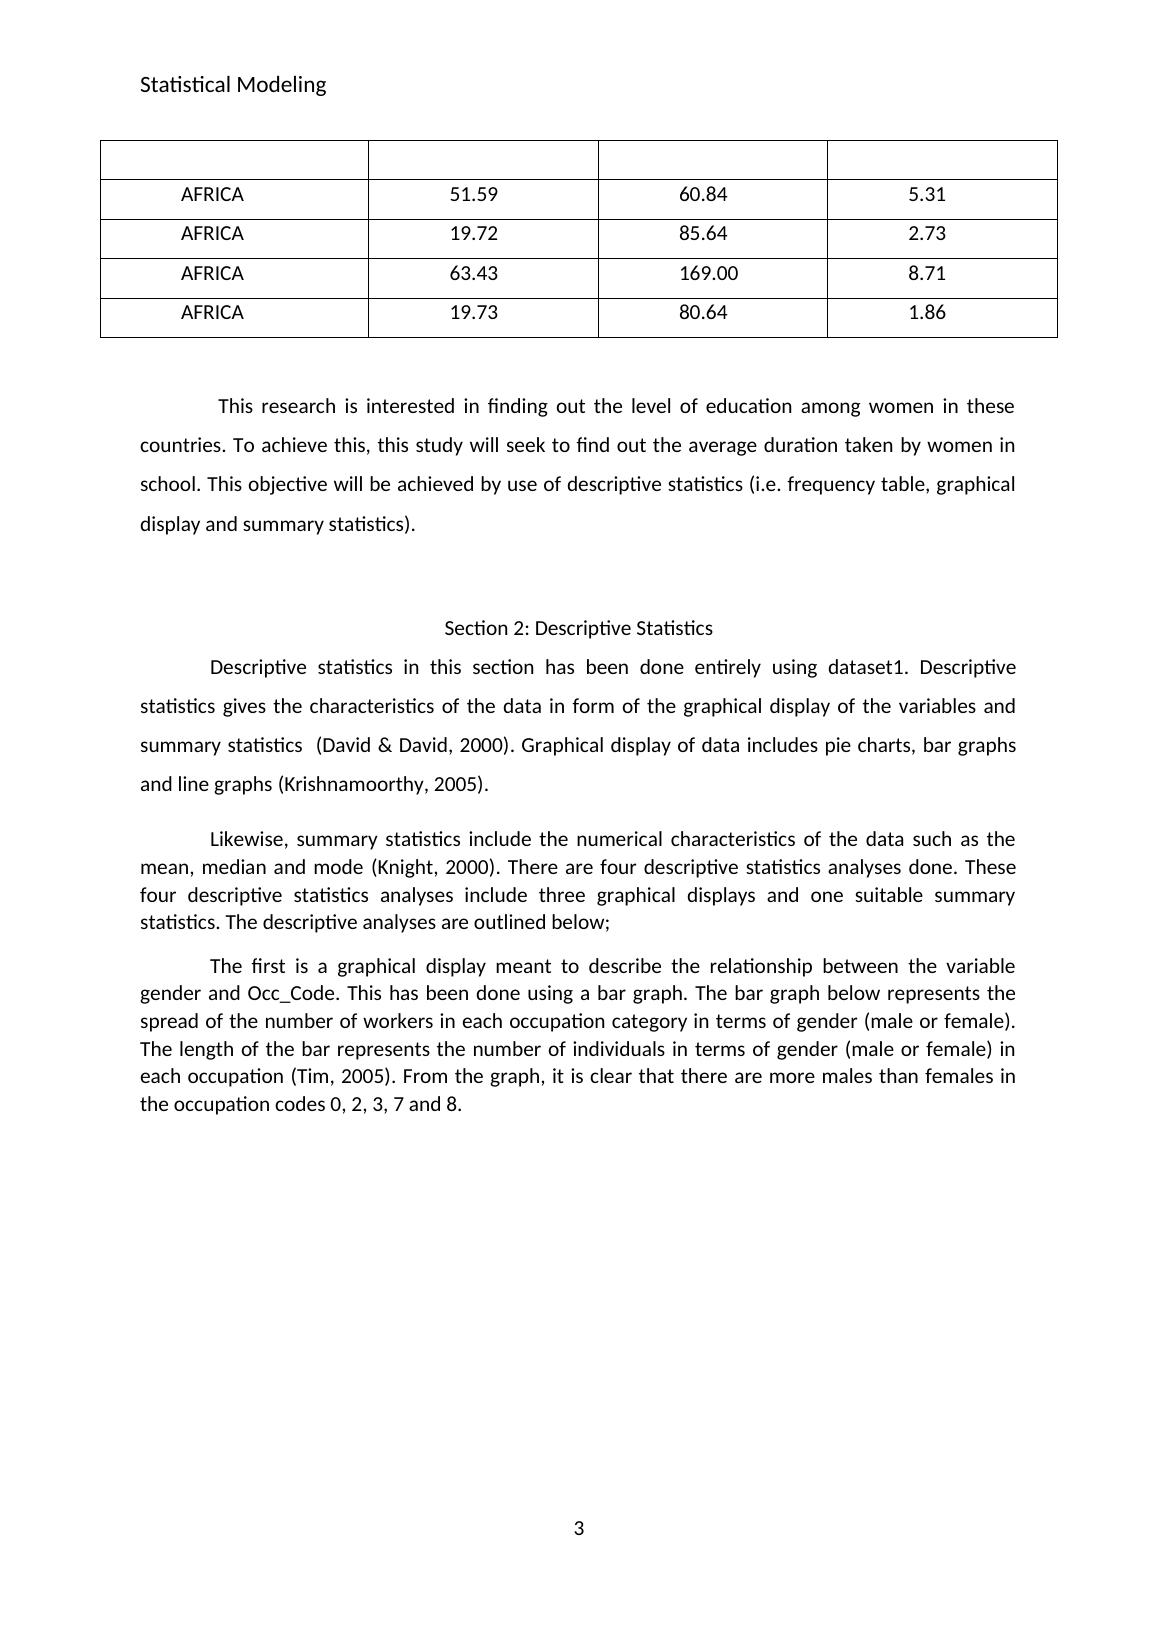
Statistical ModelingSection 1: IntroductionThis is a statistical modelling assignment. This assignment is meant to test on the datacollection and analysis. There is also a specific test of knowledge of interpretation of analysis resultsand making meaningful statistical inferences. In short, this is a data- driven decision makingassignment. The assignment is divided into four major sections; introduction, descriptive statistics,inferential statistics and discussion and conclusion.There are two data sets used in completing this assignment, dataset1 and dataset2. Dataset1 is about gender and the amount of salary and their occupation. This data set has got threevariables; gender, salary/wage amount and gift amount. This is a secondary data extracted from thedatabase of the Australian Taxation Office (ATO). The first five cases of this dataset are displayedbelow. GenderOcc_codeSw_amtGift_amtMale000Male743100Female270839131Female379996383Male900The research question associated with this dataset is to find out the relationship betweenthe amount of salary and the gender of an individual. Several statistical analyses are involved inachieving the objective of this study. These statistical tests include; descriptive statistics analysis,inferential statistics and hypothesis testing. Dataset 2 is a sample of different countries across Africa, America and Asia and theirdevelopment index. This is a secondary data extracted from the United Nations website[ CITATIONUni \l 1033 ]. This is data is about the level of sustainable economic development across thesecountries [ CITATION Uni \l 1033 ]. The variables in this data set include; continent, access toimproved sanitation facilities, mobile telephone subscriptions and women’s average years in school.The first five cases of this dataset are displayed below.Continent AccesstoimprovedsanitationfacilitiesMobiletelephonesubscriptionsWomen'saverageyearsinschoolAFRICA87.60106.387.74AFRICA51.5960.845.31AFRICA19.7285.642.73AFRICA63.43169.008.712
Statistical ModelingAFRICA19.7380.641.86 This research is interested in finding out the level of education among women in thesecountries. To achieve this, this study will seek to find out the average duration taken by women inschool. This objective will be achieved by use of descriptive statistics (i.e. frequency table, graphicaldisplay and summary statistics). Section 2: Descriptive StatisticsDescriptive statistics in this section has been done entirely using dataset1. Descriptivestatistics gives the characteristics of the data in form of the graphical display of the variables andsummary statistics [CITATION Dav00 \l 1033 ]. Graphical display of data includes pie charts, bargraphs and line graphs [ CITATION Kri \l 1033 ]. Likewise, summary statistics include the numerical characteristics of the data such as themean, median and mode[ CITATION Kni00 \l 1033 ]. There are four descriptive statistics analysesdone. These four descriptive statistics analyses include three graphical displays and one suitablesummary statistics. The descriptive analyses are outlined below;The first is a graphical display meant to describe the relationship between the variablegender and Occ_Code. This has been done using a bar graph. The bar graph below represents thespread of the number of workers in each occupation category in terms of gender (male or female).The length of the bar represents the number of individuals in terms of gender (male or female) ineach occupation[ CITATION Tim05 \l 1033 ]. From the graph, it is clear that there are more malesthan females in the occupation codes 0, 2, 3, 7 and 8. Occ_code0123456789020406080100120A Bar Graph of Number of Individuals in occupation Against GenderMaleFemaleOCC_CodeFrequency3
End of preview
Want to access all the pages? Upload your documents or become a member.
Related Documents
Gender Differences in Salary - PDFlg...
|11
|1984
|130
A Study of Salary and Occupation Relationship in Australialg...
|11
|1942
|358
Statistics Assignment- Problem Analysislg...
|35
|10898
|40
Statistical Modelling Assignment Samplelg...
|9
|1909
|34
Statistical Modelling - Assignment PDFlg...
|11
|1983
|83
Statistics: Analysis of Gender Gap in Salarylg...
|12
|2238
|347