Statistics Assignment- Problem Analysis
Added on 2020-05-28
35 Pages10898 Words40 Views
Running head: PROBLEM ANALYSIS AND STATISTICSProblem Analysis and StatisticsName of the Student:Name of the University:Author’s note:

1PROBLEM ANALYSIS AND STATISTICSTable of Contents1. Section 1: Introduction............................................................................................................................................................................................3a) Brief introduction about the assignment:............................................................................................................................................................3b) Dataset 1:...........................................................................................................................................................................................................3c) Dataset 2:.............................................................................................................................................................................................................32. Section 2: Lodgement Method-Dataset 1...............................................................................................................................................................3A) Part a...................................................................................................................................................................................................................3B) Part b...................................................................................................................................................................................................................4C) Part c...................................................................................................................................................................................................................43. Section 3: Lodgement Method-Dataset2.................................................................................................................................................................4A) Part a...................................................................................................................................................................................................................4B) Part b...................................................................................................................................................................................................................5C) Part c...................................................................................................................................................................................................................54. Section 4: Lodgement Method and Age group-Dataset1:........................................................................................................................................6A) Part a...................................................................................................................................................................................................................6B) Part b.................................................................................................................................................................................................................10C) Part c.................................................................................................................................................................................................................115. Section 5: Lodgement Method and Total Income Amount-Dataset1:....................................................................................................................11A) Part a.................................................................................................................................................................................................................11B) Part b.................................................................................................................................................................................................................136. Section 6: Total Income Amount and Deduction Amount-Data set 1:...................................................................................................................16A) Part a.................................................................................................................................................................................................................16B) Part b.................................................................................................................................................................................................................19Correlation:.......................................................................................................................................................................................................19Regression:........................................................................................................................................................................................................197. Section7: Conclusion..............................................................................................................................................................................................20A) Part a.................................................................................................................................................................................................................20B) Part b: Further Research...................................................................................................................................................................................20References:................................................................................................................................................................................................................21Appendices:...............................................................................................................................................................................................................22Dataset 1:..............................................................................................................................................................................................................22Dataset 2:..............................................................................................................................................................................................................36
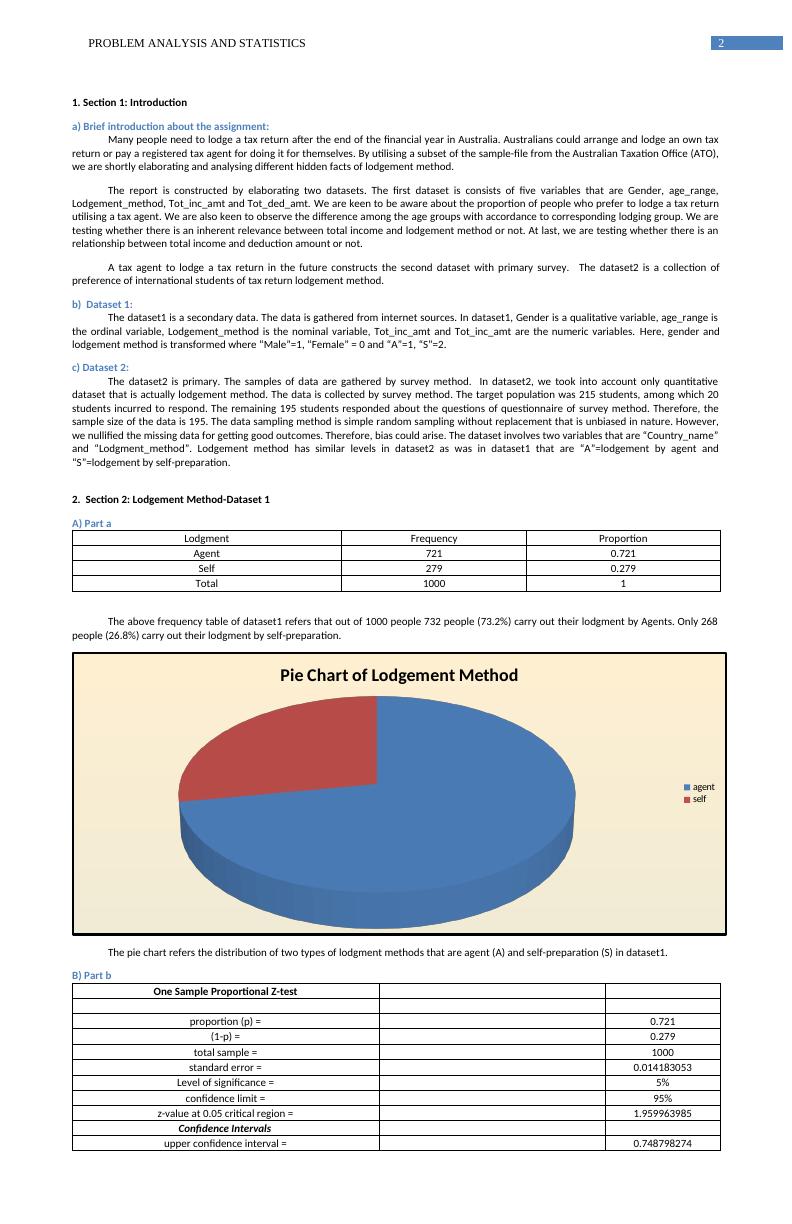
2PROBLEM ANALYSIS AND STATISTICS1. Section 1: Introductiona) Brief introduction about the assignment:Many people need to lodge a tax return after the end of the financial year in Australia. Australians could arrange and lodge an own taxreturn or pay a registered tax agent for doing it for themselves. By utilising a subset of the sample-file from the Australian Taxation Office (ATO),we are shortly elaborating and analysing different hidden facts of lodgement method. The report is constructed by elaborating two datasets. The first dataset is consists of five variables that are Gender, age_range,Lodgement_method, Tot_inc_amt and Tot_ded_amt. We are keen to be aware about the proportion of people who prefer to lodge a tax returnutilising a tax agent. We are also keen to observe the difference among the age groups with accordance to corresponding lodging group. We aretesting whether there is an inherent relevance between total income and lodgement method or not. At last, we are testing whether there is anrelationship between total income and deduction amount or not. A tax agent to lodge a tax return in the future constructs the second dataset with primary survey. The dataset2 is a collection ofpreference of international students of tax return lodgement method. b) Dataset 1:The dataset1 is a secondary data. The data is gathered from internet sources. In dataset1, Gender is a qualitative variable, age_range isthe ordinal variable, Lodgement_method is the nominal variable, Tot_inc_amt and Tot_inc_amt are the numeric variables. Here, gender andlodgement method is transformed where “Male”=1, “Female” = 0 and “A”=1, “S”=2.c) Dataset 2:The dataset2 is primary. The samples of data are gathered by survey method. In dataset2, we took into account only quantitativedataset that is actually lodgement method. The data is collected by survey method. The target population was 215 students, among which 20students incurred to respond. The remaining 195 students responded about the questions of questionnaire of survey method. Therefore, thesample size of the data is 195. The data sampling method is simple random sampling without replacement that is unbiased in nature. However,we nullified the missing data for getting good outcomes. Therefore, bias could arise. The dataset involves two variables that are “Country_name”and “Lodgment_method”. Lodgement method has similar levels in dataset2 as was in dataset1 that are “A”=lodgement by agent and“S”=lodgement by self-preparation. 2. Section 2: Lodgement Method-Dataset 1A) Part aLodgmentFrequencyProportionAgent7210.721Self2790.279Total 10001The above frequency table of dataset1 refers that out of 1000 people 732 people (73.2%) carry out their lodgment by Agents. Only 268people (26.8%) carry out their lodgment by self-preparation. Pie Chart of Lodgement Methodagent self The pie chart refers the distribution of two types of lodgment methods that are agent (A) and self-preparation (S) in dataset1.B) Part bOne Sample Proportional Z-testproportion (p) =0.721(1-p) =0.279total sample =1000standard error =0.014183053Level of significance =5%confidence limit =95%z-value at 0.05 critical region =1.959963985Confidence Intervalsupper confidence interval =0.748798274
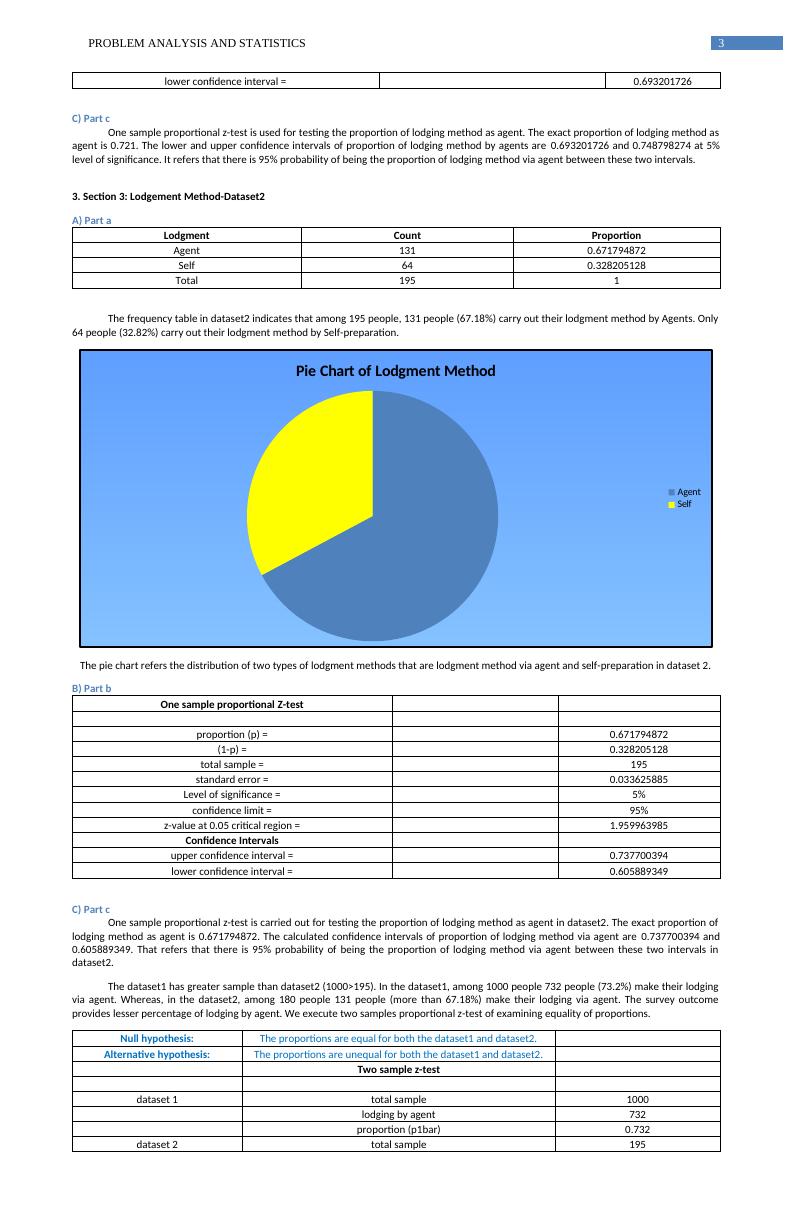
3PROBLEM ANALYSIS AND STATISTICSlower confidence interval =0.693201726C) Part cOne sample proportional z-test is used for testing the proportion of lodging method as agent. The exact proportion of lodging method asagent is 0.721. The lower and upper confidence intervals of proportion of lodging method by agents are 0.693201726 and 0.748798274 at 5%level of significance. It refers that there is 95% probability of being the proportion of lodging method via agent between these two intervals.3. Section 3: Lodgement Method-Dataset2A) Part aLodgmentCountProportionAgent1310.671794872Self640.328205128Total1951The frequency table in dataset2 indicates that among 195 people, 131 people (67.18%) carry out their lodgment method by Agents. Only64 people (32.82%) carry out their lodgment method by Self-preparation.Pie Chart of Lodgment MethodAgent Self The pie chart refers the distribution of two types of lodgment methods that are lodgment method via agent and self-preparation in dataset 2.B) Part bOne sample proportional Z-testproportion (p) =0.671794872(1-p) =0.328205128total sample =195standard error =0.033625885Level of significance =5%confidence limit =95%z-value at 0.05 critical region =1.959963985Confidence Intervalsupper confidence interval =0.737700394lower confidence interval =0.605889349C) Part cOne sample proportional z-test is carried out for testing the proportion of lodging method as agent in dataset2. The exact proportion oflodging method as agent is 0.671794872. The calculated confidence intervals of proportion of lodging method via agent are 0.737700394 and0.605889349. That refers that there is 95% probability of being the proportion of lodging method via agent between these two intervals indataset2.The dataset1 has greater sample than dataset2 (1000>195). In the dataset1, among 1000 people 732 people (73.2%) make their lodgingvia agent. Whereas, in the dataset2, among 180 people 131 people (more than 67.18%) make their lodging via agent. The survey outcomeprovides lesser percentage of lodging by agent. We execute two samples proportional z-test of examining equality of proportions. Null hypothesis:The proportions are equal for both the dataset1 and dataset2.Alternative hypothesis:The proportions are unequal for both the dataset1 and dataset2.Two sample z-testdataset 1total sample1000lodging by agent732proportion (p1bar)0.732dataset 2total sample195
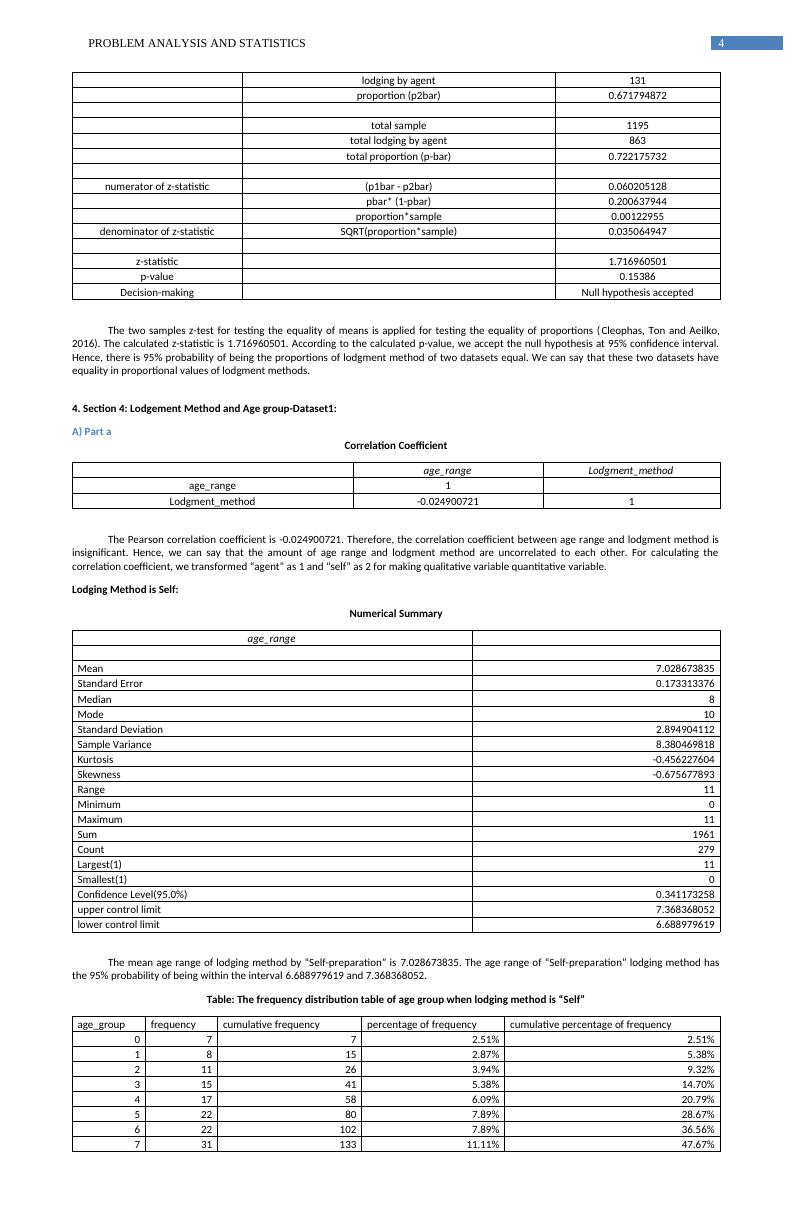
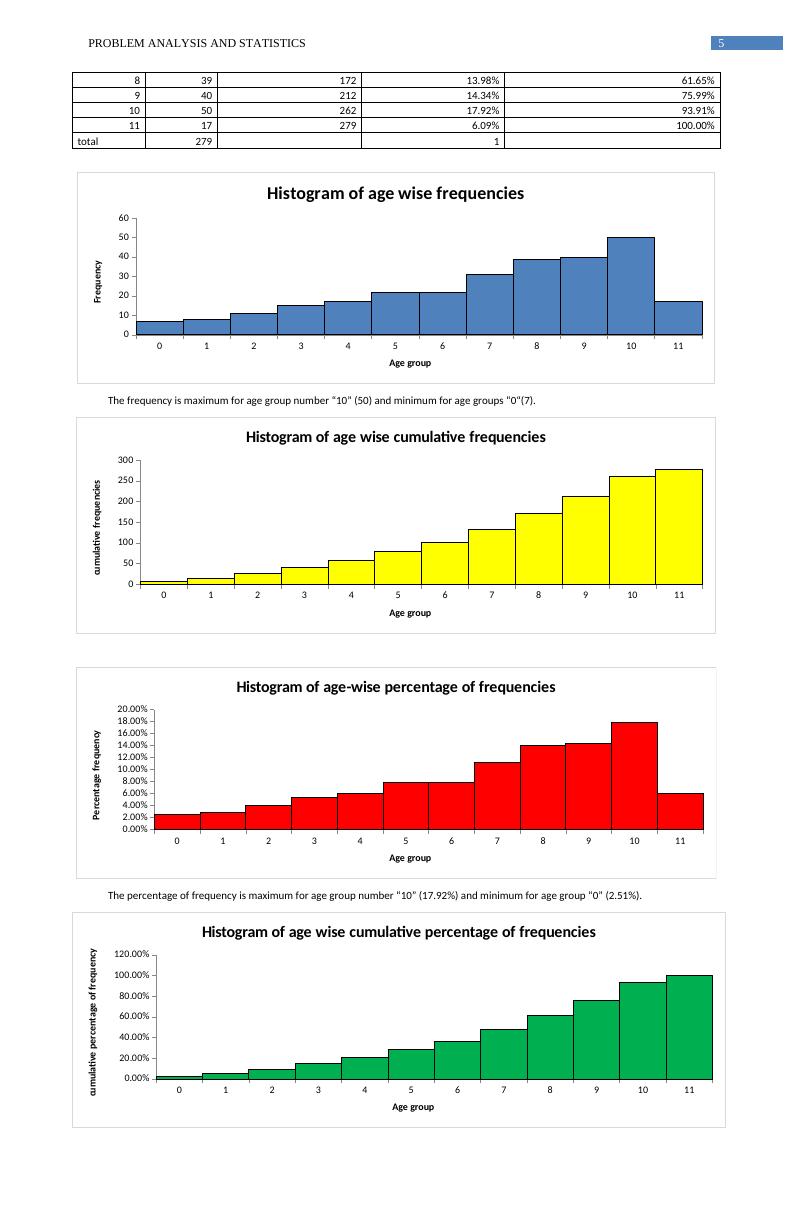
4PROBLEM ANALYSIS AND STATISTICSlodging by agent131proportion (p2bar)0.671794872total sample1195total lodging by agent863total proportion (p-bar)0.722175732numerator of z-statistic(p1bar - p2bar)0.060205128pbar* (1-pbar)0.200637944proportion*sample0.00122955denominator of z-statisticSQRT(proportion*sample)0.035064947z-statistic1.716960501p-value0.15386Decision-makingNull hypothesis acceptedThe two samples z-test for testing the equality of means is applied for testing the equality of proportions (Cleophas, Ton and Aeilko,2016). The calculated z-statistic is 1.716960501. According to the calculated p-value, we accept the null hypothesis at 95% confidence interval.Hence, there is 95% probability of being the proportions of lodgment method of two datasets equal. We can say that these two datasets haveequality in proportional values of lodgment methods. 4. Section 4: Lodgement Method and Age group-Dataset1:A) Part aCorrelation Coefficientage_rangeLodgment_methodage_range1Lodgment_method-0.0249007211The Pearson correlation coefficient is -0.024900721. Therefore, the correlation coefficient between age range and lodgment method isinsignificant. Hence, we can say that the amount of age range and lodgment method are uncorrelated to each other. For calculating thecorrelation coefficient, we transformed “agent” as 1 and “self” as 2 for making qualitative variable quantitative variable.Lodging Method is Self:Numerical Summaryage_rangeMean7.028673835Standard Error0.173313376Median8Mode10Standard Deviation2.894904112Sample Variance8.380469818Kurtosis-0.456227604Skewness-0.675677893Range11Minimum0Maximum11Sum1961Count279Largest(1)11Smallest(1)0Confidence Level(95.0%)0.341173258upper control limit7.368368052lower control limit6.688979619The mean age range of lodging method by “Self-preparation” is 7.028673835. The age range of “Self-preparation” lodging method hasthe 95% probability of being within the interval 6.688979619 and 7.368368052.Table: The frequency distribution table of age group when lodging method is “Self”age_groupfrequencycumulative frequencypercentage of frequencycumulative percentage of frequency0772.51%2.51%18152.87%5.38%211263.94%9.32%315415.38%14.70%417586.09%20.79%522807.89%28.67%6221027.89%36.56%73113311.11%47.67%
5PROBLEM ANALYSIS AND STATISTICS83917213.98%61.65%94021214.34%75.99%105026217.92%93.91%11172796.09%100.00%total2791012345678910110102030405060Histogram of age wise frequenciesAge groupFrequencyThe frequency is maximum for age group number “10” (50) and minimum for age groups “0“(7).01234567891011050100150200250300Histogram of age wise cumulative frequenciesAge groupcumulativefrequencies012345678910110.00%2.00%4.00%6.00%8.00%10.00%12.00%14.00%16.00%18.00%20.00%Histogram of age-wise percentage of frequenciesAge groupPercentagefrequencyThe percentage of frequency is maximum for age group number “10” (17.92%) and minimum for age group “0” (2.51%).012345678910110.00%20.00%40.00%60.00%80.00%100.00%120.00%Histogram of age wise cumulative percentage of frequenciesAge groupcumulativepercentageoffrequency
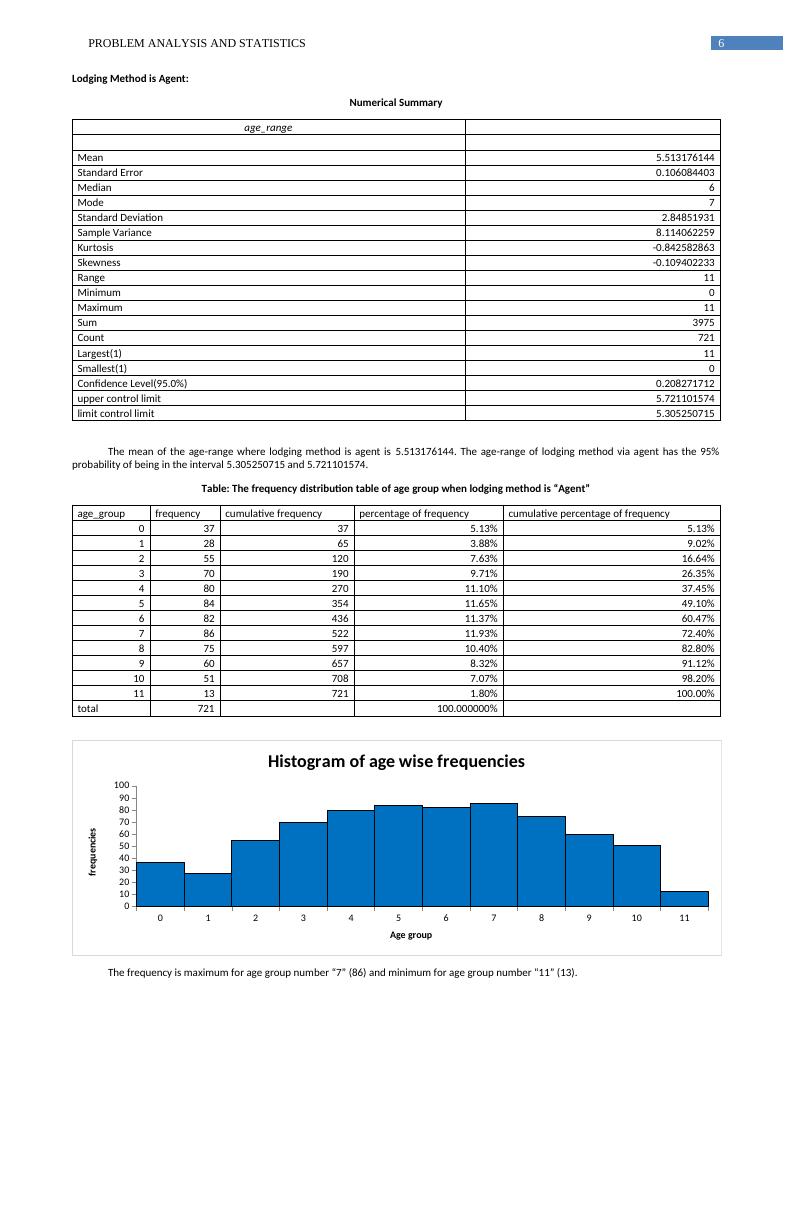
6PROBLEM ANALYSIS AND STATISTICSLodging Method is Agent:Numerical Summaryage_rangeMean5.513176144Standard Error0.106084403Median6Mode7Standard Deviation2.84851931Sample Variance8.114062259Kurtosis-0.842582863Skewness-0.109402233Range11Minimum0Maximum11Sum3975Count721Largest(1)11Smallest(1)0Confidence Level(95.0%)0.208271712upper control limit5.721101574limit control limit5.305250715The mean of the age-range where lodging method is agent is 5.513176144. The age-range of lodging method via agent has the 95%probability of being in the interval 5.305250715 and 5.721101574.Table: The frequency distribution table of age group when lodging method is “Agent”age_groupfrequencycumulative frequencypercentage of frequencycumulative percentage of frequency037375.13%5.13%128653.88%9.02%2551207.63%16.64%3701909.71%26.35%48027011.10%37.45%58435411.65%49.10%68243611.37%60.47%78652211.93%72.40%87559710.40%82.80%9606578.32%91.12%10517087.07%98.20%11137211.80%100.00%total721100.000000%012345678910110102030405060708090100Histogram of age wise frequenciesAge groupfrequenciesThe frequency is maximum for age group number “7” (86) and minimum for age group number “11” (13).
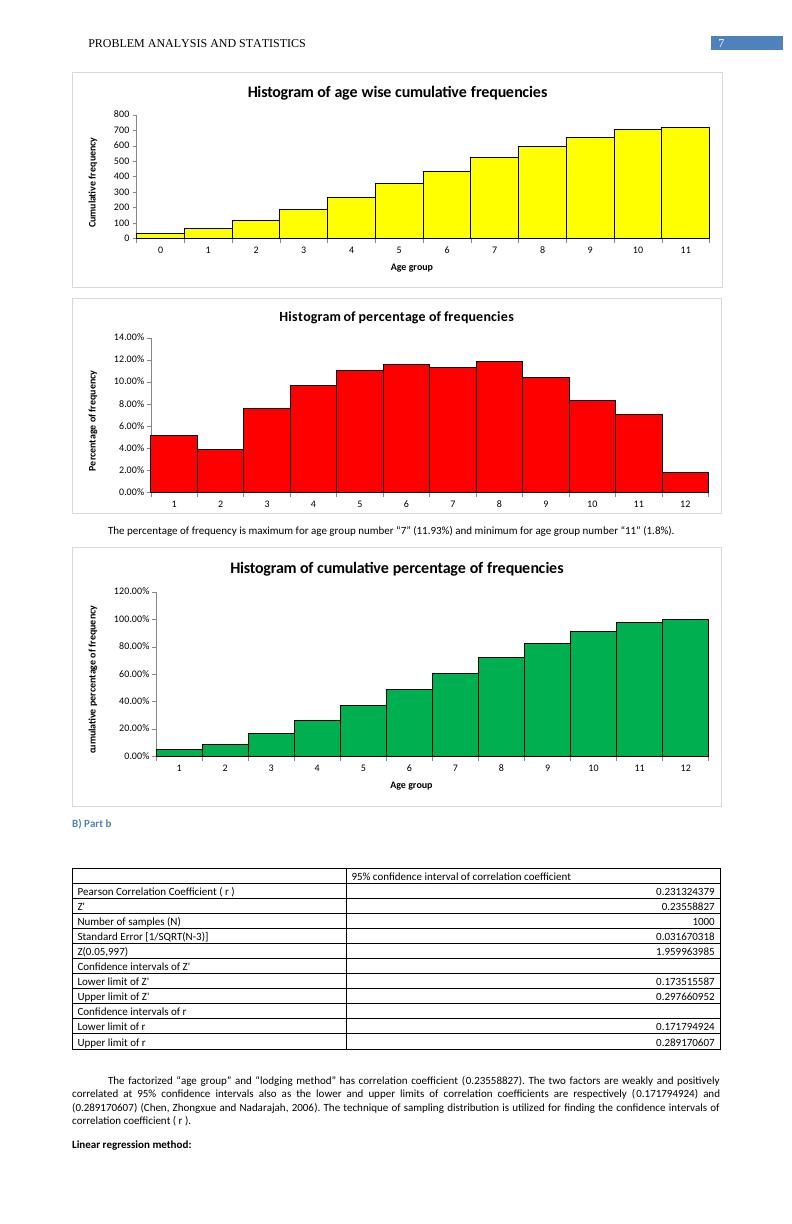
7PROBLEM ANALYSIS AND STATISTICS012345678910110100200300400500600700800Histogram of age wise cumulative frequenciesAge groupCumulativefrequency1234567891011120.00%2.00%4.00%6.00%8.00%10.00%12.00%14.00%Histogram of percentage of frequenciesPercentageoffrequencyThe percentage of frequency is maximum for age group number “7” (11.93%) and minimum for age group number “11” (1.8%).1234567891011120.00%20.00%40.00%60.00%80.00%100.00%120.00%Histogram of cumulative percentage of frequenciesAge groupcumulativepercentageoffrequencyB) Part b95% confidence interval of correlation coefficientPearson Correlation Coefficient ( r )0.231324379Z'0.23558827Number of samples (N)1000Standard Error [1/SQRT(N-3)]0.031670318Z(0.05,997)1.959963985Confidence intervals of Z'Lower limit of Z'0.173515587Upper limit of Z'0.297660952Confidence intervals of rLower limit of r0.171794924Upper limit of r0.289170607The factorized “age group” and “lodging method” has correlation coefficient (0.23558827). The two factors are weakly and positivelycorrelated at 95% confidence intervals also as the lower and upper limits of correlation coefficients are respectively (0.171794924) and(0.289170607) (Chen, Zhongxue and Nadarajah, 2006). The technique of sampling distribution is utilized for finding the confidence intervals ofcorrelation coefficient ( r ).Linear regression method:
End of preview
Want to access all the pages? Upload your documents or become a member.
Related Documents
Statistics Assignment: Problem Analysislg...
|35
|10020
|44
Taxation Assignment | Statistics Data Assignmentlg...
|9
|3085
|40
BUS708 Statistics and Data Analysis Name of the University Authorlg...
|13
|2322
|237
Article on Analysis of Individual Tax Returnlg...
|11
|3472
|61
BUS708 Statistics and Data Analysis : Assignmentlg...
|11
|1933
|211
BUS708 - Statistics and Data Analysislg...
|16
|2432
|58