Business Analytics: Cost, Revenue, Profit, Correlation, and Breakeven
VerifiedAdded on 2023/06/04
|14
|3859
|315
Report
AI Summary
This business analytics report provides a detailed analysis of cost and revenue behavior, profit and loss calculations, and five-year projections for KB Ltd. It includes the development of a mathematical model for profit calculation, analysis of correlation between advertising expenditure and sales using the correlation coefficient and scatter diagrams, and calculation of breakeven points and margin of safety. The report also compares target profit with actual profit and analyzes the benefits and limitations of the breakeven model. The analysis utilizes business analytic techniques to provide insights into decision-making, data analysis, and statistical modeling, focusing on enhancing business performance through understanding cost functions and market dynamics.
Business Analytic
Paraphrase This Document
Need a fresh take? Get an instant paraphrase of this document with our AI Paraphraser
Contents
INTRODUCTION...........................................................................................................................3
MAIN BODY...................................................................................................................................3
Question 1........................................................................................................................................3
a) Developing a mathematical model using the given cost information................................3
b) Calculating the profit or loss using the given information.................................................4
c) Five year projection from January 2023 considering given adjustments...........................4
d) Analysing the cost and revenue behaviour of KB Ltd, before and after projections.........5
Question 2........................................................................................................................................6
a) Calculation of correlation coefficient and analysis of the results......................................6
b) Scatter diagram of data and analysing the pattern of relationship among two given variables
................................................................................................................................................7
c) Analysis of impact of advertising expenditure on sales, and other relevant marketing tactics
................................................................................................................................................8
Question 3........................................................................................................................................9
a) Calculation of breakeven point and margin of safety.........................................................9
b) Comparing the target profit with the actual one.................................................................9
c) Breakeven chart................................................................................................................10
d) Analysing the benefits and limitations of breakeven model............................................11
CONCLUSION..............................................................................................................................13
REFERENCES..............................................................................................................................14
INTRODUCTION
Business analytics can be defined as a collection of restraints and methods for elucidating
business related problems utilising data analysis, quantitative techniques and other statistical
models. This involves repetitive and systematic examination of a company’s data focusing on
statistical analysis to drive decision making. Data-driven businesses are actively seeking ways to
treat their data as an asset of business and turning it in a competitive edge. The success of
business analytics rely upon the quality of data and skilled analysts who have an understanding
of technology and business, and a commitment to utilising data to generate understandings that
drive business decisions (Ariyarathna. and Peter, 2018). The report includes the brief analysis
and answers of the first three case studies in the given assessment. The questions includes the
analysis of costing and revenues behaviour, calculating profit or loss, correlation coefficient,
breakeven point and margin of safety, the costing projections, plotting scatter diagram, analysis
of the impact that comes due to expenses incurred on sales , the benefits and limitations of
breakeven model and much more.
MAIN BODY
Question 1
a) Development of a mathematical model by using the information regarding cost that has been
given
There is a mathematical model known as profit model which is a linear deterministic
algebraic model utilised implicitly by most of the cost accountants. It gives a framework for
modelling elements of cost like material, multi products, depreciation, etc. starting with profit
equals to sales subtracted by costs. It assist with a mutable theoretical foundation for spreadsheet
modellers. It allows modellers to run deterministic replications or “what if” type modelling to see
the effect of changes in price or quantity, or cost on profitability (Arora, 2018).
π = pq – (Fn + wq)
Where π stands for profit, p for sales price, Fn stands for fixed cost, w is variable per unit sold
and q stands for quantity sold.
⊘ This is a preview!⊘
Do you want full access?
Subscribe today to unlock all pages.
Trusted by 1+ million students worldwide
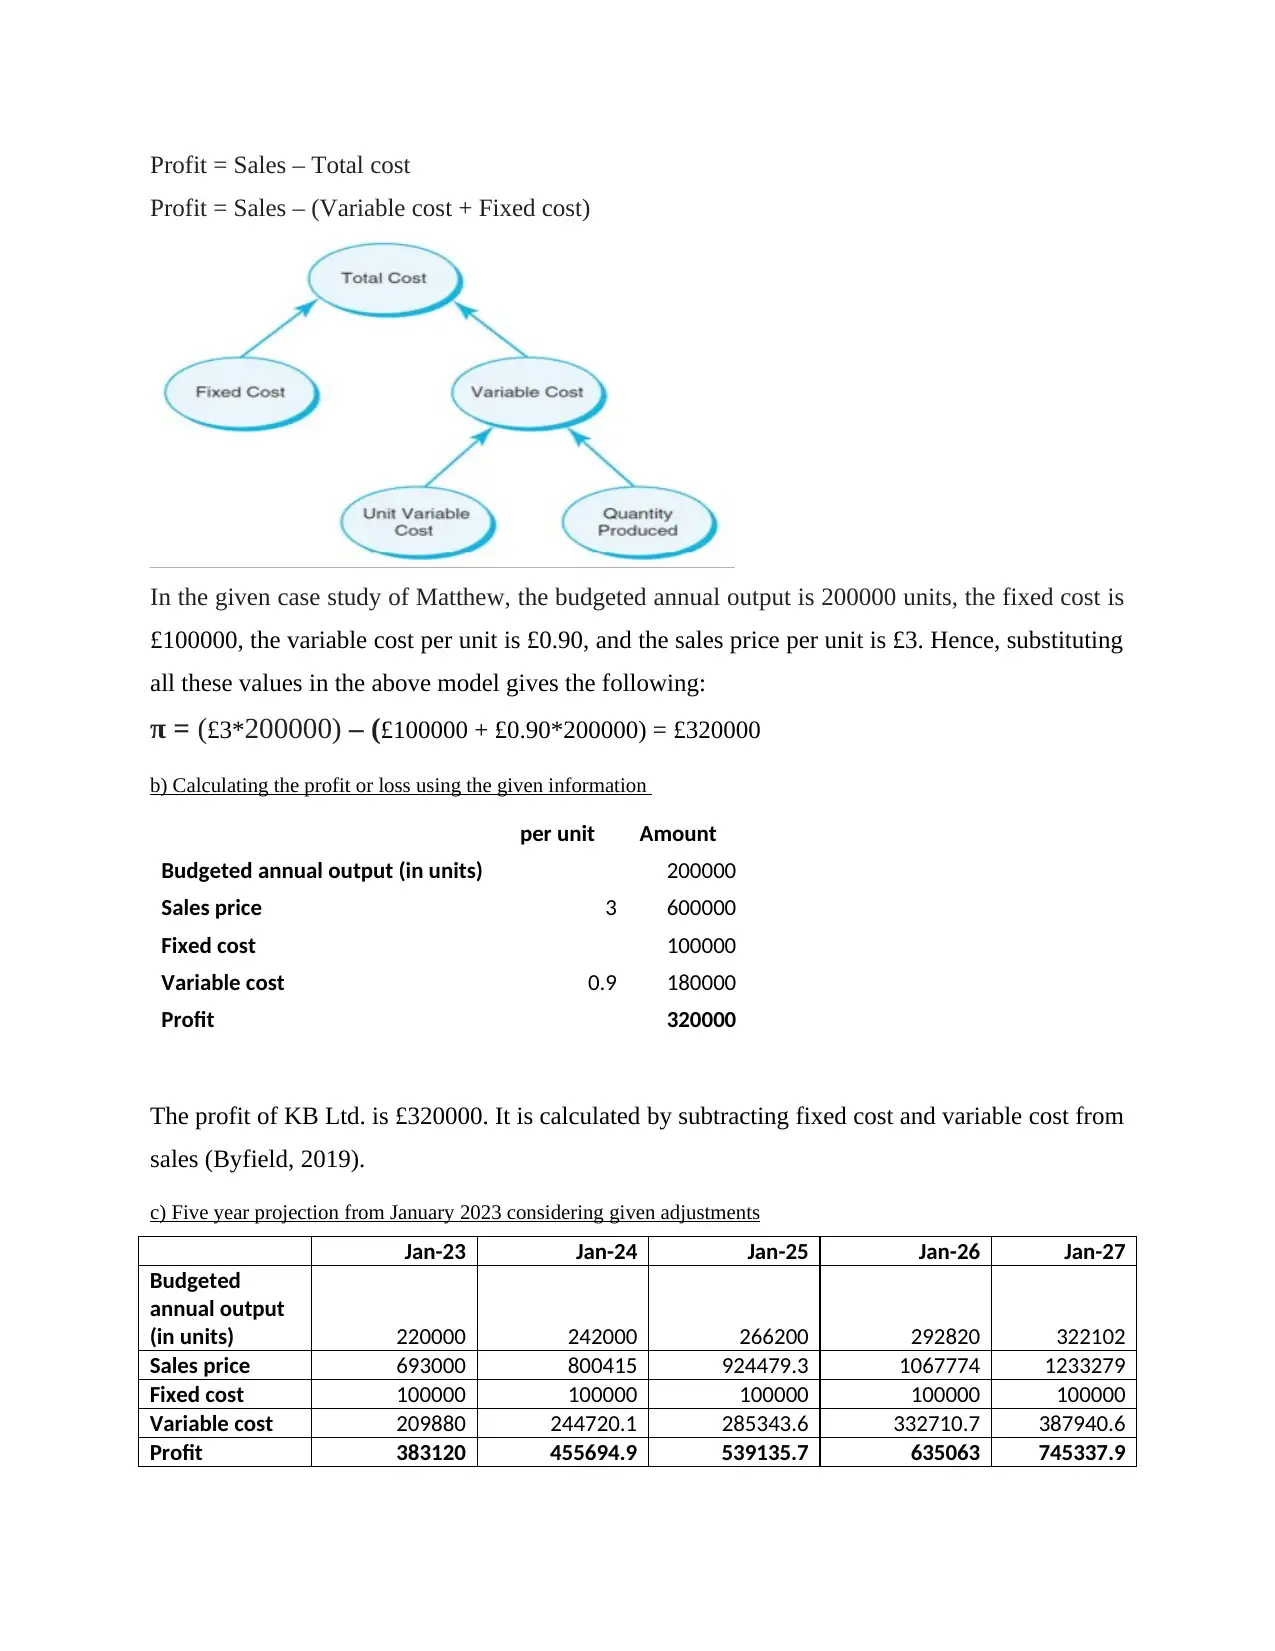
Profit = Sales – Total cost
Profit = Sales – (Variable cost + Fixed cost)
In the given case study of Matthew, the budgeted annual output is 200000 units, the fixed cost is
£100000, the variable cost per unit is £0.90, and the sales price per unit is £3. Hence, substituting
all these values in the above model gives the following:
π = (£3*200000) – (£100000 + £0.90*200000) = £320000
b) Calculating the profit or loss using the given information
per unit Amount
Budgeted annual output (in units) 200000
Sales price 3 600000
Fixed cost 100000
Variable cost 0.9 180000
Profit 320000
The profit of KB Ltd. is £320000. It is calculated by subtracting fixed cost and variable cost from
sales (Byfield, 2019).
c) Five year projection from January 2023 considering given adjustments
Jan-23 Jan-24 Jan-25 Jan-26 Jan-27
Budgeted
annual output
(in units) 220000 242000 266200 292820 322102
Sales price 693000 800415 924479.3 1067774 1233279
Fixed cost 100000 100000 100000 100000 100000
Variable cost 209880 244720.1 285343.6 332710.7 387940.6
Profit 383120 455694.9 539135.7 635063 745337.9
Paraphrase This Document
Need a fresh take? Get an instant paraphrase of this document with our AI Paraphraser
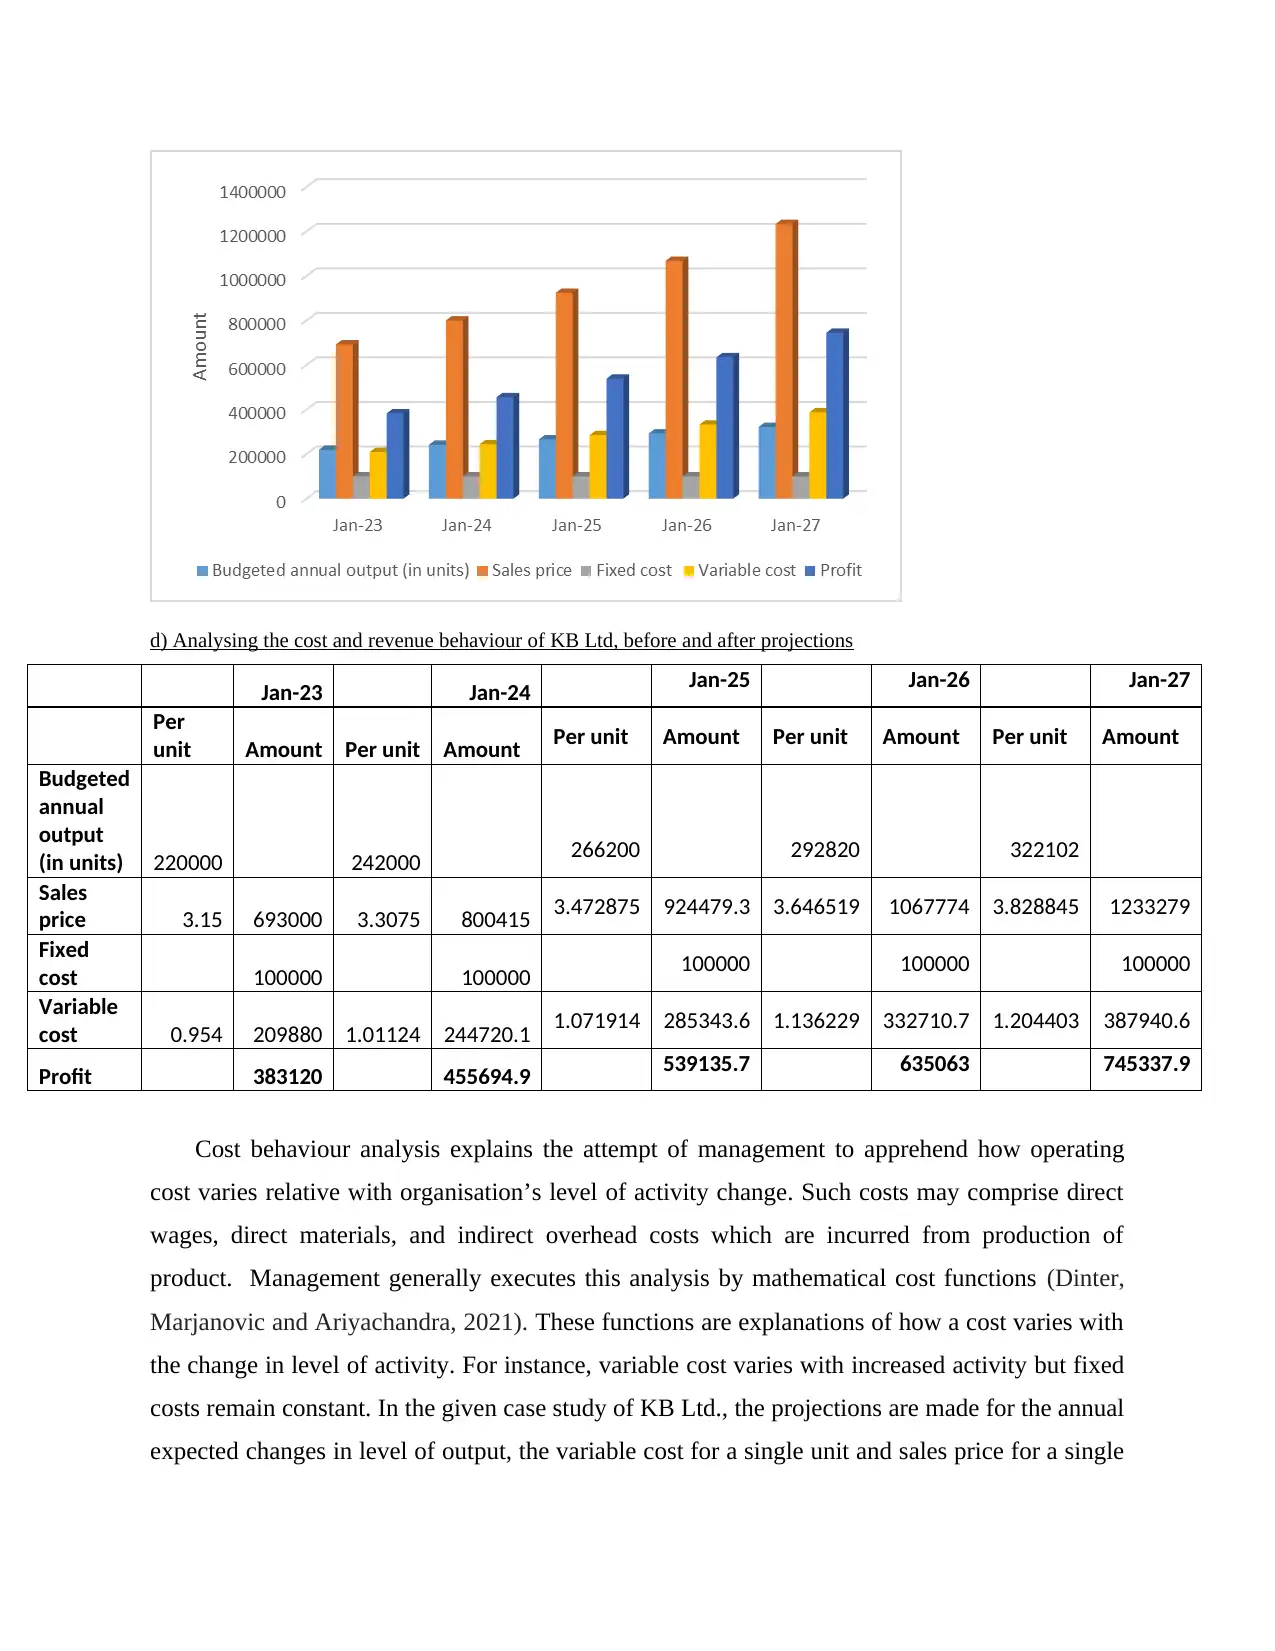
d) Analysing the cost and revenue behaviour of KB Ltd, before and after projections
Jan-23 Jan-24 Jan-25 Jan-26 Jan-27
Per
unit Amount Per unit Amount Per unit Amount Per unit Amount Per unit Amount
Budgeted
annual
output
(in units) 220000 242000 266200 292820 322102
Sales
price 3.15 693000 3.3075 800415 3.472875 924479.3 3.646519 1067774 3.828845 1233279
Fixed
cost 100000 100000 100000 100000 100000
Variable
cost 0.954 209880 1.01124 244720.1 1.071914 285343.6 1.136229 332710.7 1.204403 387940.6
Profit 383120 455694.9 539135.7 635063 745337.9
Cost behaviour analysis explains the attempt of management to apprehend how operating
cost varies relative with organisation’s level of activity change. Such costs may comprise direct
wages, direct materials, and indirect overhead costs which are incurred from production of
product. Management generally executes this analysis by mathematical cost functions (Dinter,
Marjanovic and Ariyachandra, 2021). These functions are explanations of how a cost varies with
the change in level of activity. For instance, variable cost varies with increased activity but fixed
costs remain constant. In the given case study of KB Ltd., the projections are made for the annual
expected changes in level of output, the variable cost for a single unit and sales price for a single
unit. The variable cost and sales price are increasing every year but the fixed cost remains same
throughout the 5 years. The resultant is the increasing profit every year. The profit increased
from 383120 in 2023 to 745337.9 in 2027. The sales increased from 693000 in 2023 to 1233279
in 2027.
Question 2
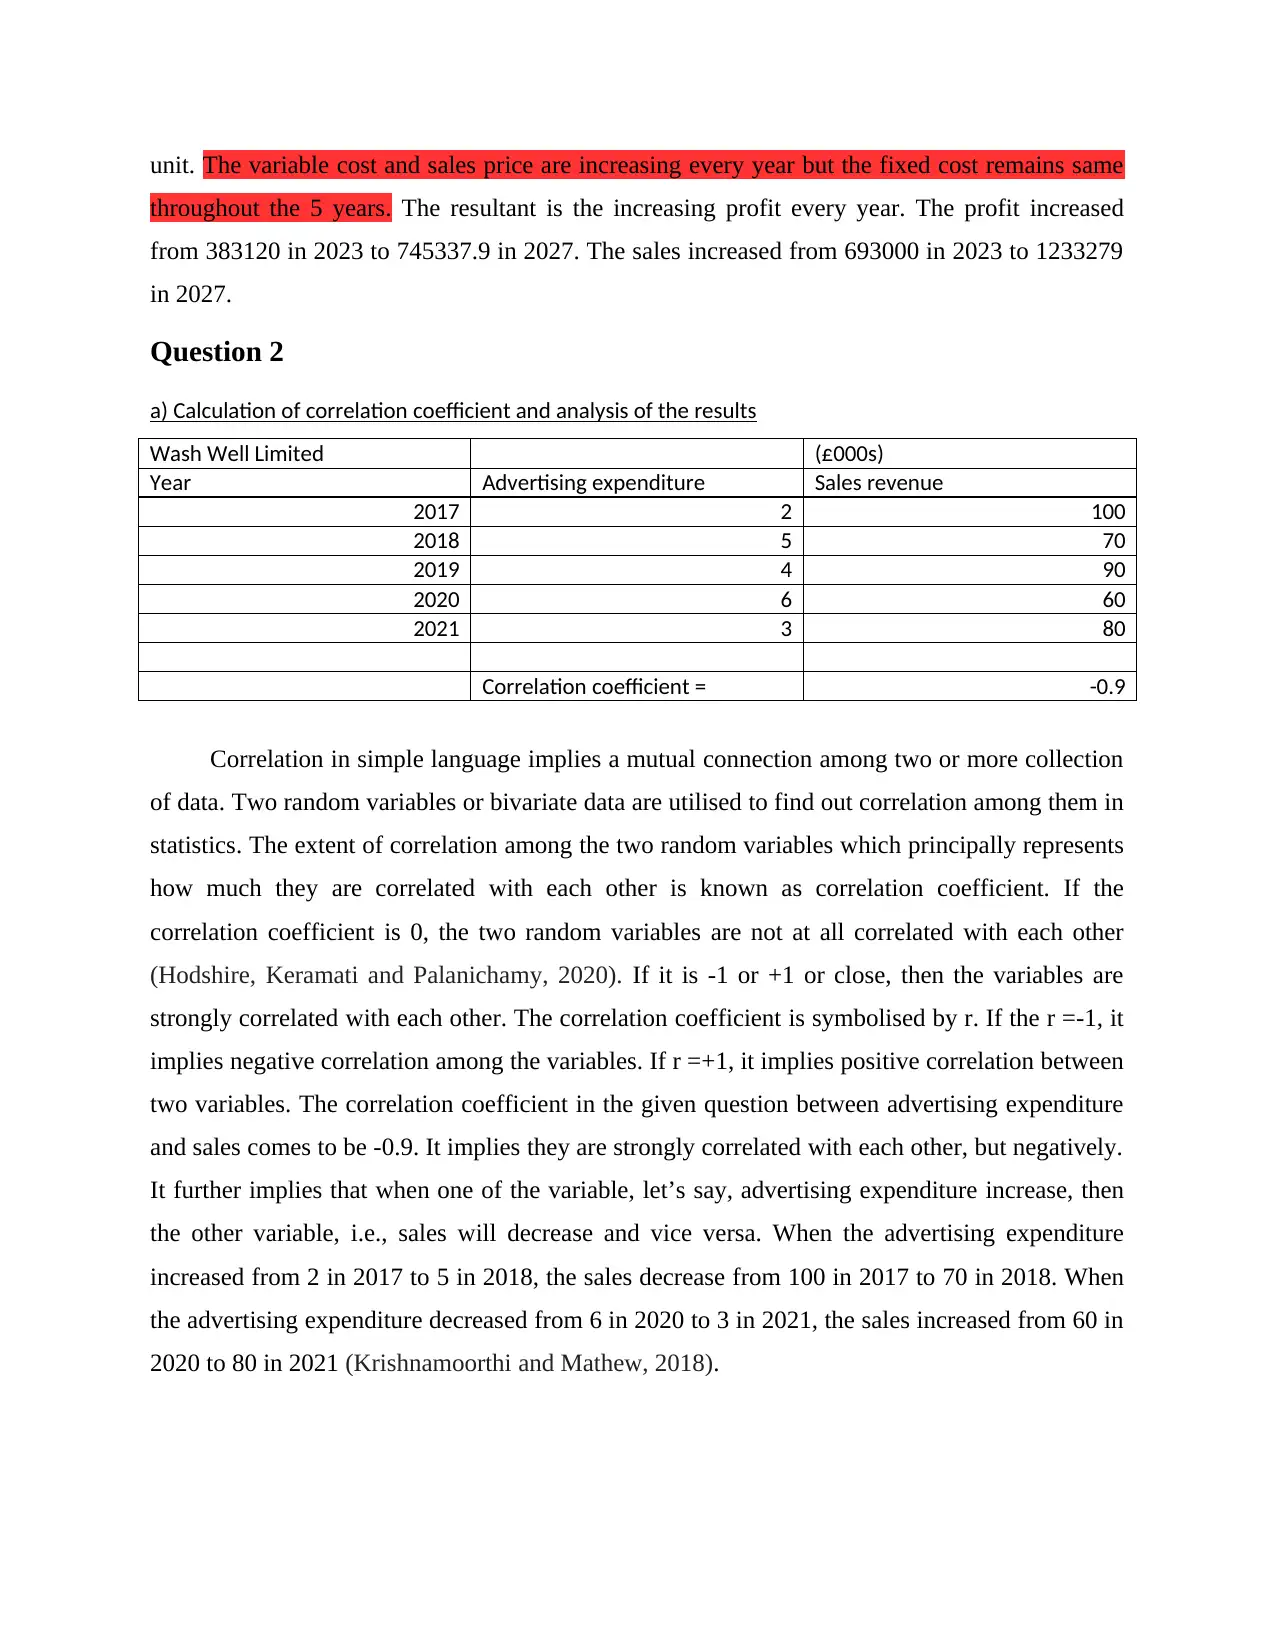
a) Calculation of correlation coefficient and analysis of the results
Wash Well Limited (£000s)
Year Advertising expenditure Sales revenue
2017 2 100
2018 5 70
2019 4 90
2020 6 60
2021 3 80
Correlation coefficient = -0.9
Correlation in simple language implies a mutual connection among two or more collection
of data. Two random variables or bivariate data are utilised to find out correlation among them in
statistics. The extent of correlation among the two random variables which principally represents
how much they are correlated with each other is known as correlation coefficient. If the
correlation coefficient is 0, the two random variables are not at all correlated with each other
(Hodshire, Keramati and Palanichamy, 2020). If it is -1 or +1 or close, then the variables are
strongly correlated with each other. The correlation coefficient is symbolised by r. If the r =-1, it
implies negative correlation among the variables. If r =+1, it implies positive correlation between
two variables. The correlation coefficient in the given question between advertising expenditure
and sales comes to be -0.9. It implies they are strongly correlated with each other, but negatively.
It further implies that when one of the variable, let’s say, advertising expenditure increase, then
the other variable, i.e., sales will decrease and vice versa. When the advertising expenditure
increased from 2 in 2017 to 5 in 2018, the sales decrease from 100 in 2017 to 70 in 2018. When
the advertising expenditure decreased from 6 in 2020 to 3 in 2021, the sales increased from 60 in
2020 to 80 in 2021 (Krishnamoorthi and Mathew, 2018).
throughout the 5 years. The resultant is the increasing profit every year. The profit increased
from 383120 in 2023 to 745337.9 in 2027. The sales increased from 693000 in 2023 to 1233279
in 2027.
Question 2
a) Calculation of correlation coefficient and analysis of the results
Wash Well Limited (£000s)
Year Advertising expenditure Sales revenue
2017 2 100
2018 5 70
2019 4 90
2020 6 60
2021 3 80
Correlation coefficient = -0.9
Correlation in simple language implies a mutual connection among two or more collection
of data. Two random variables or bivariate data are utilised to find out correlation among them in
statistics. The extent of correlation among the two random variables which principally represents
how much they are correlated with each other is known as correlation coefficient. If the
correlation coefficient is 0, the two random variables are not at all correlated with each other
(Hodshire, Keramati and Palanichamy, 2020). If it is -1 or +1 or close, then the variables are
strongly correlated with each other. The correlation coefficient is symbolised by r. If the r =-1, it
implies negative correlation among the variables. If r =+1, it implies positive correlation between
two variables. The correlation coefficient in the given question between advertising expenditure
and sales comes to be -0.9. It implies they are strongly correlated with each other, but negatively.
It further implies that when one of the variable, let’s say, advertising expenditure increase, then
the other variable, i.e., sales will decrease and vice versa. When the advertising expenditure
increased from 2 in 2017 to 5 in 2018, the sales decrease from 100 in 2017 to 70 in 2018. When
the advertising expenditure decreased from 6 in 2020 to 3 in 2021, the sales increased from 60 in
2020 to 80 in 2021 (Krishnamoorthi and Mathew, 2018).
⊘ This is a preview!⊘
Do you want full access?
Subscribe today to unlock all pages.
Trusted by 1+ million students worldwide
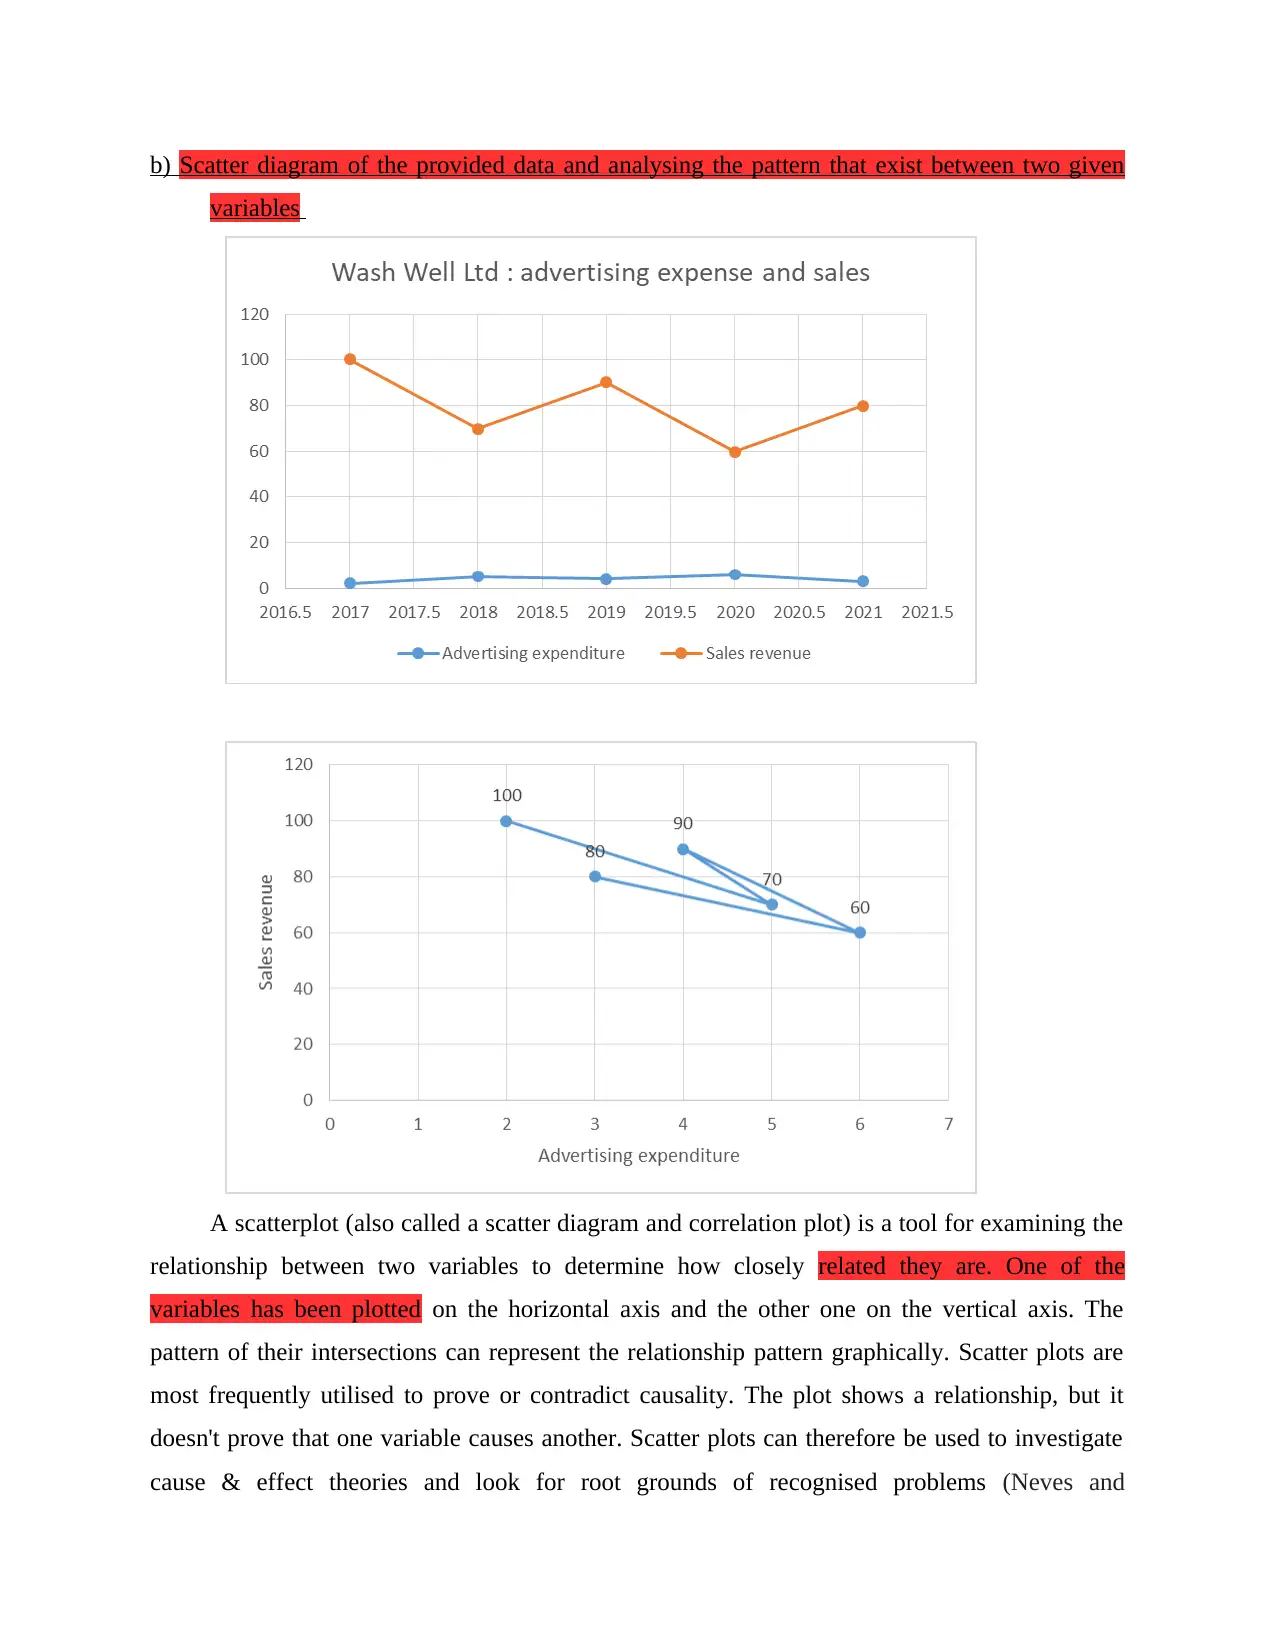
b) Scatter diagram of the provided data and analysing the pattern that exist between two given
variables
A scatterplot (also called a scatter diagram and correlation plot) is a tool for examining the
relationship between two variables to determine how closely related they are. One of the
variables has been plotted on the horizontal axis and the other one on the vertical axis. The
pattern of their intersections can represent the relationship pattern graphically. Scatter plots are
most frequently utilised to prove or contradict causality. The plot shows a relationship, but it
doesn't prove that one variable causes another. Scatter plots can therefore be used to investigate
cause & effect theories and look for root grounds of recognised problems (Neves and
Paraphrase This Document
Need a fresh take? Get an instant paraphrase of this document with our AI Paraphraser
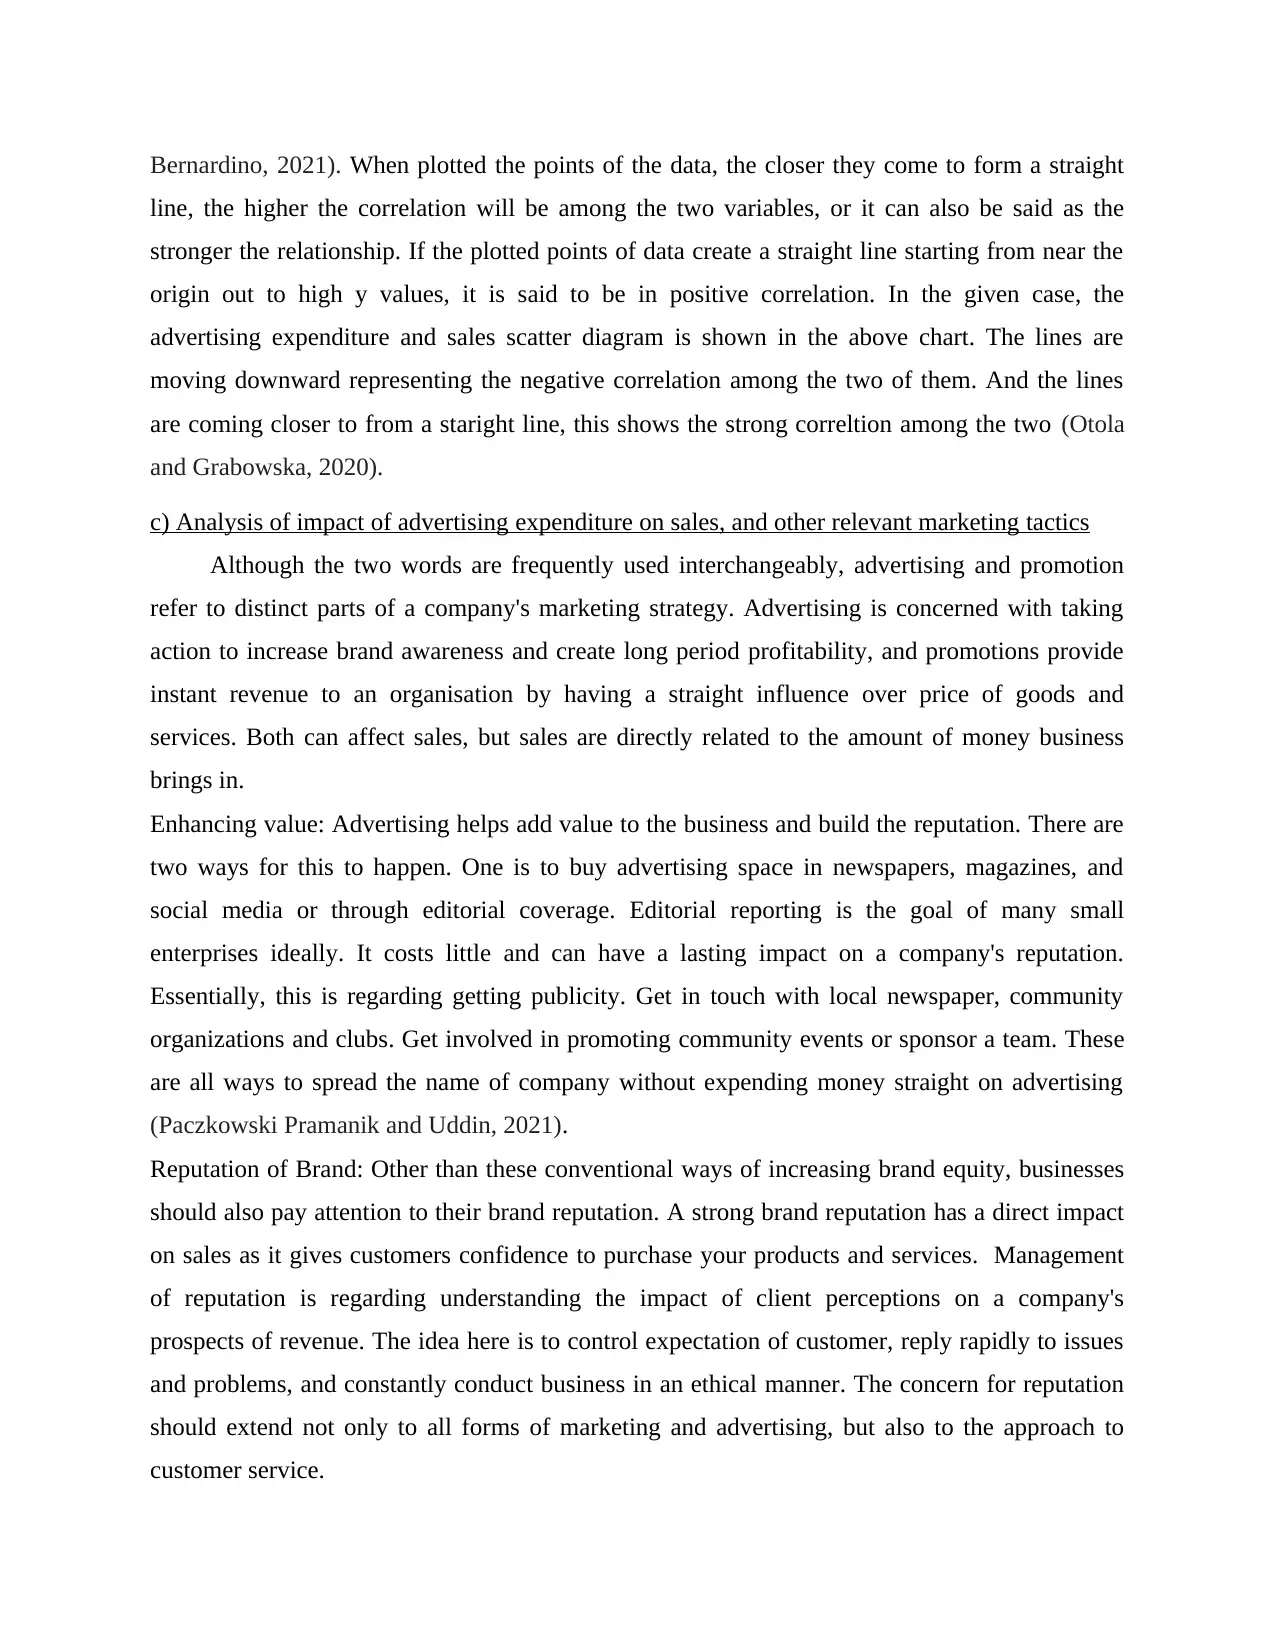
Bernardino, 2021). When plotted the points of the data, the closer they come to form a straight
line, the higher the correlation will be among the two variables, or it can also be said as the
stronger the relationship. If the plotted points of data create a straight line starting from near the
origin out to high y values, it is said to be in positive correlation. In the given case, the
advertising expenditure and sales scatter diagram is shown in the above chart. The lines are
moving downward representing the negative correlation among the two of them. And the lines
are coming closer to from a staright line, this shows the strong correltion among the two (Otola
and Grabowska, 2020).
c) Analysis of impact of advertising expenditure on sales, and other relevant marketing tactics
Although the two words are frequently used interchangeably, advertising and promotion
refer to distinct parts of a company's marketing strategy. Advertising is concerned with taking
action to increase brand awareness and create long period profitability, and promotions provide
instant revenue to an organisation by having a straight influence over price of goods and
services. Both can affect sales, but sales are directly related to the amount of money business
brings in.
Enhancing value: Advertising helps add value to the business and build the reputation. There are
two ways for this to happen. One is to buy advertising space in newspapers, magazines, and
social media or through editorial coverage. Editorial reporting is the goal of many small
enterprises ideally. It costs little and can have a lasting impact on a company's reputation.
Essentially, this is regarding getting publicity. Get in touch with local newspaper, community
organizations and clubs. Get involved in promoting community events or sponsor a team. These
are all ways to spread the name of company without expending money straight on advertising
(Paczkowski Pramanik and Uddin, 2021).
Reputation of Brand: Other than these conventional ways of increasing brand equity, businesses
should also pay attention to their brand reputation. A strong brand reputation has a direct impact
on sales as it gives customers confidence to purchase your products and services. Management
of reputation is regarding understanding the impact of client perceptions on a company's
prospects of revenue. The idea here is to control expectation of customer, reply rapidly to issues
and problems, and constantly conduct business in an ethical manner. The concern for reputation
should extend not only to all forms of marketing and advertising, but also to the approach to
customer service.
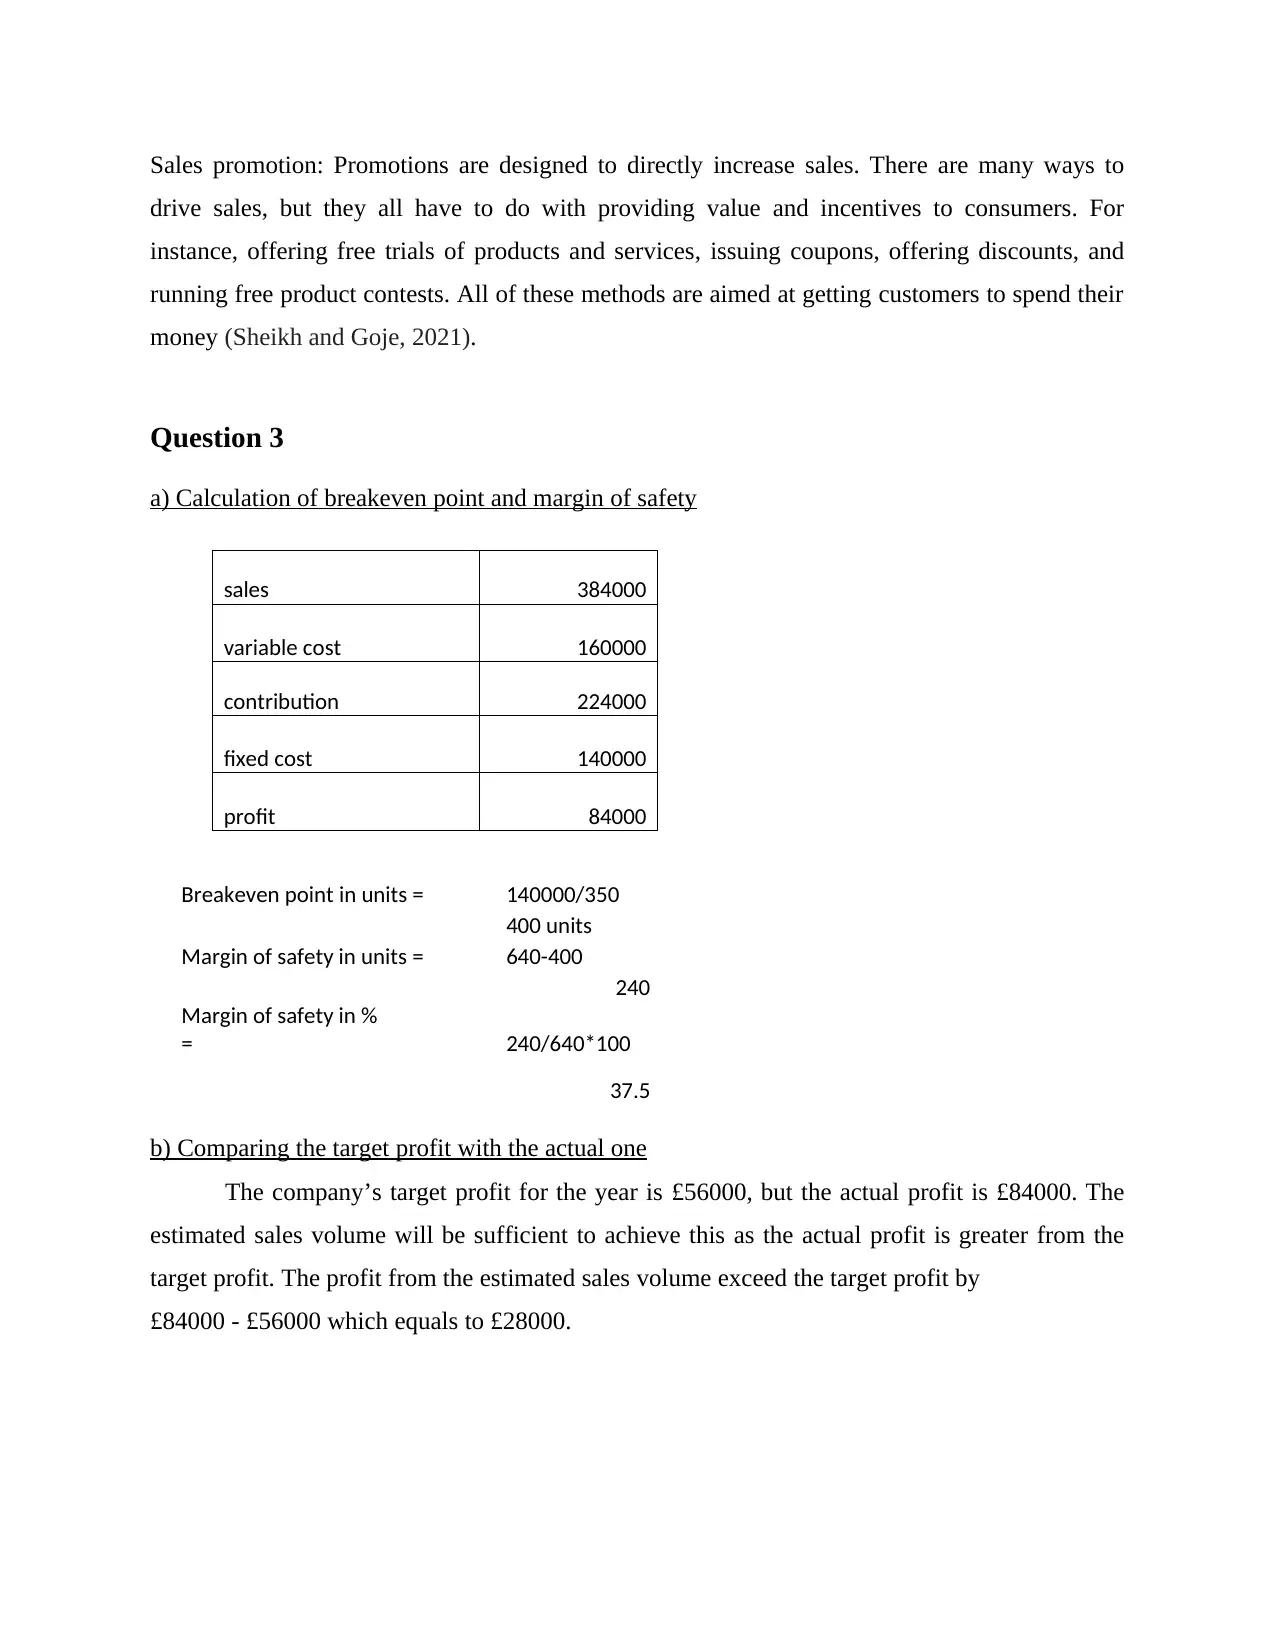
Sales promotion: Promotions are designed to directly increase sales. There are many ways to
drive sales, but they all have to do with providing value and incentives to consumers. For
instance, offering free trials of products and services, issuing coupons, offering discounts, and
running free product contests. All of these methods are aimed at getting customers to spend their
money (Sheikh and Goje, 2021).
Question 3
a) Calculation of breakeven point and margin of safety
b) Comparing the target profit with the actual one
The company’s target profit for the year is £56000, but the actual profit is £84000. The
estimated sales volume will be sufficient to achieve this as the actual profit is greater from the
target profit. The profit from the estimated sales volume exceed the target profit by
£84000 - £56000 which equals to £28000.
sales 384000
variable cost 160000
contribution 224000
fixed cost 140000
profit 84000
Breakeven point in units = 140000/350
400 units
Margin of safety in units = 640-400
240
Margin of safety in %
= 240/640*100
37.5
⊘ This is a preview!⊘
Do you want full access?
Subscribe today to unlock all pages.
Trusted by 1+ million students worldwide
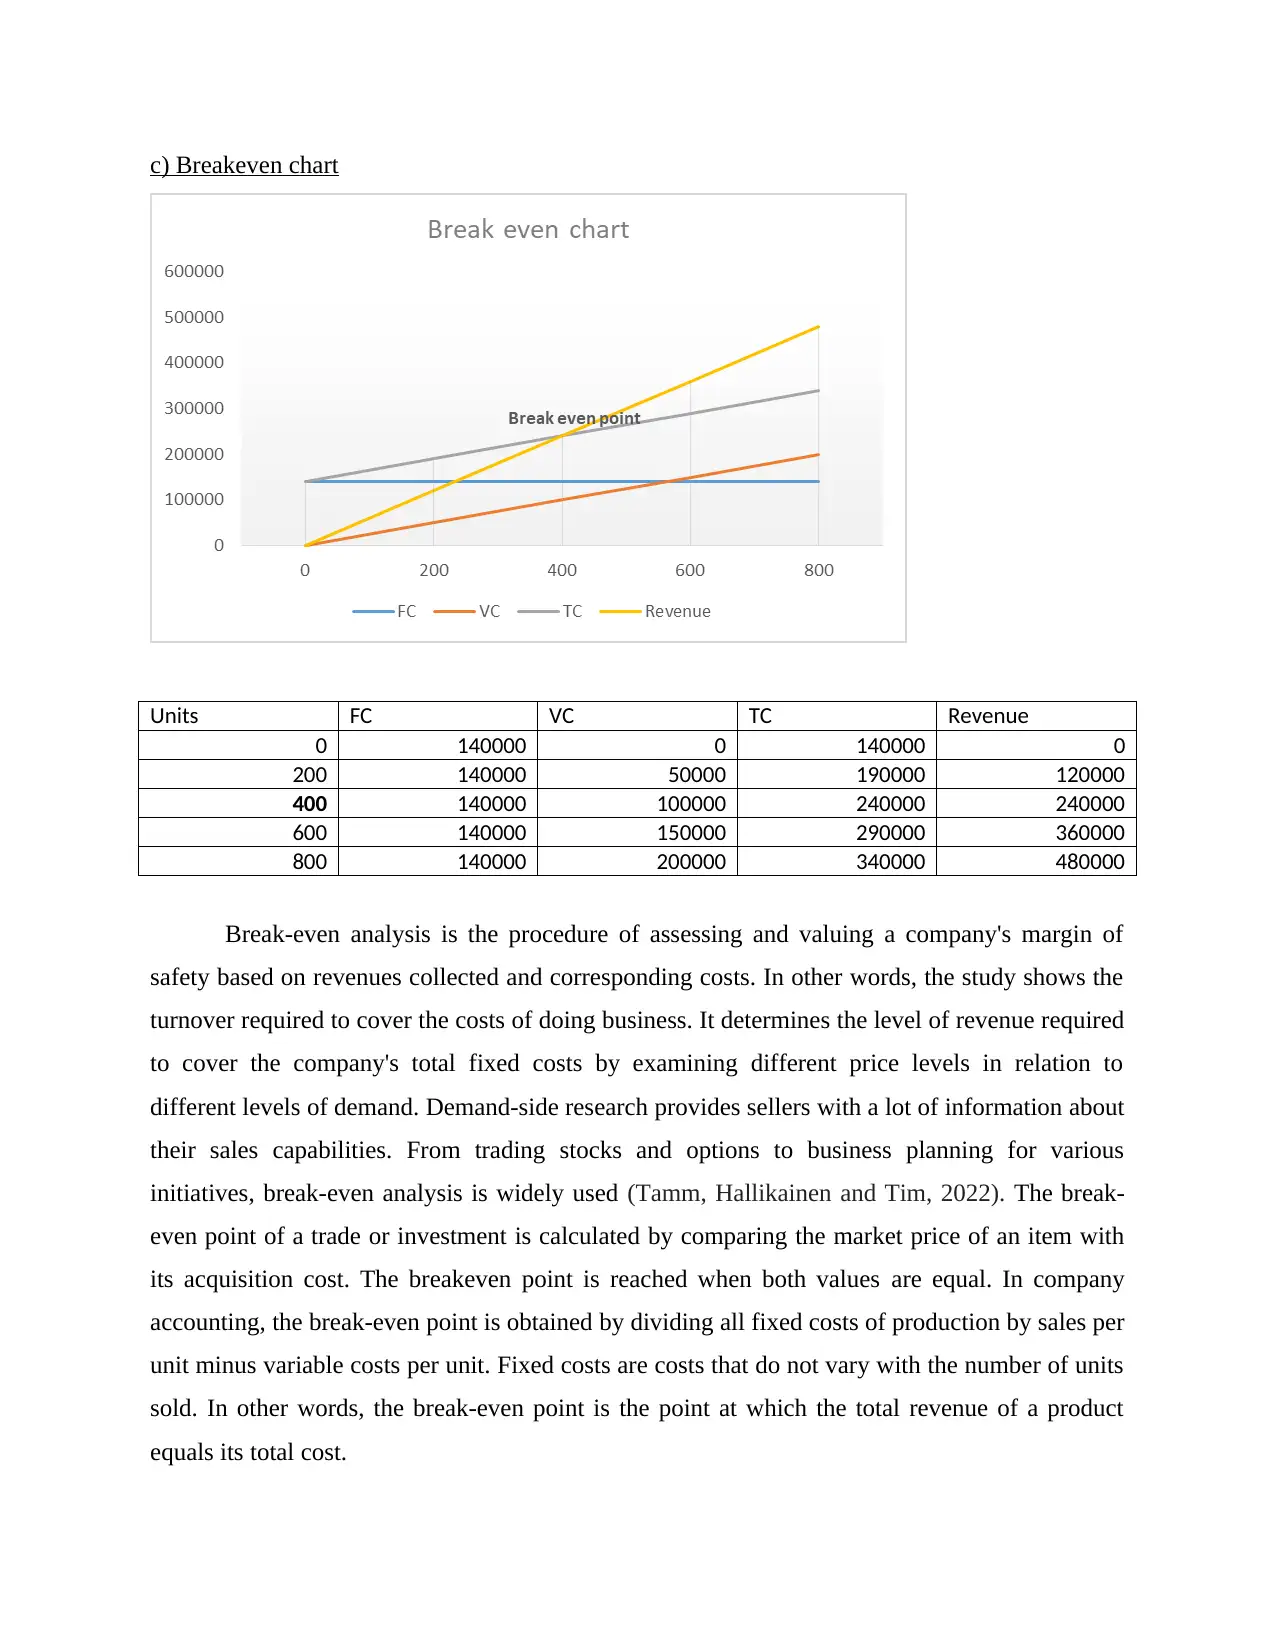
c) Breakeven chart
Units FC VC TC Revenue
0 140000 0 140000 0
200 140000 50000 190000 120000
400 140000 100000 240000 240000
600 140000 150000 290000 360000
800 140000 200000 340000 480000
Break-even analysis is the procedure of assessing and valuing a company's margin of
safety based on revenues collected and corresponding costs. In other words, the study shows the
turnover required to cover the costs of doing business. It determines the level of revenue required
to cover the company's total fixed costs by examining different price levels in relation to
different levels of demand. Demand-side research provides sellers with a lot of information about
their sales capabilities. From trading stocks and options to business planning for various
initiatives, break-even analysis is widely used (Tamm, Hallikainen and Tim, 2022). The break-
even point of a trade or investment is calculated by comparing the market price of an item with
its acquisition cost. The breakeven point is reached when both values are equal. In company
accounting, the break-even point is obtained by dividing all fixed costs of production by sales per
unit minus variable costs per unit. Fixed costs are costs that do not vary with the number of units
sold. In other words, the break-even point is the point at which the total revenue of a product
equals its total cost.
Paraphrase This Document
Need a fresh take? Get an instant paraphrase of this document with our AI Paraphraser
Break-even point (unit) = fixed cost ÷ (sales per unit – variable cost per unit).
d) Analysing the benefits and limitations of breakeven model
Benefits of break-even analysis
Pricing: The Break-Even analysis is identified as an extremely crucial for businesses and
has many benefits. This tells how many items are needed to sell to incur profit or
revenue. Determining if the product is worth selling or if it is too risky to sell. It shows
the amount of money which the organization makes at each stage of production.
Funding: In case of the funding, the adoption of break-even analysis is generally a crucial
aspect of the organizational strategy. If there is a need to raise capital for company or
start up, will definitely require a break-even analysis. Additionally, an insignificant
break-even point makes it more comfortable to take on additional debt and financing
(Torres, Sidorova and Jones, 2018).
Setting Sales Goals: A break-even analysis can also be identified as a significant method
accurate revenue bench mark for the team. Having exact amounts and time periods in
mind usually makes it easier to determine sales targets.
Reduce risk: Some business concepts are not meant to be followed. A break-even
analysis can assist reduce risk by keeping business away from that investments and
product lines that are less likely to succeed.
Rely on accurate data: Costs may be categorized as both fixed and variable costs. This
can complicate calculations and should almost certainly be put in one of the two.
Accurate breakeven points require correct data.
Competitors are ignored: As a newcomer, one influence the competition and vice versa.
They may change their prices, which may affect demand for their goods and force them
to adjust their prices. Prices are likely to rise. Finally, break-even analysis provides
reliable knowledge of the prerequisites for success. But that's not the only research one
should do before starting or changing a company.
Pay a fixed cost: Most people think of price as how much it costs to make a product.
These are known as variable costs. Fixed costs such as insurance and web development
still need to be paid. This can be achieved by doing a break-even analysis.
Make better decisions: Entrepreneurs often make decisions based on emotion. If they are
excited about a new venture, they will pursue it. Knowing feelings is necessary, but not
enough. Successful entrepreneurs make decisions based on facts. Making decisions is
much easier when one put in the effort and have meaningful data.
Limitations of Breakeven Analysis
Break-even analysis is based on the assumption that all costs and expenses can be clearly
divided into fixed and variable components. However, in practice, it can be difficult to
clearly distinguish between fixed and variable costs.
Assuming a constant selling price leads to a straight line of sales, which may or may not
be exact. The selling price of a product is determined by various factors such as market
supply and demand, competition, etc., and is rarely held constant.
It assumes that the quantity produced and sold are the same, and that the starting and
ending stocks of the finished goods remain the same. But in reality it is not.
The amount of capital used by the company is not considered in the break-even analysis.
In fact, the amount of capital used is a key factor in a company's profitability.
It has proven unsuitable in industries such as shipbuilding. If fixed costs are not taken
into account when evaluating work in progress, losses can occur each year until the
contract is terminated. This can lead to income tax issues.
Firms may choose to over order at a lower price and ignore factory capacity based on the
concept of marginal cost. This may require additional labour and capacity expansion,
both of which can increase production costs and cause changes in fixed costs. Companies
often lose money.
Fixed costs are assumed to be constant at all activity levels. Note that fixed costs tend to
vary with level of activity.
Assume that variable costs are proportional to production volume. In practice, it moves
relative to production, though not always in exact proportions (Wickramasinghe and
Schaffer, 2018).
Sales revenue and variable costs do not grow in line with output. They are less
proportional than they should be at higher output levels. This is due to transaction
discounts, bulk buying savings, concessions on bulk sales, etc.
⊘ This is a preview!⊘
Do you want full access?
Subscribe today to unlock all pages.
Trusted by 1+ million students worldwide
1 out of 14
Related Documents


Your All-in-One AI-Powered Toolkit for Academic Success.
+13062052269
info@desklib.com
Available 24*7 on WhatsApp / Email
![[object Object]](/_next/static/media/star-bottom.7253800d.svg)
Unlock your academic potential
Copyright © 2020–2026 A2Z Services. All Rights Reserved. Developed and managed by ZUCOL.