Business Data Analysis and Interpretation for JCU Staff
VerifiedAdded on 2020/05/28
|16
|1743
|156
Report
AI Summary
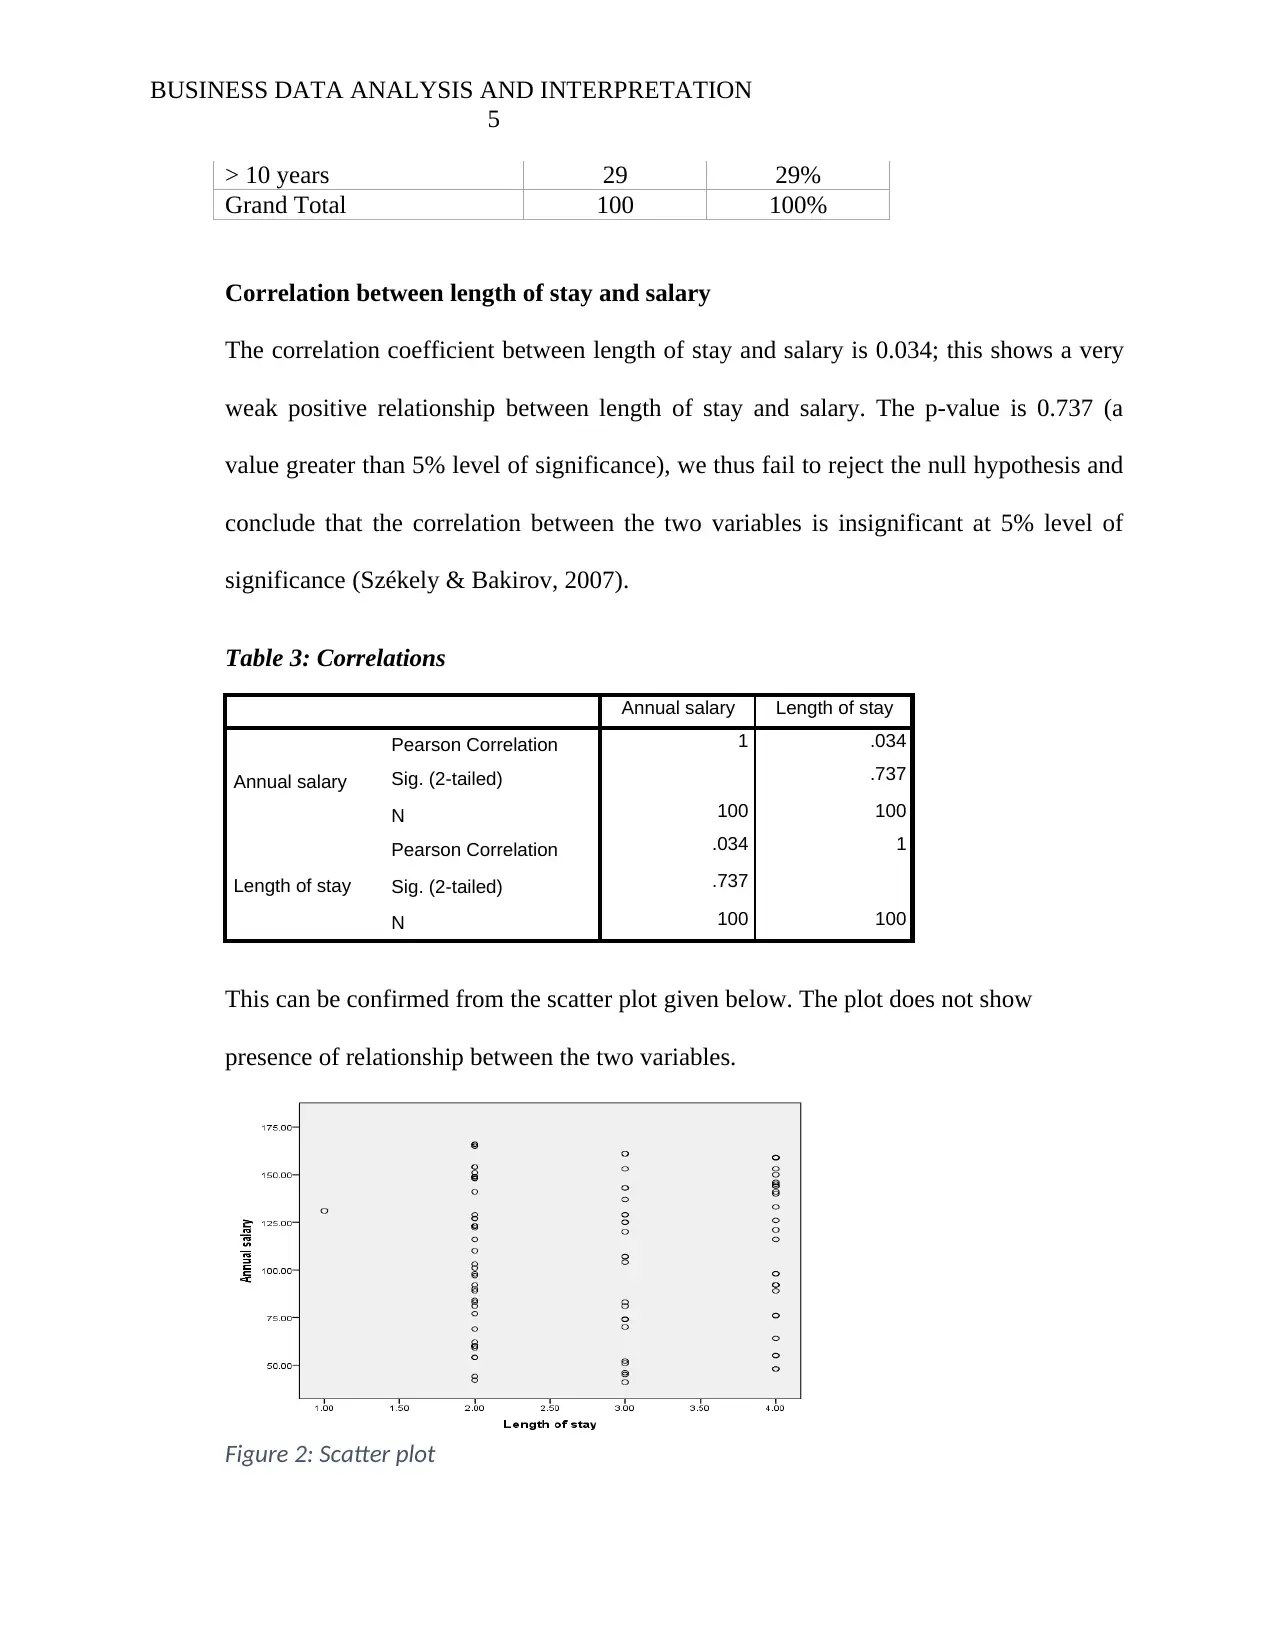
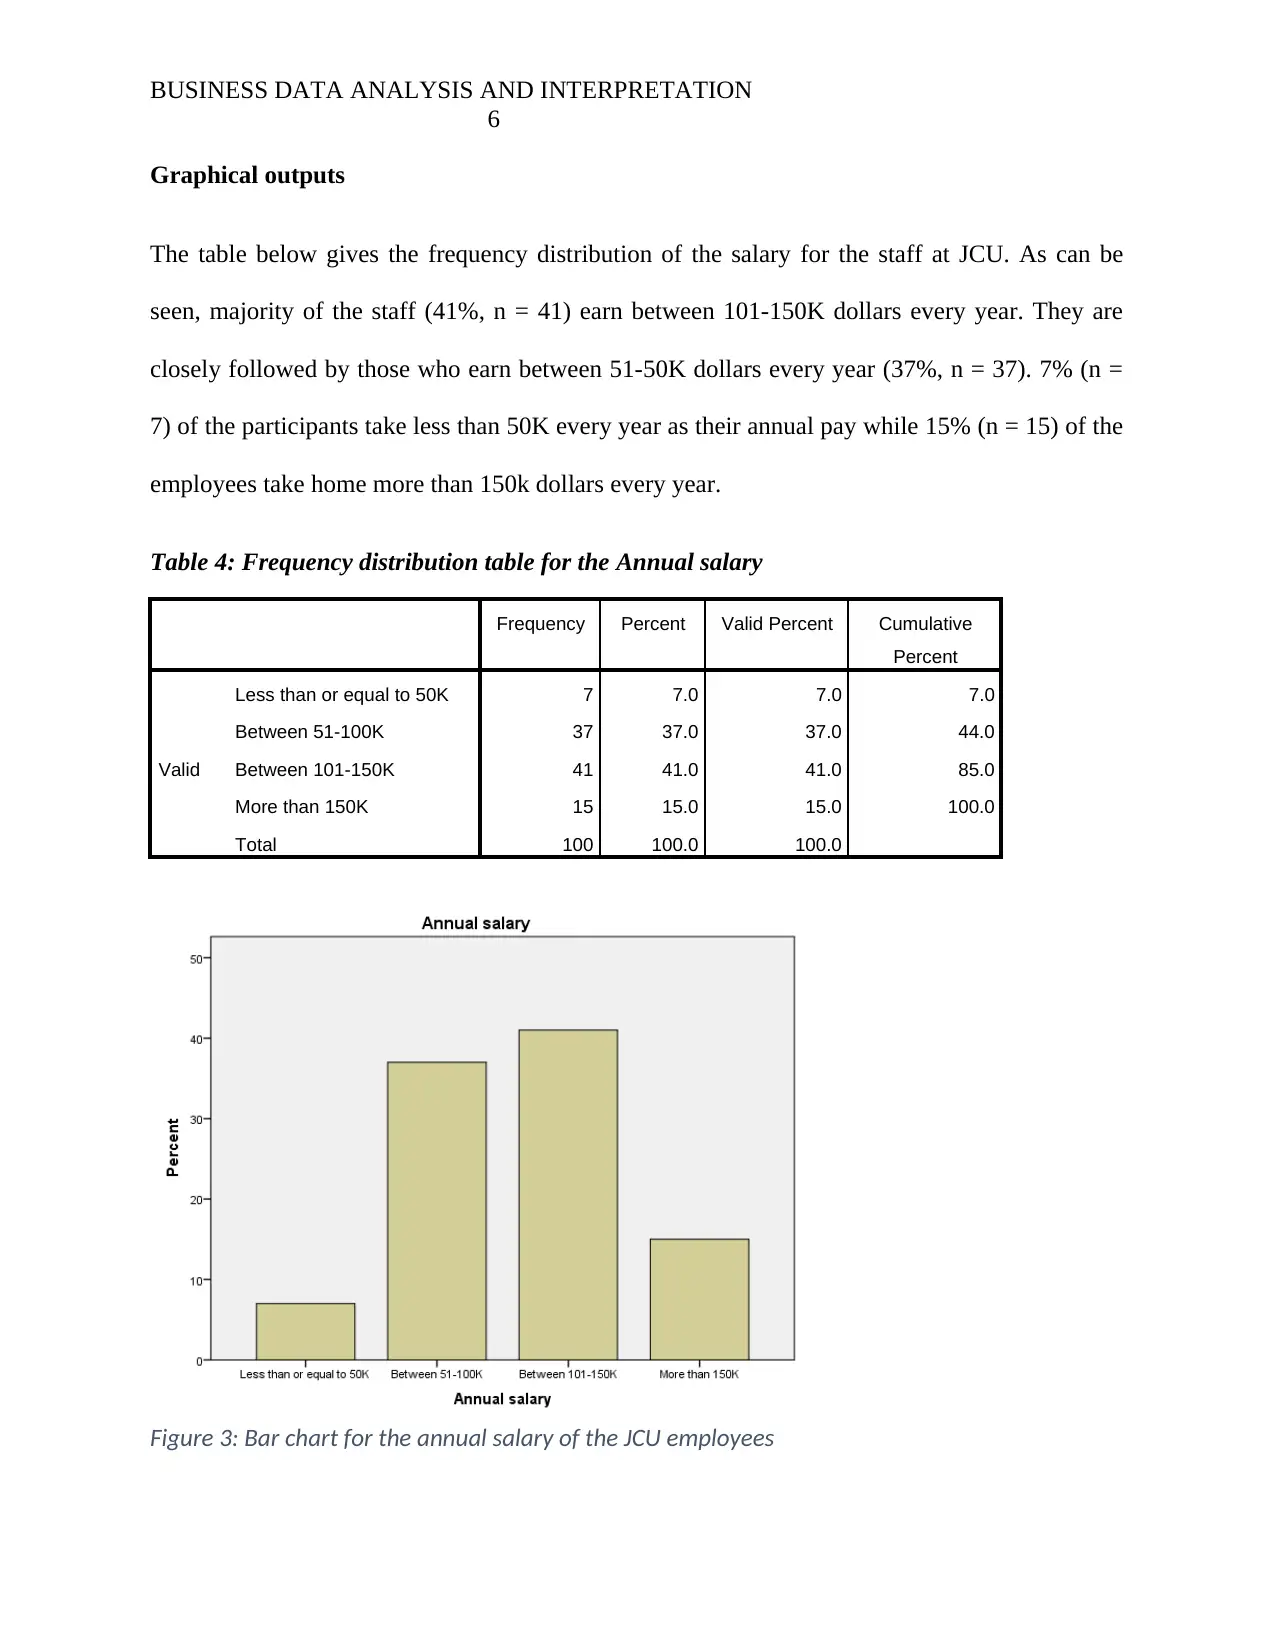
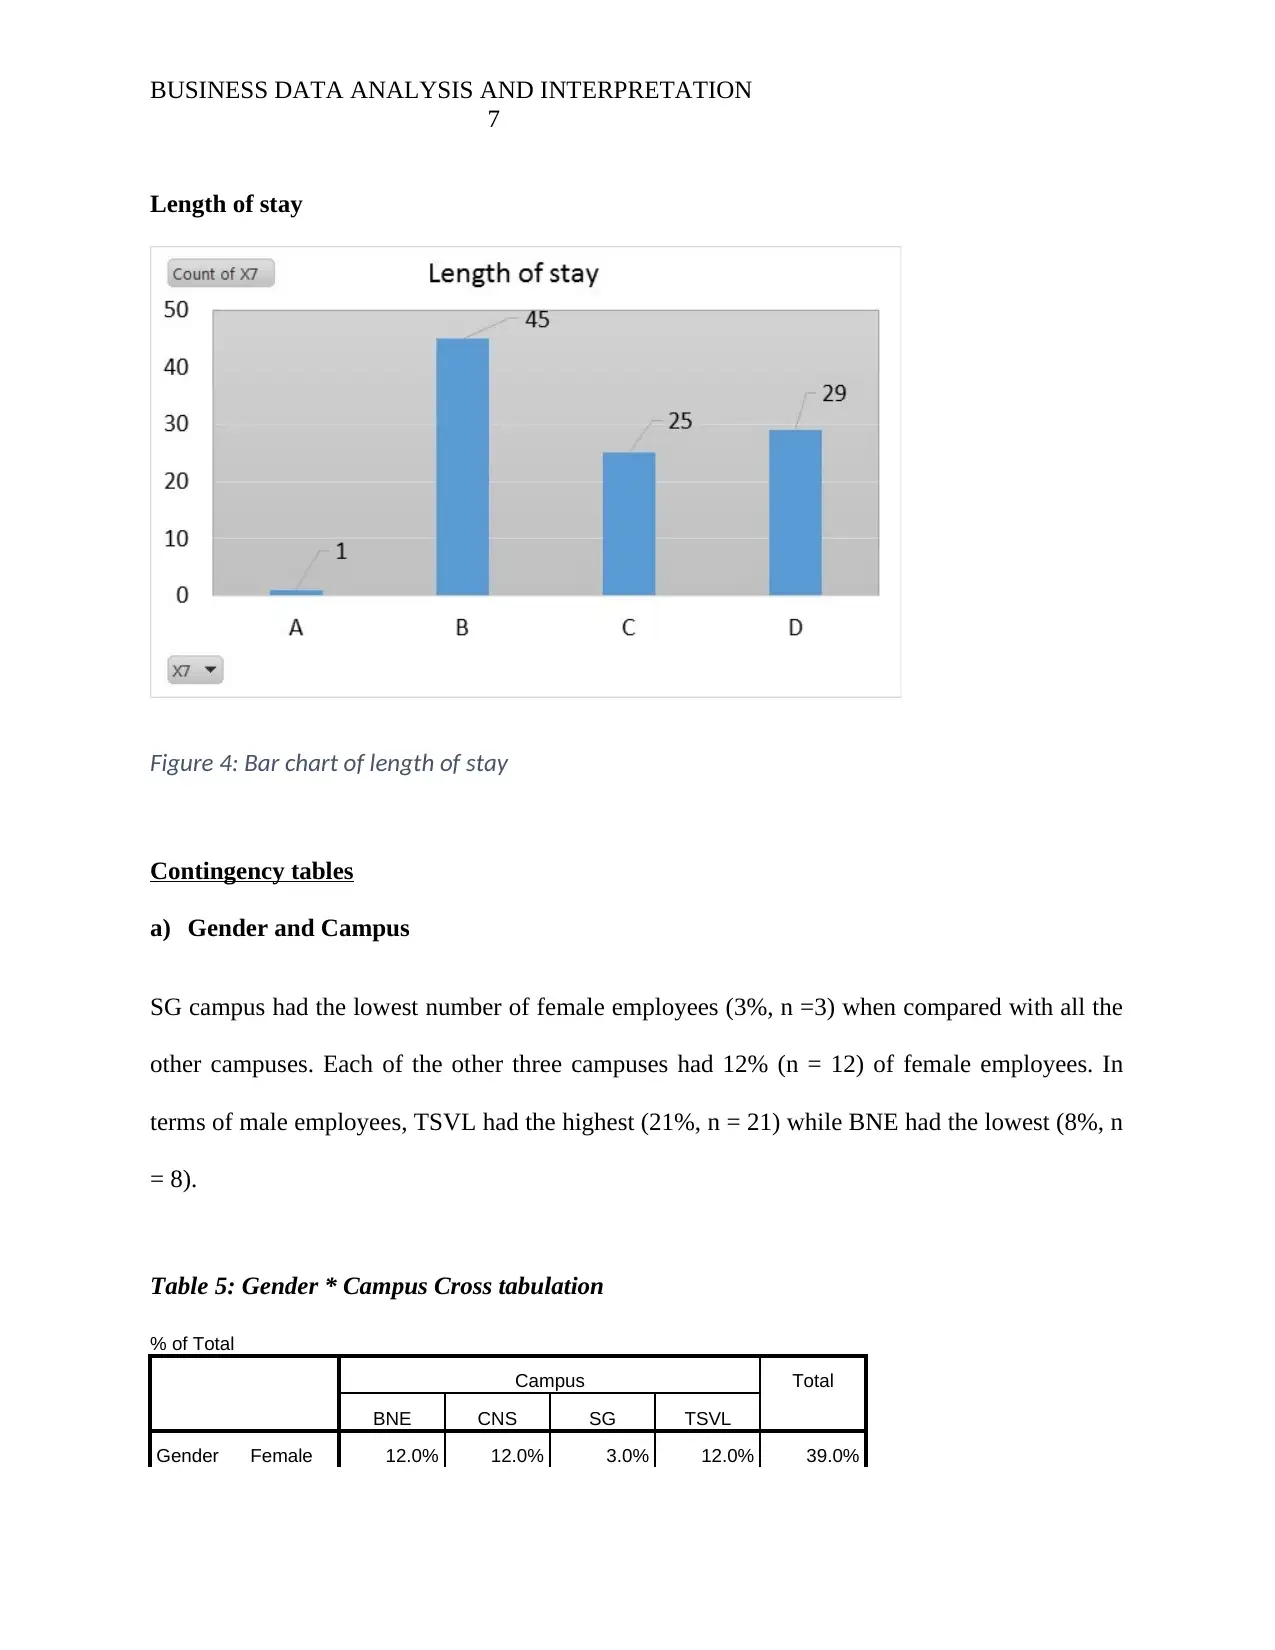
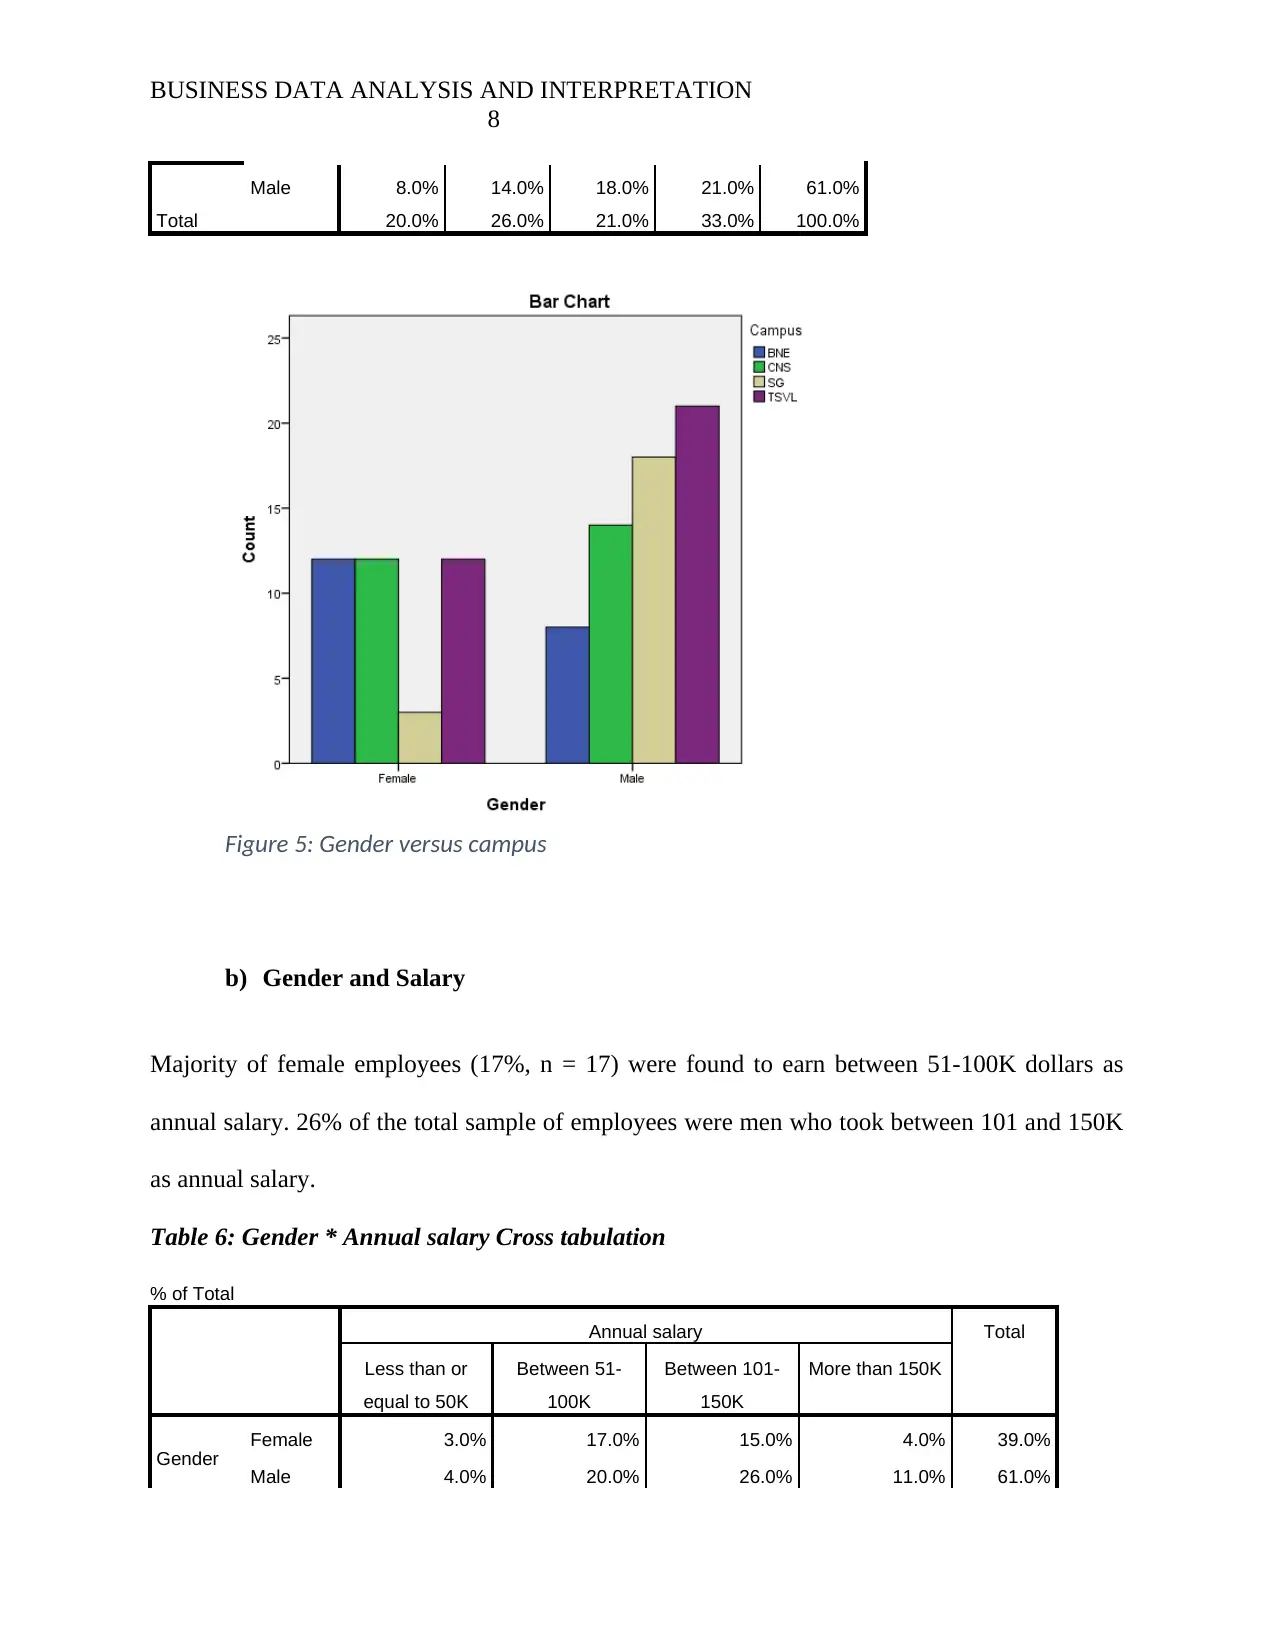
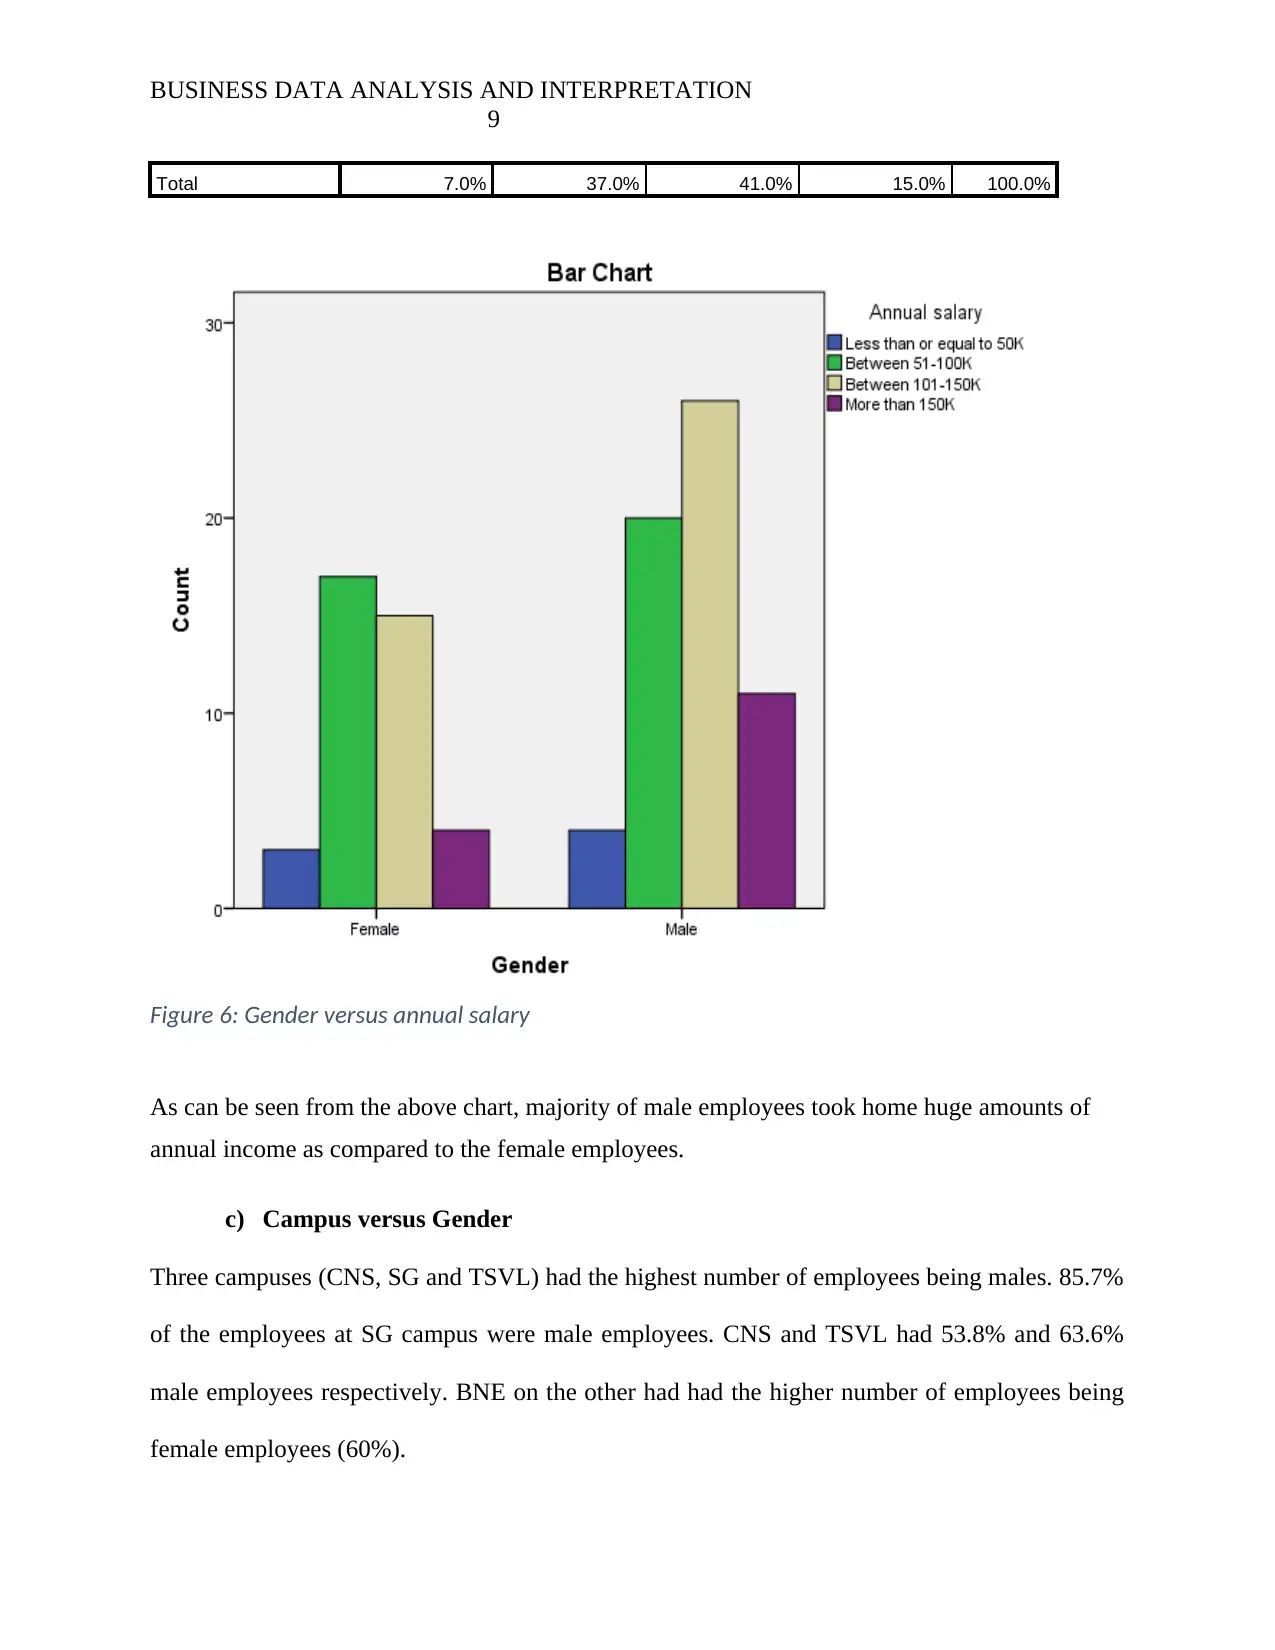
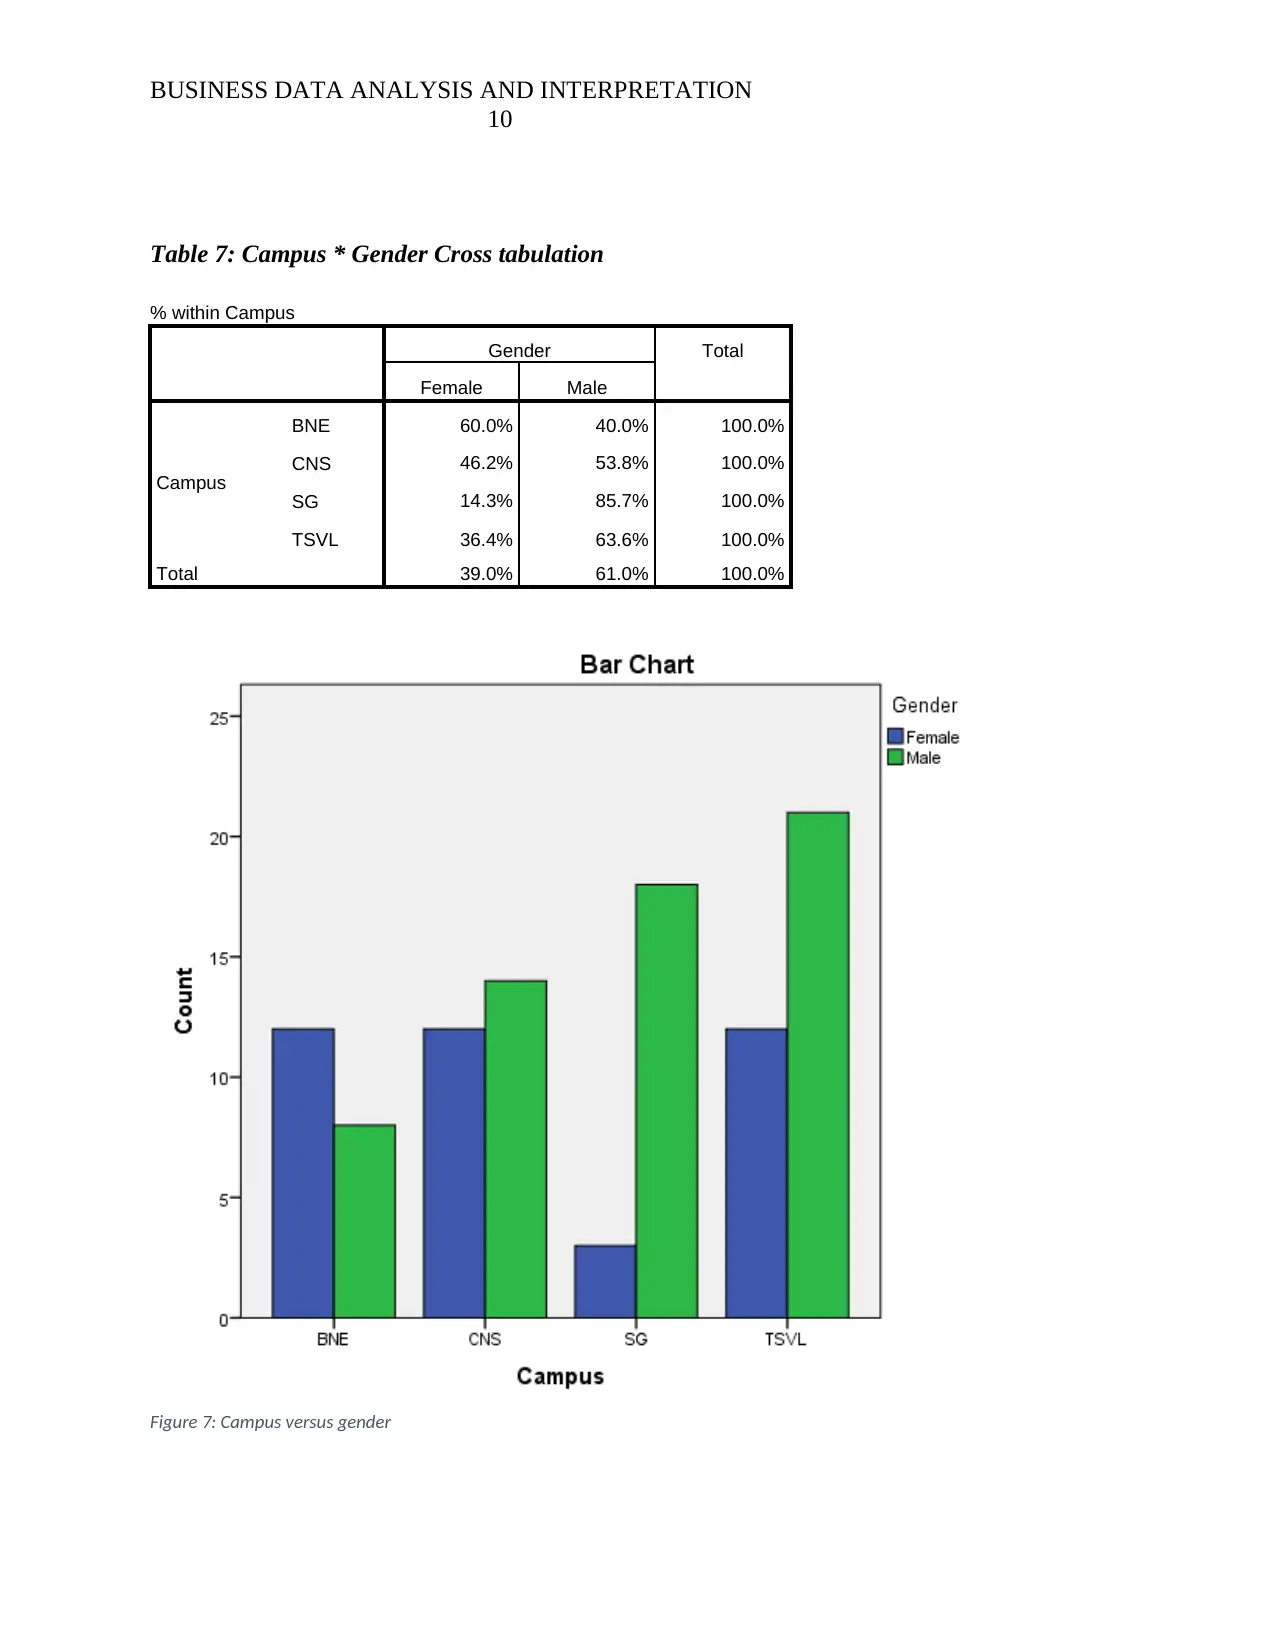
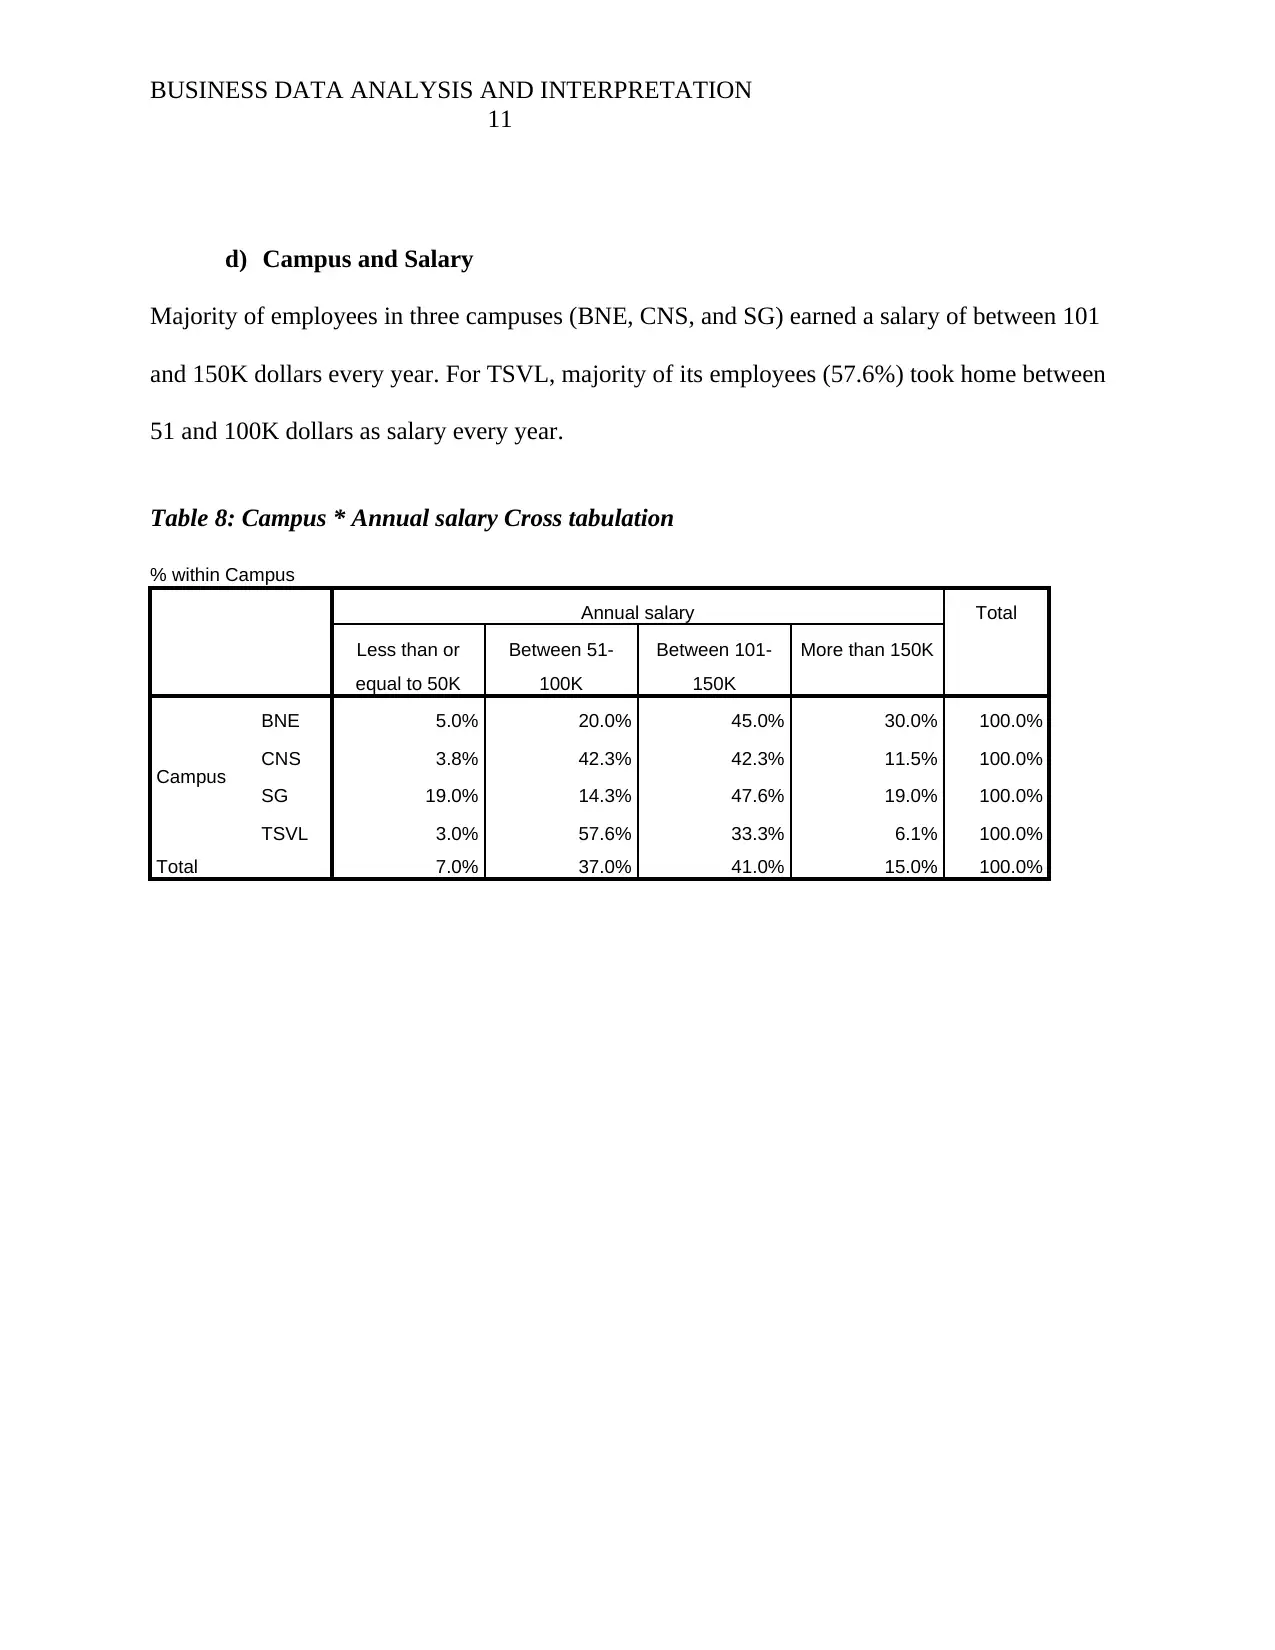
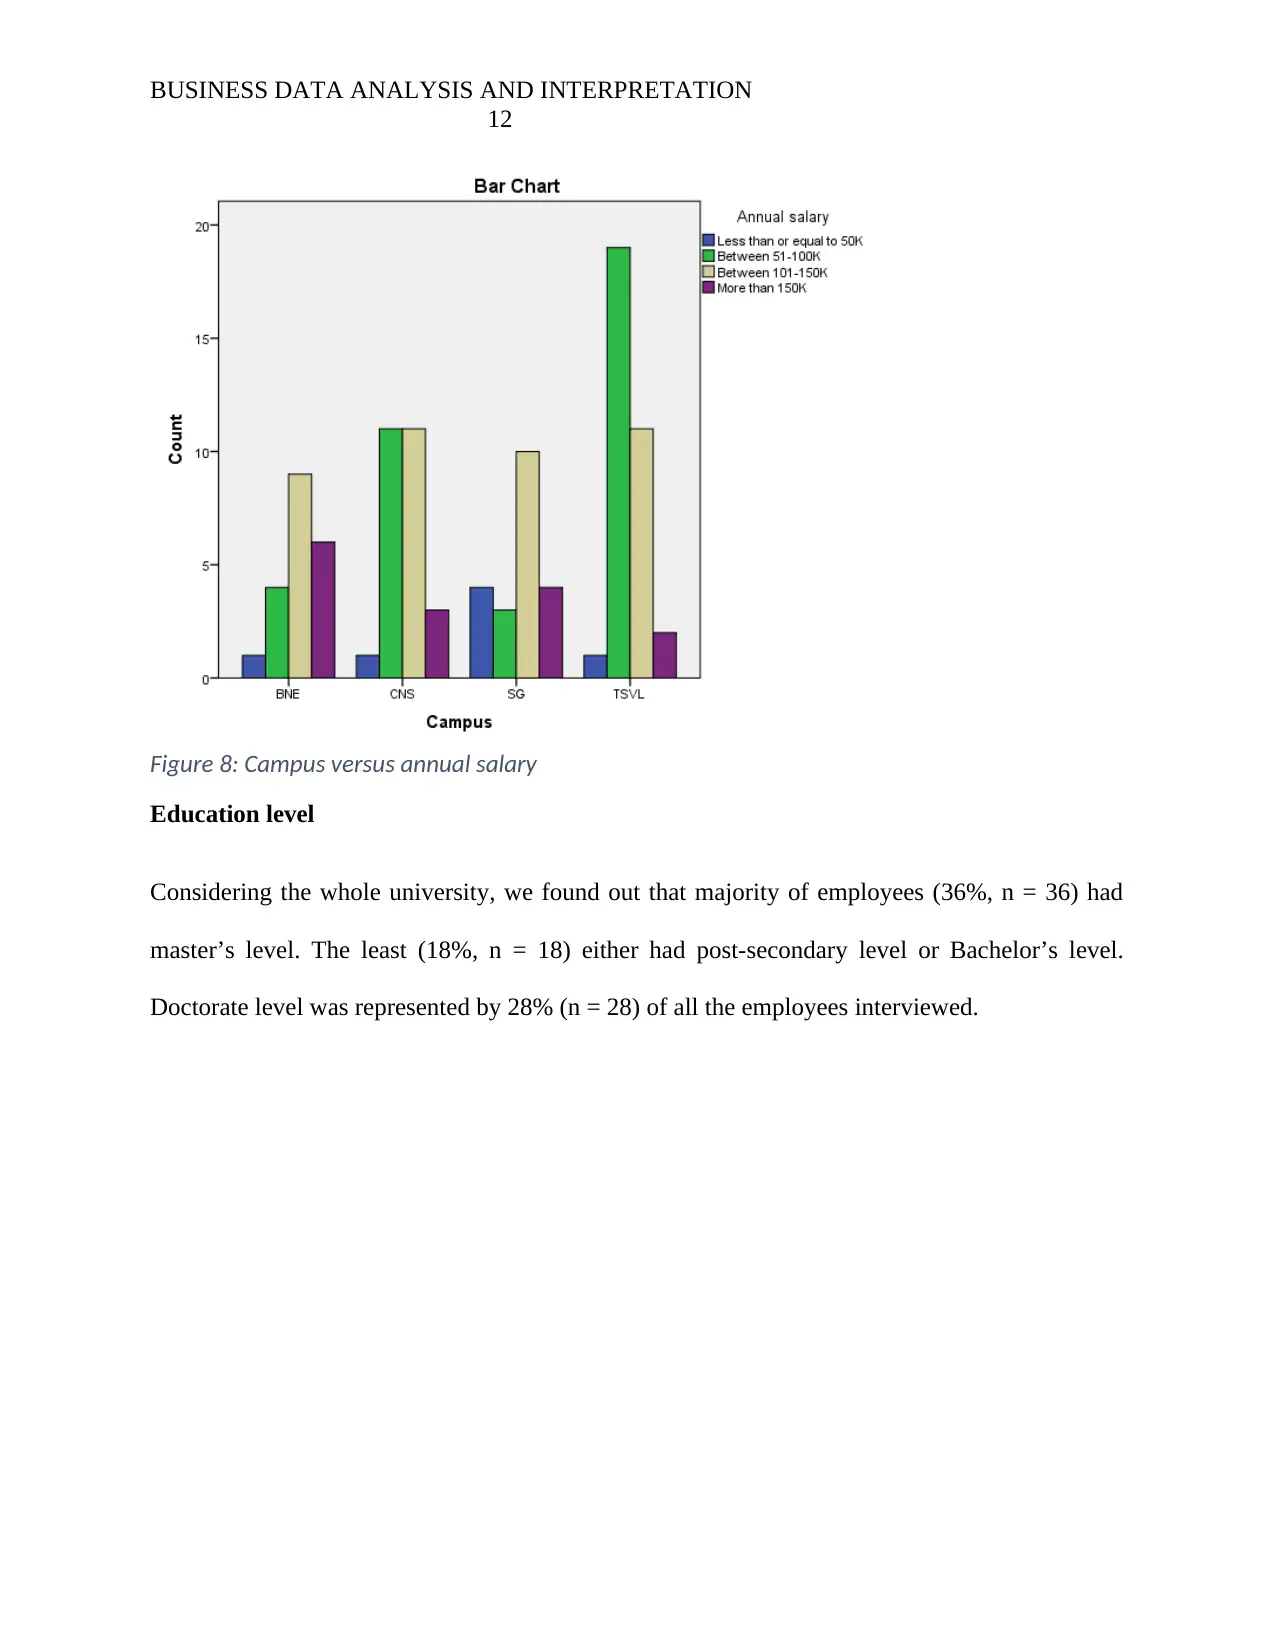
This report presents a comprehensive analysis of data related to staff at James Cook University (JCU), focusing on key aspects such as salary, length of employment, gender distribution across different campuses, and educational levels. The analysis includes descriptive statistics, correlation analyses, and graphical representations like box plots, bar charts, and contingency tables to visualize and interpret the data effectively. Key findings reveal the average annual salary, the relationship between length of employment and salary, and the distribution of salaries across different genders and campuses. The report also examines the educational levels of the staff and their distribution across campuses. The study aims to provide insights relevant to the Vice Chancellor's interest in fostering a gender-neutral workplace and understanding the university's carbon footprint. The report utilizes various statistical techniques to identify patterns and trends within the dataset, offering valuable information for decision-making and policy development at JCU.
1 out of 16


Your All-in-One AI-Powered Toolkit for Academic Success.
+13062052269
info@desklib.com
Available 24*7 on WhatsApp / Email
![[object Object]](/_next/static/media/star-bottom.7253800d.svg)
Copyright © 2020–2026 A2Z Services. All Rights Reserved. Developed and managed by ZUCOL.