Speedy Filters Expansion Analysis
VerifiedAdded on 2020/06/03
|19
|4317
|304
AI Summary
This assignment analyzes the potential expansion of Speedy Filters. It examines market research methods, sampling techniques for data collection, and visualization techniques like bar charts and pie charts. Financial analysis tools such as Net Present Value (NPV) and Internal Rate of Return (IRR) are applied to determine the profitability of the expansion project. The report concludes that the NPV of 30,084.01 is positive, indicating a beneficial outcome for Speedy Filters.
Contribute Materials
Your contribution can guide someone’s learning journey. Share your
documents today.

BUSINESS
DECISION MAKING
DECISION MAKING
Secure Best Marks with AI Grader
Need help grading? Try our AI Grader for instant feedback on your assignments.
Table of Contents
INTRODUCTION...........................................................................................................................1
TASK 1............................................................................................................................................1
1.1 Plan for collection of primary and secondary data................................................................1
1.2 Survey methodologies and sampling methods......................................................................1
1.3 Questionnaire to collect data from prospective parents.........................................................4
TASK 2............................................................................................................................................5
2.1 Presentation of data in comprehensible manner....................................................................5
2.2 and 2.3 Measures of dispersion and Average marks.............................................................6
2.4 Interpretation and explanation to answers.............................................................................6
TASK 3............................................................................................................................................7
3.1 Data presentation through bar and pie chart..........................................................................7
3.2 Scatter diagram presentation..................................................................................................9
3.3 Computation of average weight of children and line of best fit..........................................10
TASK 4..........................................................................................................................................11
4.1 Various methods of investment appraisal and its merits and demerits................................11
4.2 Preparation of project plan...................................................................................................13
4.3 Calculation of Net Present Value (NPV) and Internal Rate of Return (IRR)......................15
CONCLUSION..............................................................................................................................16
REFERENCES..............................................................................................................................17
INTRODUCTION
TASK 1
It is important for businesses to consider all the necessary aspects before taking any
decisions so that the objectives can be fulfilled in a well defined manner. The report makes
comprehensive discussion on various sampling methods, such as, stratified, simple random,
systematic etc. It helps in ascertaining various strengths and weakness of different sampling
methods. The report further will discuss various data representation methods such as, bar chart,
pie chart, scatter diagram etc. The report will then focus on different capital budgeting
techniques and there calculation as well. These techniques include, Net present Value, Payback
Period, Average rate of Return, Internal Rate of Return etc.
1.1 Plan for collection of primary and secondary data
The data for school can be collected in the following manner:
Primary data: It is the first hand data collected for the specific study in order to serve its
purpose. In the given scenario, the data will be collected to make an assessment for the school
and ascertain that whether the new branch will prove to be beneficial for the successful for
overall development of school or not. Hence, in order to serve this purpose survey will be
conducted among the parents to ascertain that what all facilities they see in the school before
admitting their children into it (Zsambok, 2014). Moreover, it will also help in assessing the
requirement level of the school in that area as well.
Secondary data: It is the second hand data which has already been collected by any other
researcher. It can be taken as a base while conducting any study of similar nature. Data can be in
the form of census, information being collected by public or government department,
organizational record, etc. In the given case, data of school that are currently present in the area
can be gathered through local publications. Further, data regarding basic amenities to be present
in the school can also be gathered from secondary sources. Hence, secondary source of data will
prove to be beneficial for the school which is planning to set up its branch in Surrey.
1.2 Survey methodologies and sampling methods
There are various methods that are present n case of survey. However, in order t find out
the suitable method for the same, Excellent School plc is required to analyse the survey methods
that can help in appropriate decision making. Therefore, in order to serve this purpose, it is
important to analyse the strength and weakness of all the survey methodologies.
1
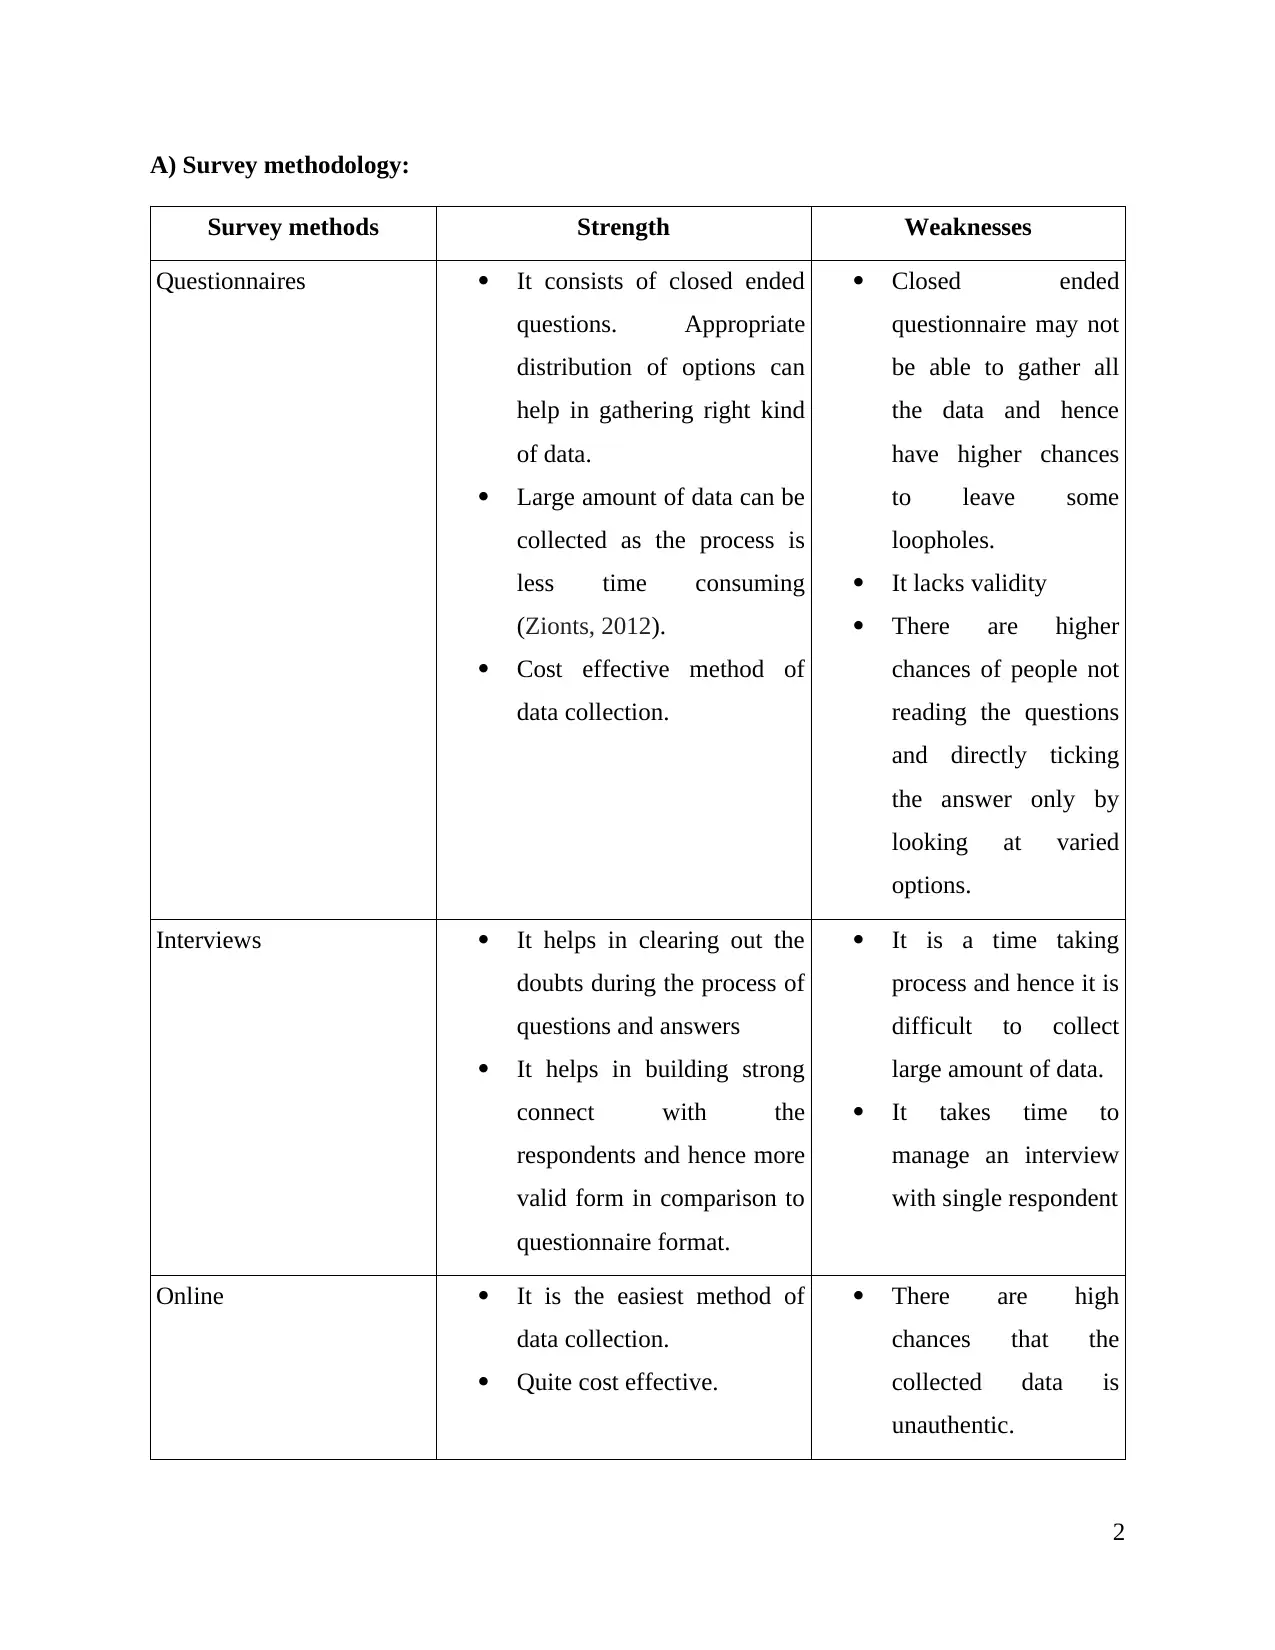
A) Survey methodology:
Survey methods Strength Weaknesses
Questionnaires It consists of closed ended
questions. Appropriate
distribution of options can
help in gathering right kind
of data.
Large amount of data can be
collected as the process is
less time consuming
(Zionts, 2012).
Cost effective method of
data collection.
Closed ended
questionnaire may not
be able to gather all
the data and hence
have higher chances
to leave some
loopholes.
It lacks validity
There are higher
chances of people not
reading the questions
and directly ticking
the answer only by
looking at varied
options.
Interviews It helps in clearing out the
doubts during the process of
questions and answers
It helps in building strong
connect with the
respondents and hence more
valid form in comparison to
questionnaire format.
It is a time taking
process and hence it is
difficult to collect
large amount of data.
It takes time to
manage an interview
with single respondent
Online It is the easiest method of
data collection.
Quite cost effective.
There are high
chances that the
collected data is
unauthentic.
2
Secure Best Marks with AI Grader
Need help grading? Try our AI Grader for instant feedback on your assignments.
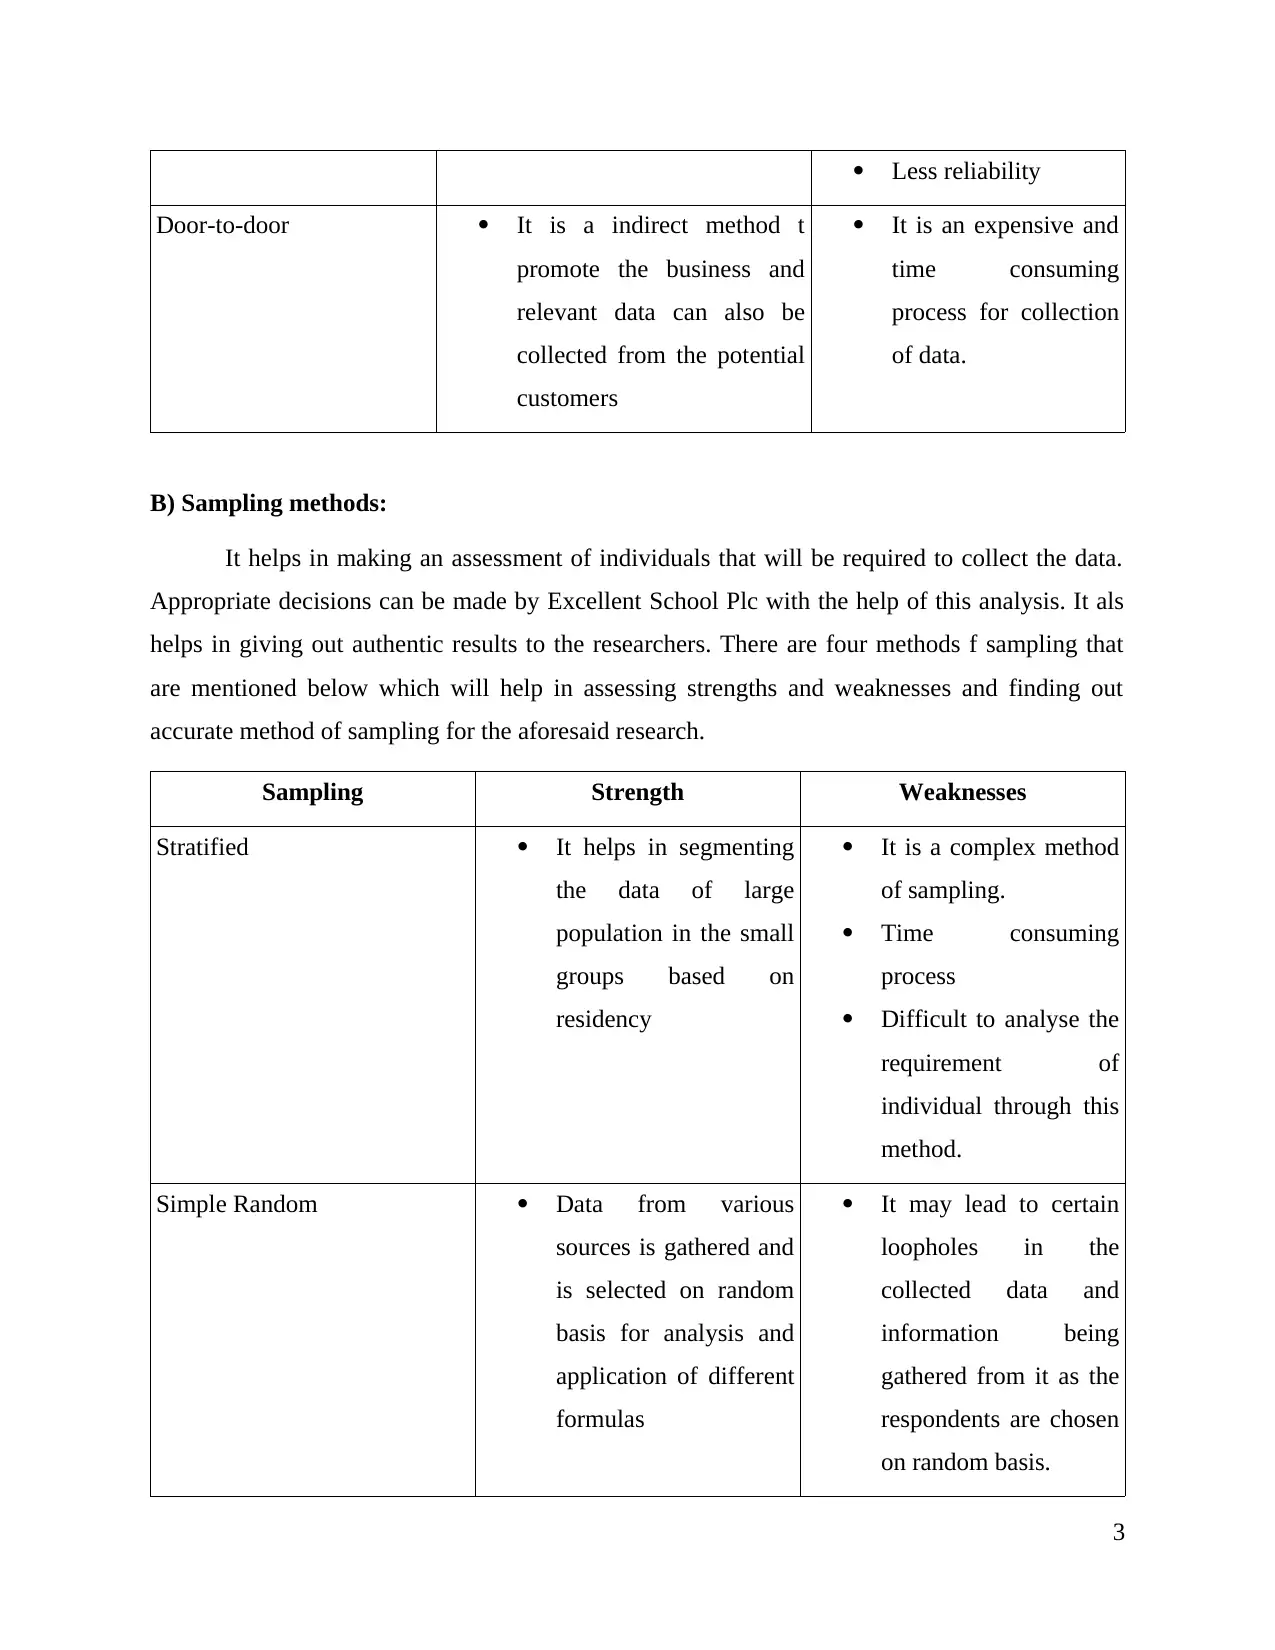
Less reliability
Door-to-door It is a indirect method t
promote the business and
relevant data can also be
collected from the potential
customers
It is an expensive and
time consuming
process for collection
of data.
B) Sampling methods:
It helps in making an assessment of individuals that will be required to collect the data.
Appropriate decisions can be made by Excellent School Plc with the help of this analysis. It als
helps in giving out authentic results to the researchers. There are four methods f sampling that
are mentioned below which will help in assessing strengths and weaknesses and finding out
accurate method of sampling for the aforesaid research.
Sampling Strength Weaknesses
Stratified It helps in segmenting
the data of large
population in the small
groups based on
residency
It is a complex method
of sampling.
Time consuming
process
Difficult to analyse the
requirement of
individual through this
method.
Simple Random Data from various
sources is gathered and
is selected on random
basis for analysis and
application of different
formulas
It may lead to certain
loopholes in the
collected data and
information being
gathered from it as the
respondents are chosen
on random basis.
3
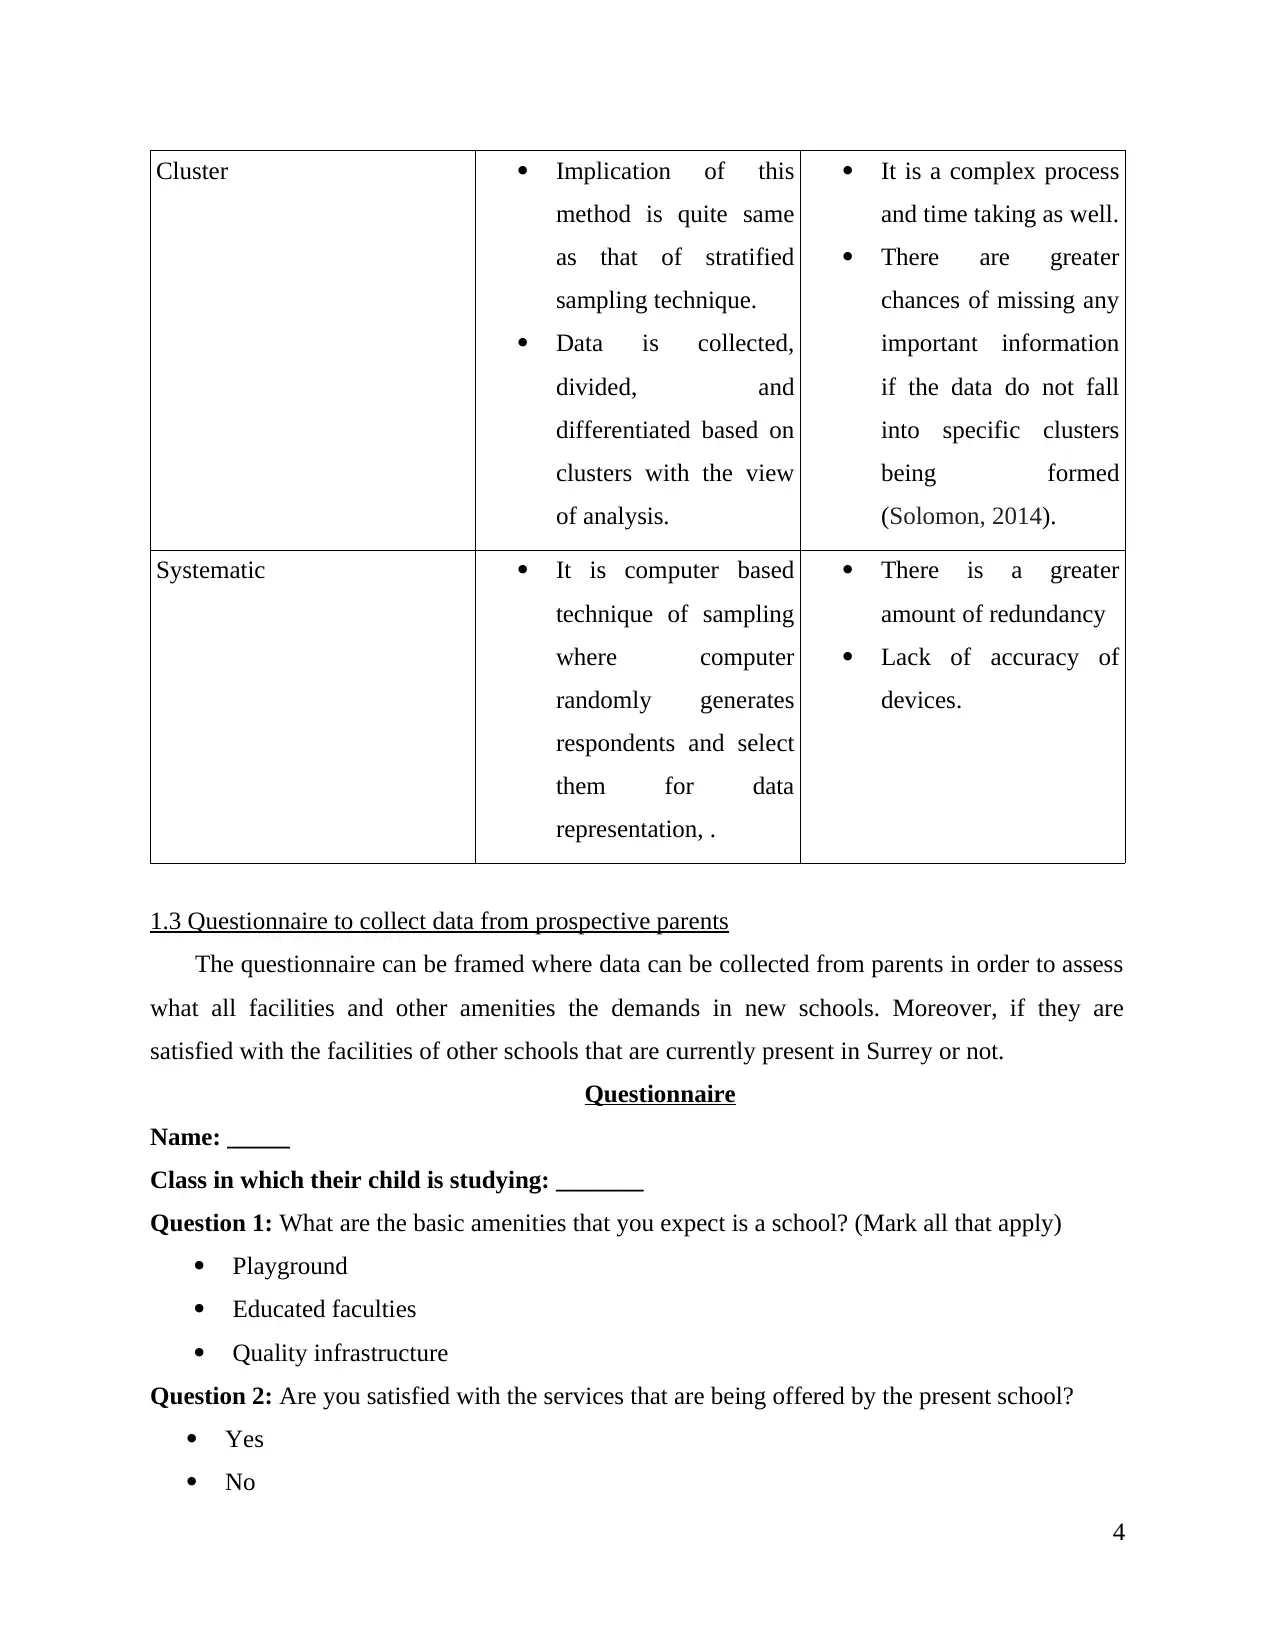
Cluster Implication of this
method is quite same
as that of stratified
sampling technique.
Data is collected,
divided, and
differentiated based on
clusters with the view
of analysis.
It is a complex process
and time taking as well.
There are greater
chances of missing any
important information
if the data do not fall
into specific clusters
being formed
(Solomon, 2014).
Systematic It is computer based
technique of sampling
where computer
randomly generates
respondents and select
them for data
representation, .
There is a greater
amount of redundancy
Lack of accuracy of
devices.
1.3 Questionnaire to collect data from prospective parents
The questionnaire can be framed where data can be collected from parents in order to assess
what all facilities and other amenities the demands in new schools. Moreover, if they are
satisfied with the facilities of other schools that are currently present in Surrey or not.
Questionnaire
Name: _____
Class in which their child is studying: _______
Question 1: What are the basic amenities that you expect is a school? (Mark all that apply)
Playground
Educated faculties
Quality infrastructure
Question 2: Are you satisfied with the services that are being offered by the present school?
Yes
No
4
Neutral
Question 3: Are you planning to change your kids school?
Yes
No
Can’t say
Question 4: Is IT lab holds great importance in the schools?
Yes
No
Sometimes
Question 5: Do you think education qualification plays an important role in teaching methods of
teacher?
Yes
No
Can’t say
Question 6: What location do you prefer for the school?
Nearby your house
A certain distance away from the house
Central of the city
Anywhere in the city
TASK 2
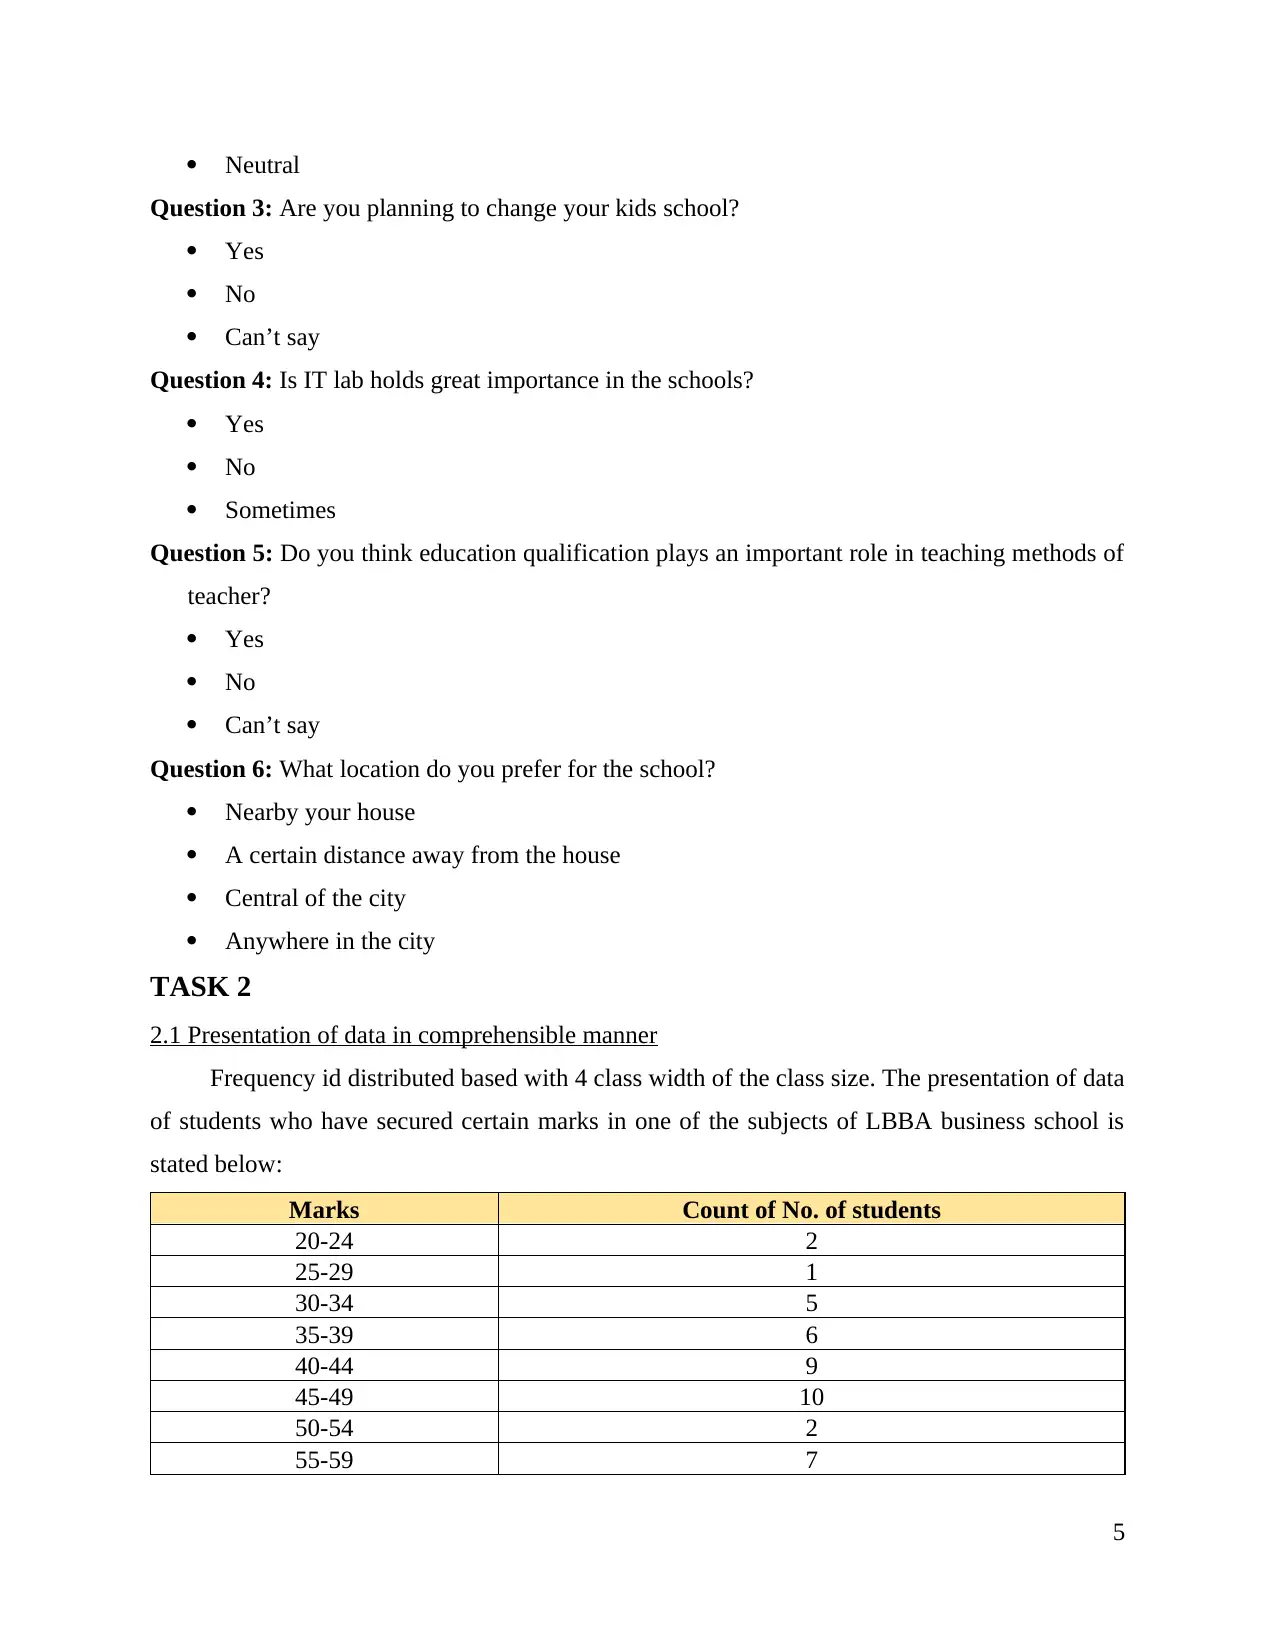
2.1 Presentation of data in comprehensible manner
Frequency id distributed based with 4 class width of the class size. The presentation of data
of students who have secured certain marks in one of the subjects of LBBA business school is
stated below:
Marks Count of No. of students
20-24 2
25-29 1
30-34 5
35-39 6
40-44 9
45-49 10
50-54 2
55-59 7
5
Question 3: Are you planning to change your kids school?
Yes
No
Can’t say
Question 4: Is IT lab holds great importance in the schools?
Yes
No
Sometimes
Question 5: Do you think education qualification plays an important role in teaching methods of
teacher?
Yes
No
Can’t say
Question 6: What location do you prefer for the school?
Nearby your house
A certain distance away from the house
Central of the city
Anywhere in the city
TASK 2
2.1 Presentation of data in comprehensible manner
Frequency id distributed based with 4 class width of the class size. The presentation of data
of students who have secured certain marks in one of the subjects of LBBA business school is
stated below:
Marks Count of No. of students
20-24 2
25-29 1
30-34 5
35-39 6
40-44 9
45-49 10
50-54 2
55-59 7
5
Paraphrase This Document
Need a fresh take? Get an instant paraphrase of this document with our AI Paraphraser
60-64 3
65-69 2
70-75 3
Grand Total 50
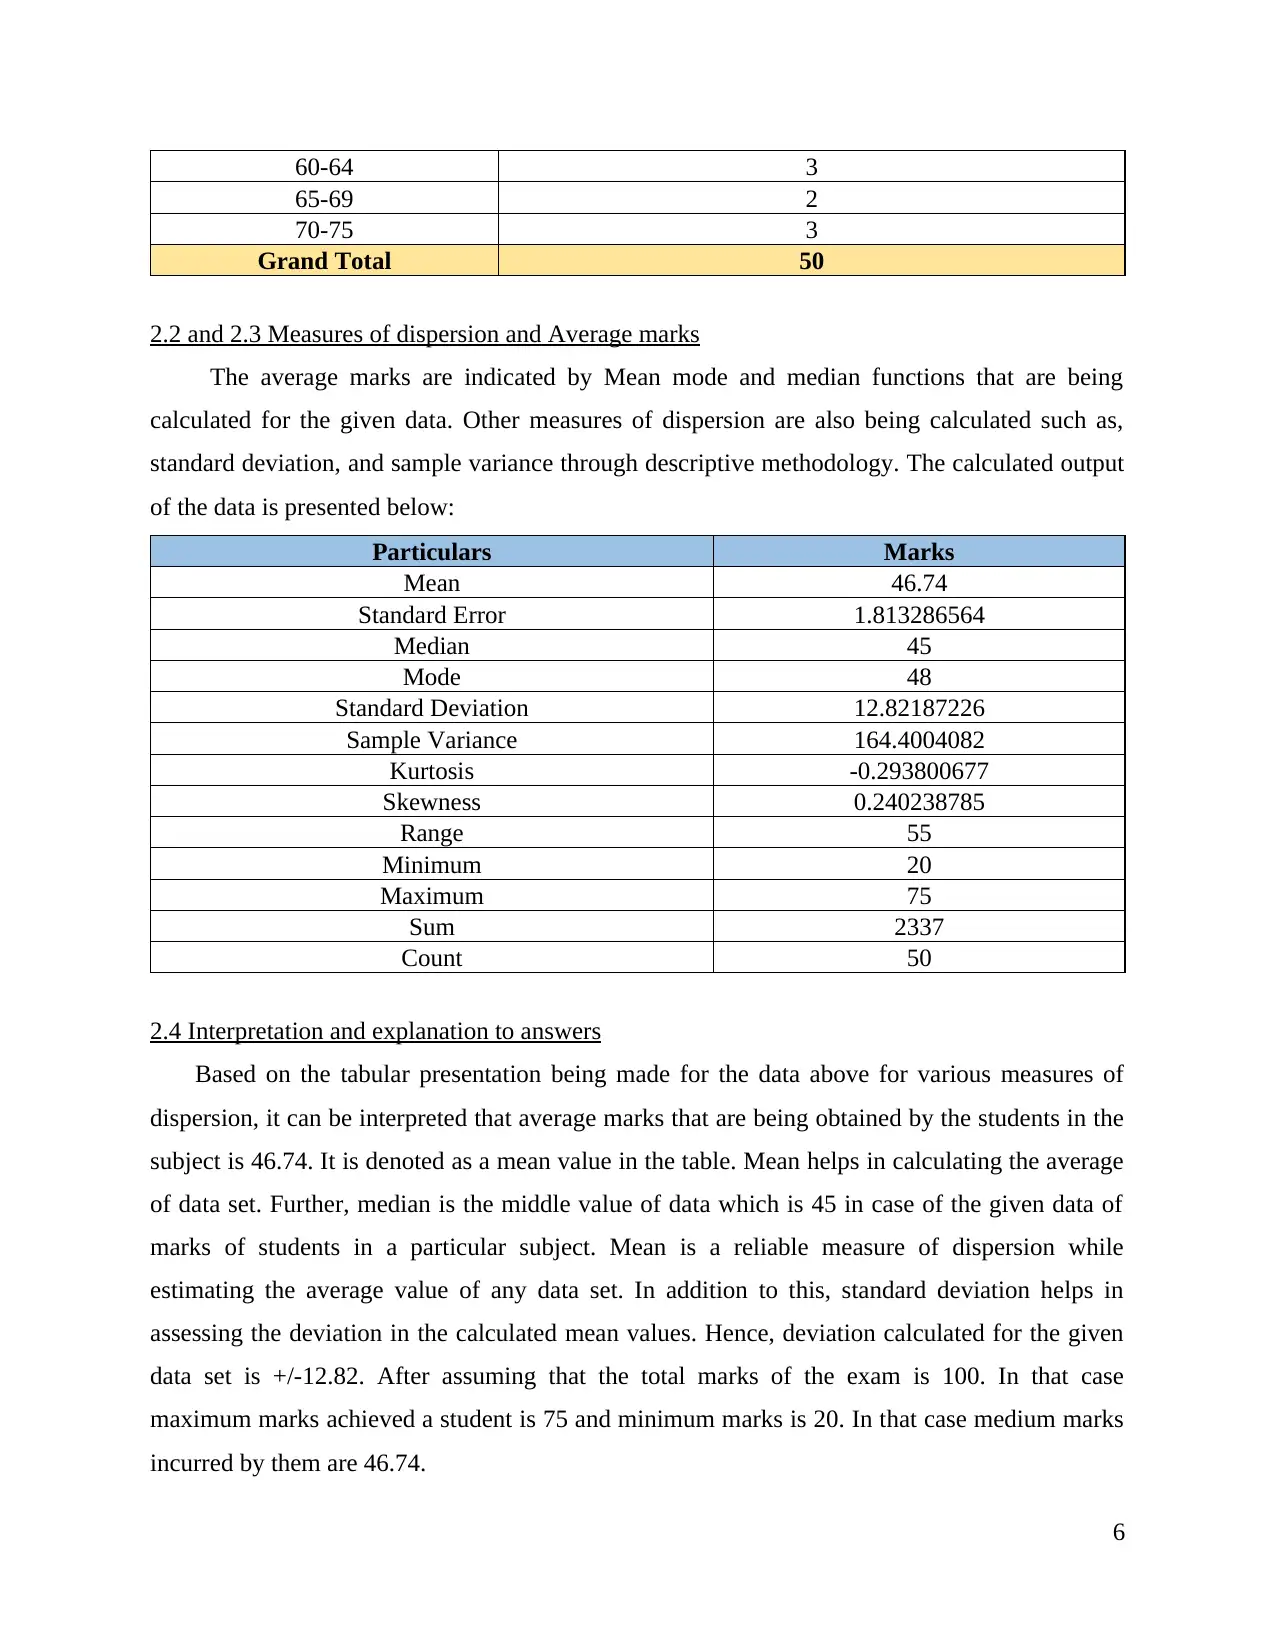
2.2 and 2.3 Measures of dispersion and Average marks
The average marks are indicated by Mean mode and median functions that are being
calculated for the given data. Other measures of dispersion are also being calculated such as,
standard deviation, and sample variance through descriptive methodology. The calculated output
of the data is presented below:
Particulars Marks
Mean 46.74
Standard Error 1.813286564
Median 45
Mode 48
Standard Deviation 12.82187226
Sample Variance 164.4004082
Kurtosis -0.293800677
Skewness 0.240238785
Range 55
Minimum 20
Maximum 75
Sum 2337
Count 50
2.4 Interpretation and explanation to answers
Based on the tabular presentation being made for the data above for various measures of
dispersion, it can be interpreted that average marks that are being obtained by the students in the
subject is 46.74. It is denoted as a mean value in the table. Mean helps in calculating the average
of data set. Further, median is the middle value of data which is 45 in case of the given data of
marks of students in a particular subject. Mean is a reliable measure of dispersion while
estimating the average value of any data set. In addition to this, standard deviation helps in
assessing the deviation in the calculated mean values. Hence, deviation calculated for the given
data set is +/-12.82. After assuming that the total marks of the exam is 100. In that case
maximum marks achieved a student is 75 and minimum marks is 20. In that case medium marks
incurred by them are 46.74.
6
65-69 2
70-75 3
Grand Total 50
2.2 and 2.3 Measures of dispersion and Average marks
The average marks are indicated by Mean mode and median functions that are being
calculated for the given data. Other measures of dispersion are also being calculated such as,
standard deviation, and sample variance through descriptive methodology. The calculated output
of the data is presented below:
Particulars Marks
Mean 46.74
Standard Error 1.813286564
Median 45
Mode 48
Standard Deviation 12.82187226
Sample Variance 164.4004082
Kurtosis -0.293800677
Skewness 0.240238785
Range 55
Minimum 20
Maximum 75
Sum 2337
Count 50
2.4 Interpretation and explanation to answers
Based on the tabular presentation being made for the data above for various measures of
dispersion, it can be interpreted that average marks that are being obtained by the students in the
subject is 46.74. It is denoted as a mean value in the table. Mean helps in calculating the average
of data set. Further, median is the middle value of data which is 45 in case of the given data of
marks of students in a particular subject. Mean is a reliable measure of dispersion while
estimating the average value of any data set. In addition to this, standard deviation helps in
assessing the deviation in the calculated mean values. Hence, deviation calculated for the given
data set is +/-12.82. After assuming that the total marks of the exam is 100. In that case
maximum marks achieved a student is 75 and minimum marks is 20. In that case medium marks
incurred by them are 46.74.
6
The measures that have been used above are the measure of central tendency and hence
are quite reliable and authentic (Wang And et.al., 2013). The degree of change that is expected
from the data is also located very well in the table with the help of standard deviation and
standard error. The total count of marks is 50. It shows that there are 50 people who appeared in
the exam. The information presented in the table has helped in gathering adequate amount of
information regarding the dataset given in the case scenario.
TASK 3
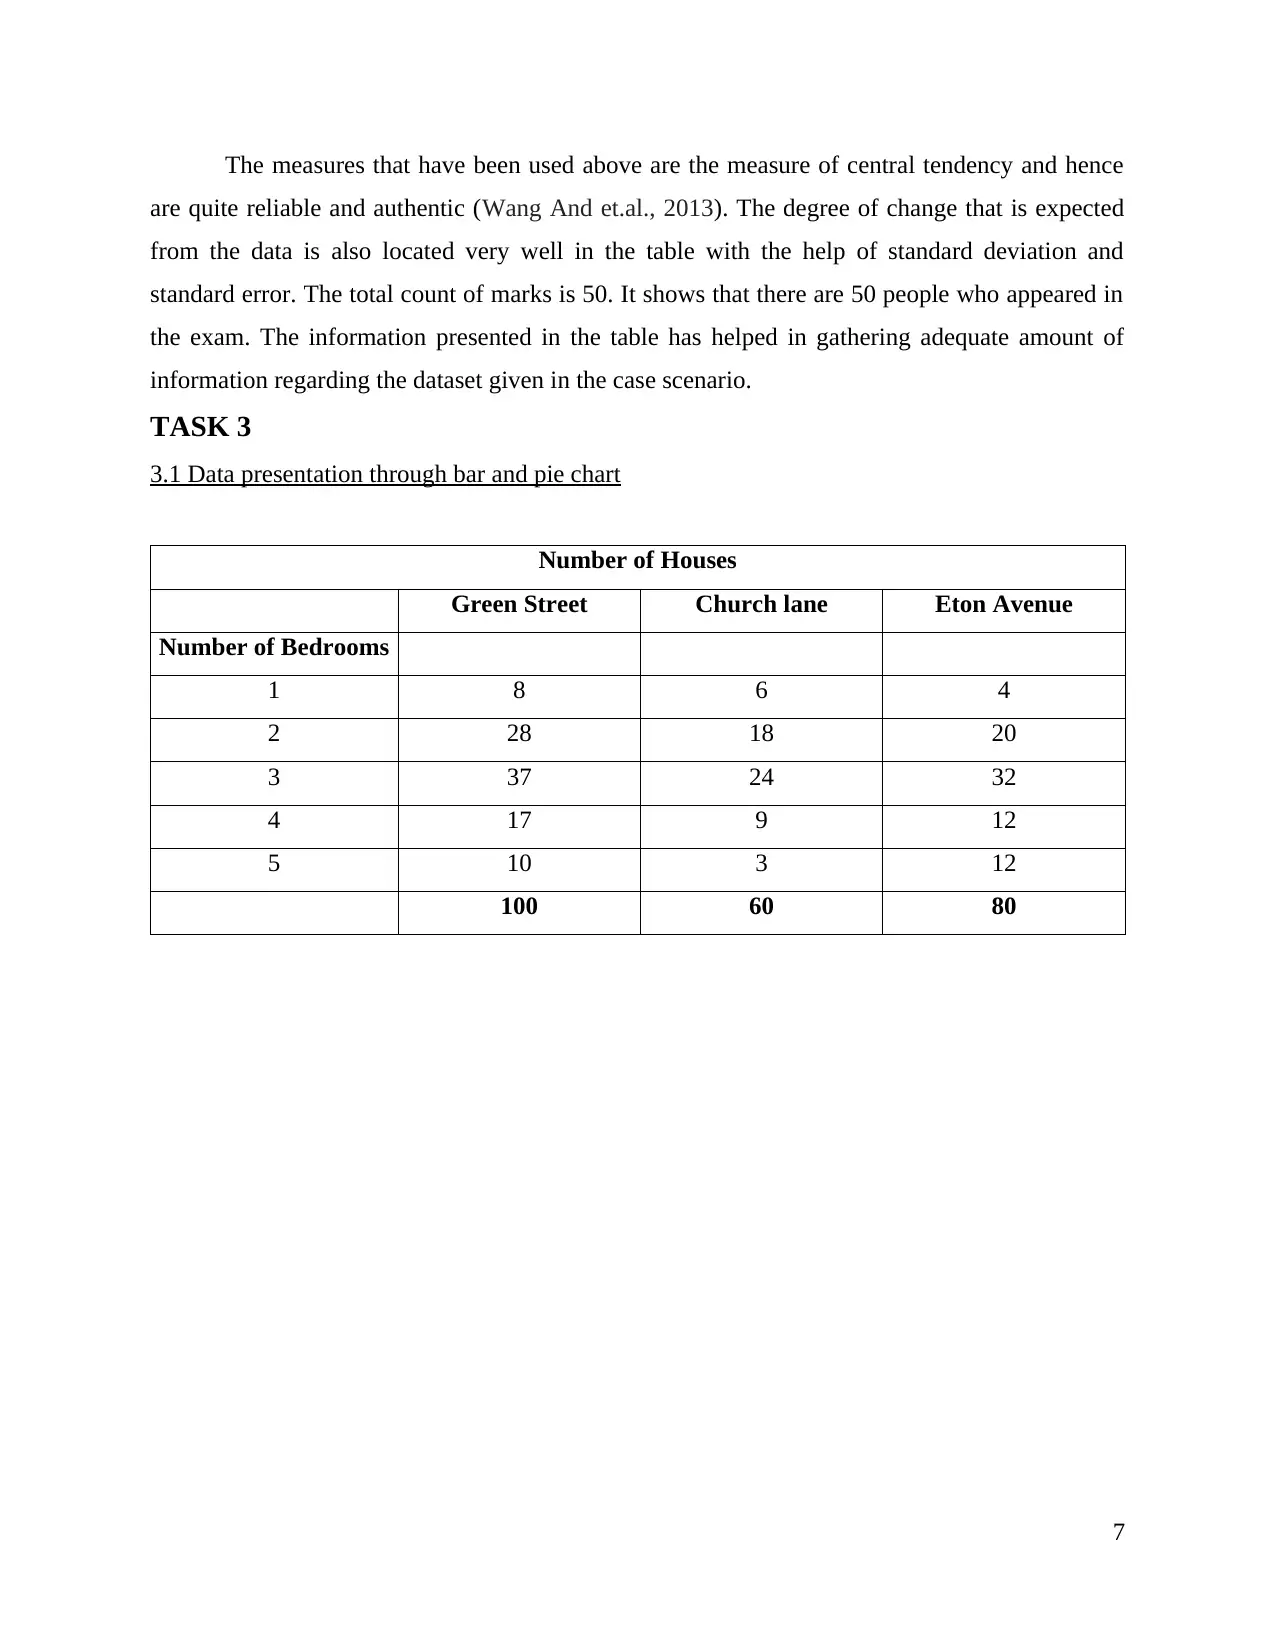
3.1 Data presentation through bar and pie chart
Number of Houses
Green Street Church lane Eton Avenue
Number of Bedrooms
1 8 6 4
2 28 18 20
3 37 24 32
4 17 9 12
5 10 3 12
100 60 80
7
are quite reliable and authentic (Wang And et.al., 2013). The degree of change that is expected
from the data is also located very well in the table with the help of standard deviation and
standard error. The total count of marks is 50. It shows that there are 50 people who appeared in
the exam. The information presented in the table has helped in gathering adequate amount of
information regarding the dataset given in the case scenario.
TASK 3
3.1 Data presentation through bar and pie chart
Number of Houses
Green Street Church lane Eton Avenue
Number of Bedrooms
1 8 6 4
2 28 18 20
3 37 24 32
4 17 9 12
5 10 3 12
100 60 80
7
Number of
Bedrooms 1 2 3 4 5
0
5
10
15
20
25
30
35
40
Green Street
Church lane
Eton Avenue
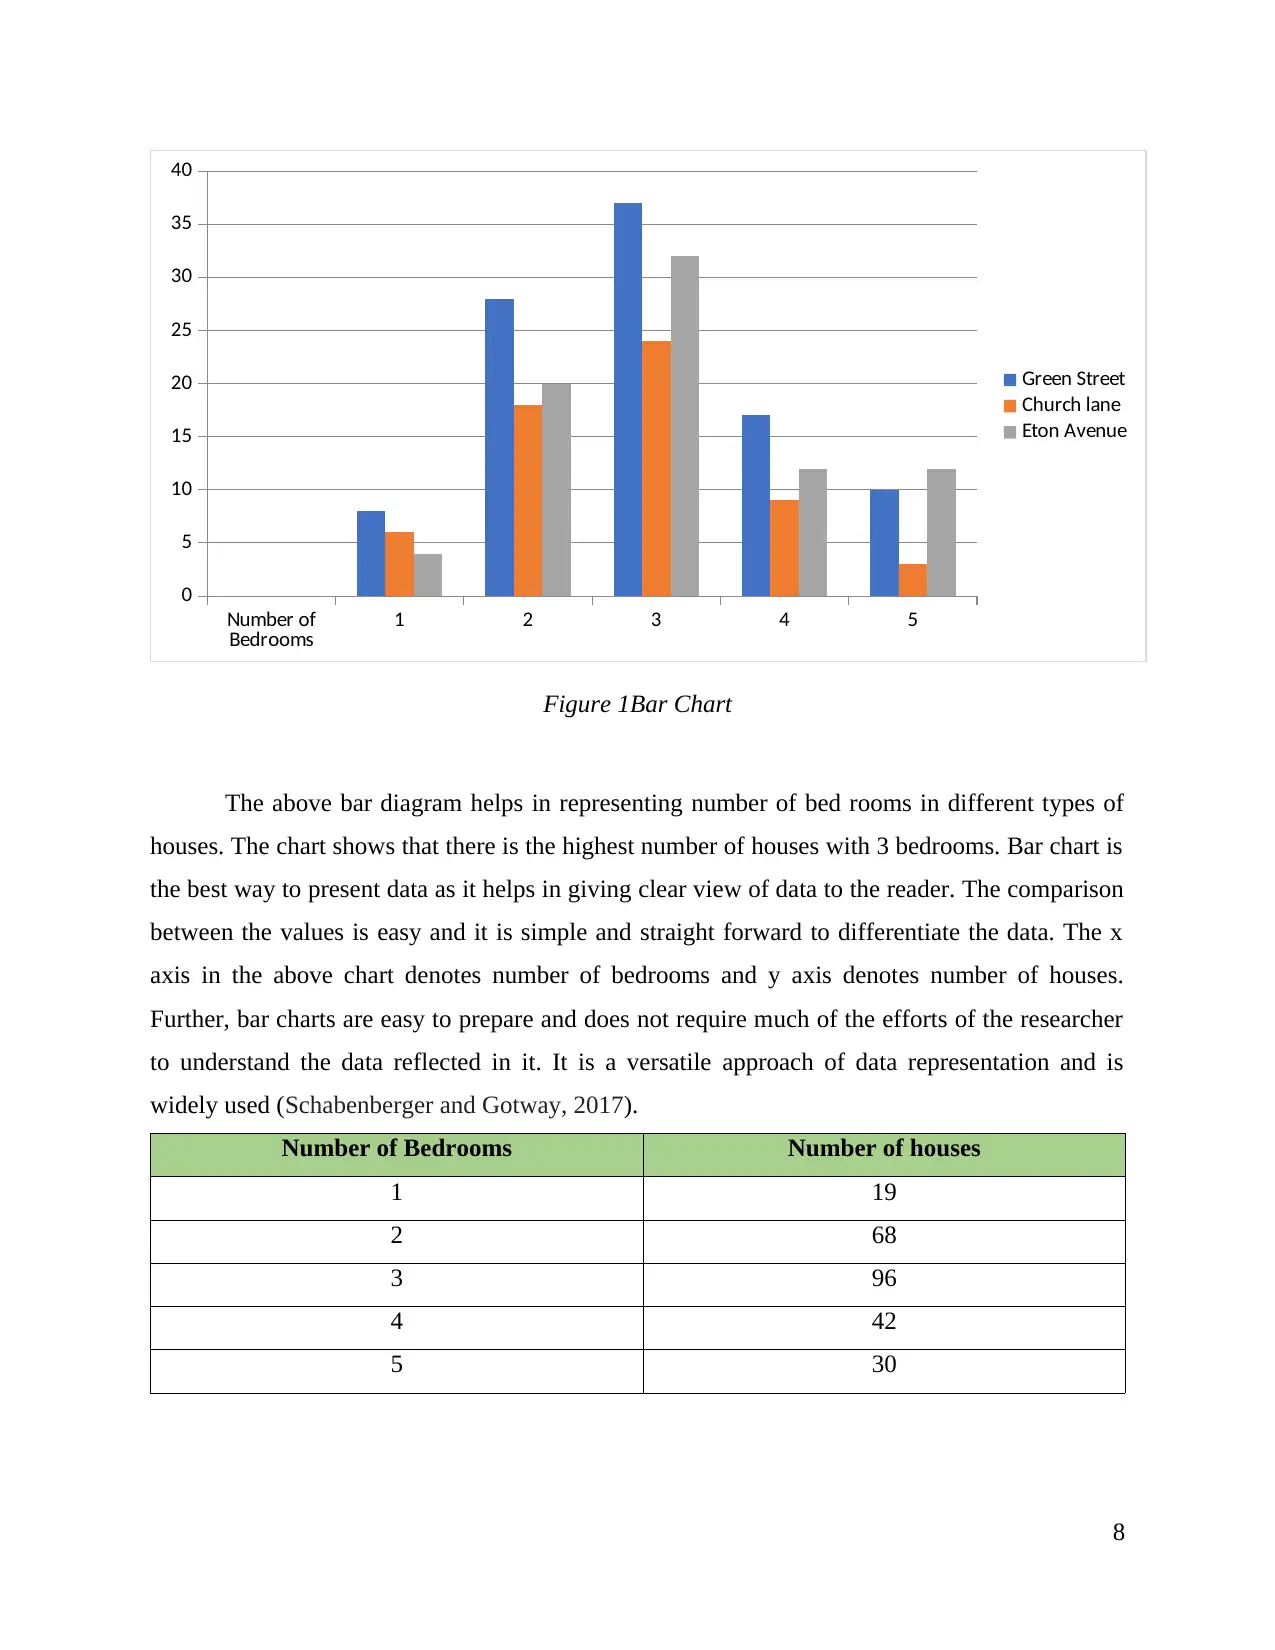
Figure 1Bar Chart
The above bar diagram helps in representing number of bed rooms in different types of
houses. The chart shows that there is the highest number of houses with 3 bedrooms. Bar chart is
the best way to present data as it helps in giving clear view of data to the reader. The comparison
between the values is easy and it is simple and straight forward to differentiate the data. The x
axis in the above chart denotes number of bedrooms and y axis denotes number of houses.
Further, bar charts are easy to prepare and does not require much of the efforts of the researcher
to understand the data reflected in it. It is a versatile approach of data representation and is
widely used (Schabenberger and Gotway, 2017).
Number of Bedrooms Number of houses
1 19
2 68
3 96
4 42
5 30
8
Bedrooms 1 2 3 4 5
0
5
10
15
20
25
30
35
40
Green Street
Church lane
Eton Avenue
Figure 1Bar Chart
The above bar diagram helps in representing number of bed rooms in different types of
houses. The chart shows that there is the highest number of houses with 3 bedrooms. Bar chart is
the best way to present data as it helps in giving clear view of data to the reader. The comparison
between the values is easy and it is simple and straight forward to differentiate the data. The x
axis in the above chart denotes number of bedrooms and y axis denotes number of houses.
Further, bar charts are easy to prepare and does not require much of the efforts of the researcher
to understand the data reflected in it. It is a versatile approach of data representation and is
widely used (Schabenberger and Gotway, 2017).
Number of Bedrooms Number of houses
1 19
2 68
3 96
4 42
5 30
8
Secure Best Marks with AI Grader
Need help grading? Try our AI Grader for instant feedback on your assignments.
Number of Bedrooms
1
2
3
4
5
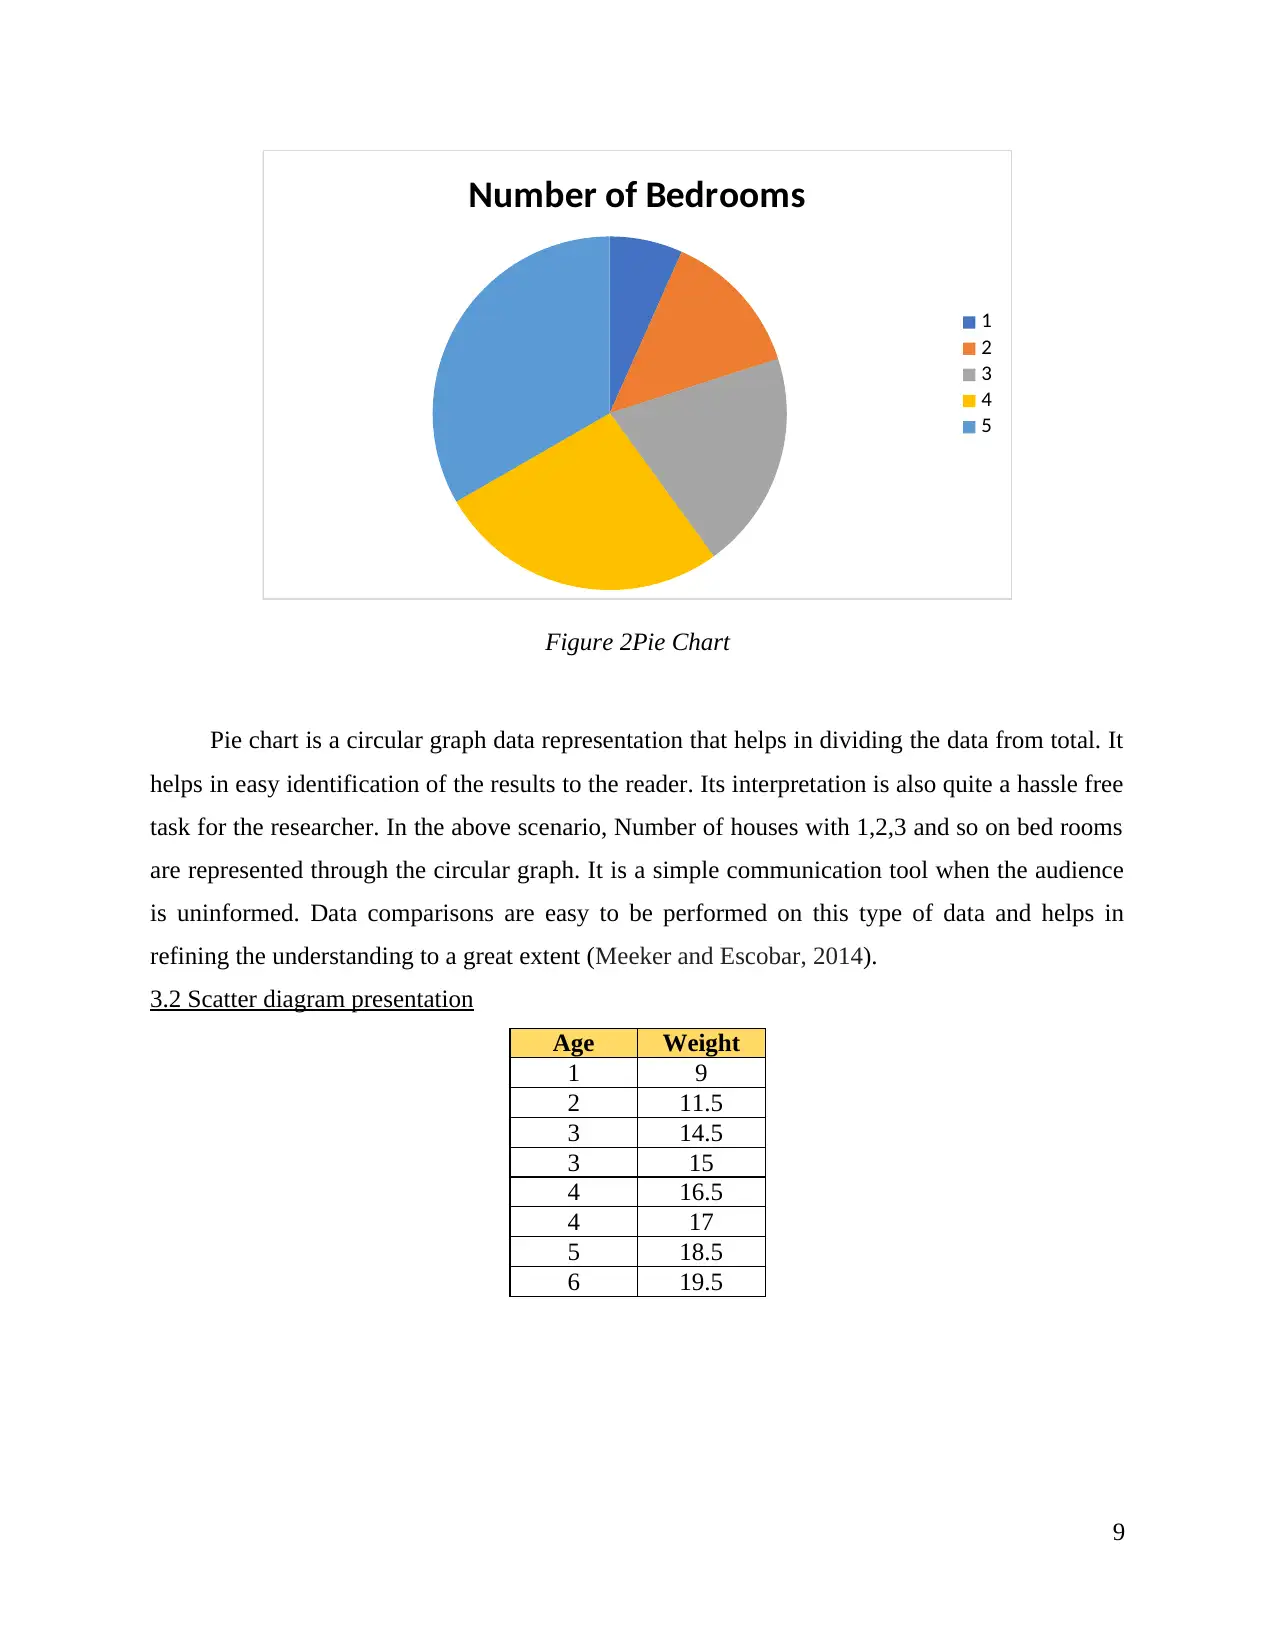
Figure 2Pie Chart
Pie chart is a circular graph data representation that helps in dividing the data from total. It
helps in easy identification of the results to the reader. Its interpretation is also quite a hassle free
task for the researcher. In the above scenario, Number of houses with 1,2,3 and so on bed rooms
are represented through the circular graph. It is a simple communication tool when the audience
is uninformed. Data comparisons are easy to be performed on this type of data and helps in
refining the understanding to a great extent (Meeker and Escobar, 2014).
3.2 Scatter diagram presentation
Age Weight
1 9
2 11.5
3 14.5
3 15
4 16.5
4 17
5 18.5
6 19.5
9
1
2
3
4
5
Figure 2Pie Chart
Pie chart is a circular graph data representation that helps in dividing the data from total. It
helps in easy identification of the results to the reader. Its interpretation is also quite a hassle free
task for the researcher. In the above scenario, Number of houses with 1,2,3 and so on bed rooms
are represented through the circular graph. It is a simple communication tool when the audience
is uninformed. Data comparisons are easy to be performed on this type of data and helps in
refining the understanding to a great extent (Meeker and Escobar, 2014).
3.2 Scatter diagram presentation
Age Weight
1 9
2 11.5
3 14.5
3 15
4 16.5
4 17
5 18.5
6 19.5
9
0 1 2 3 4 5 6 7
0
5
10
15
20
25
Weight
Weight
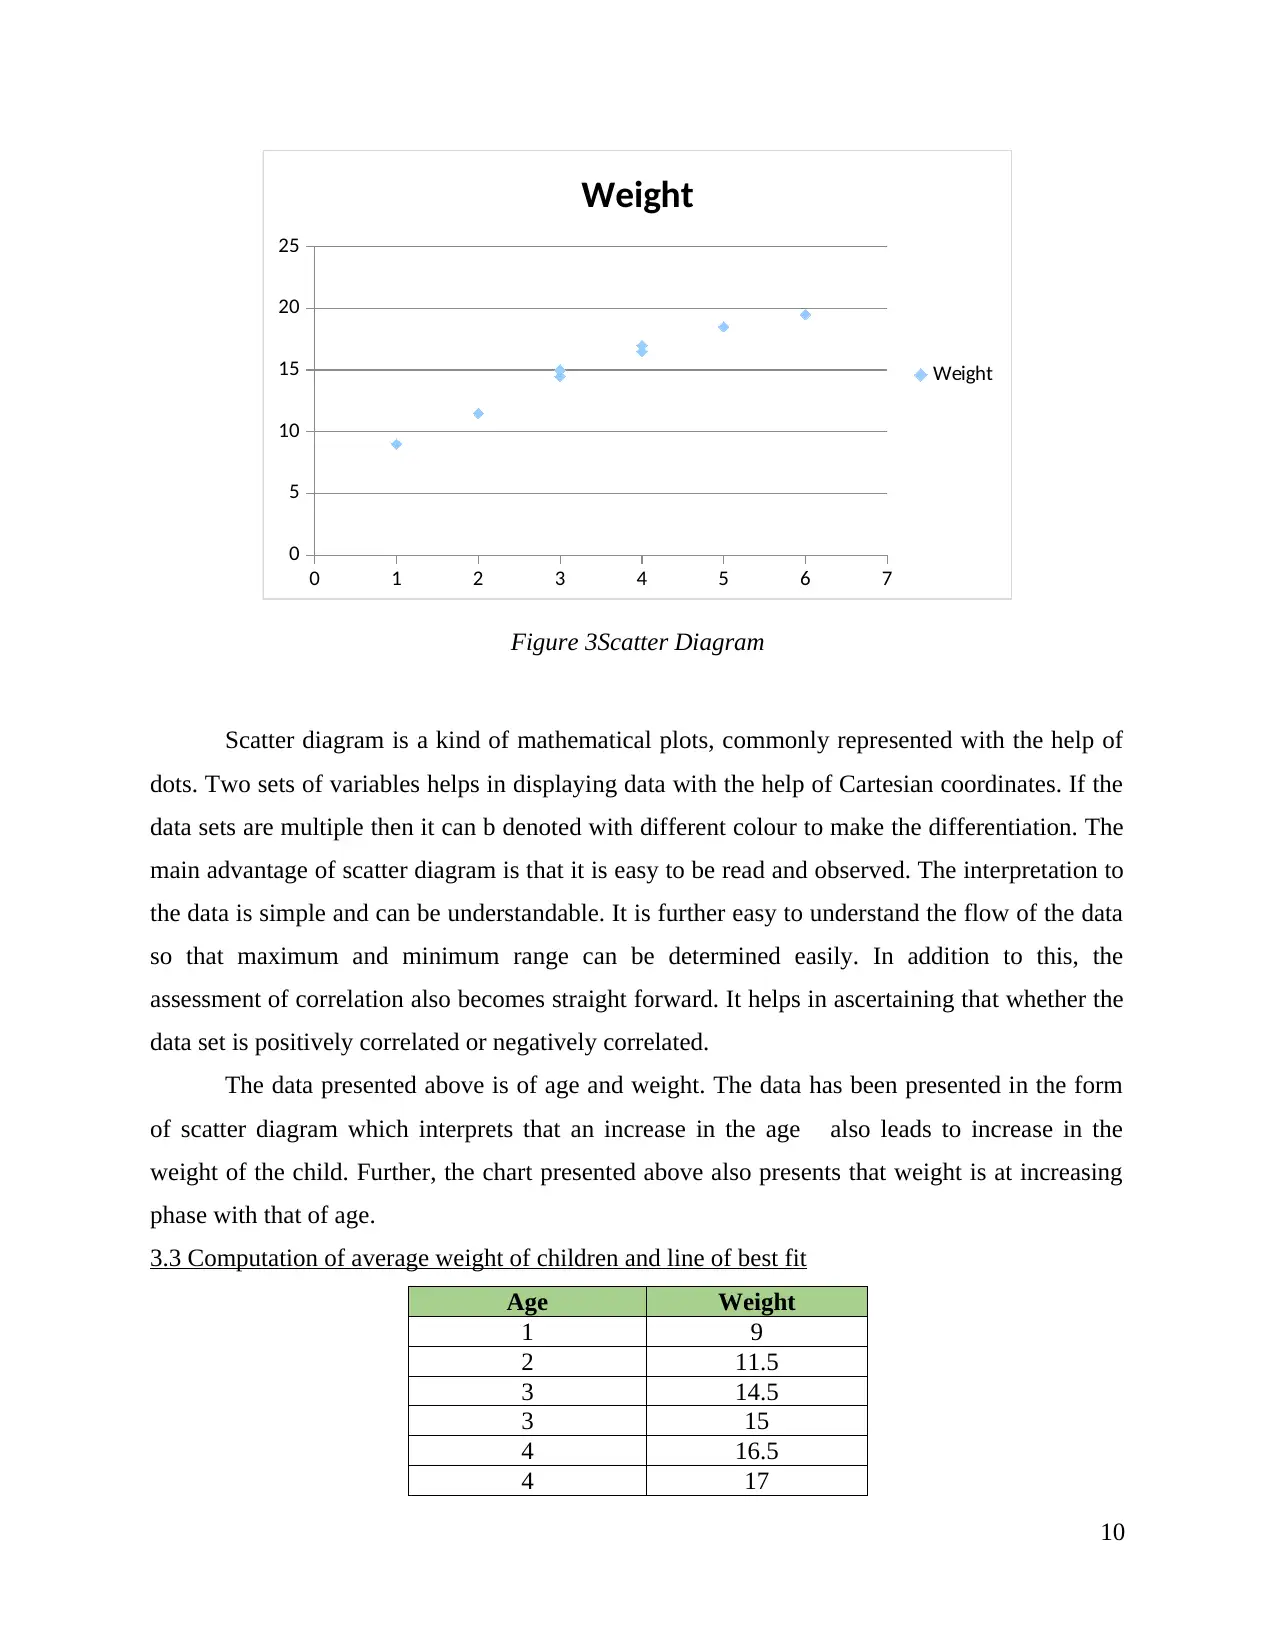
Figure 3Scatter Diagram
Scatter diagram is a kind of mathematical plots, commonly represented with the help of
dots. Two sets of variables helps in displaying data with the help of Cartesian coordinates. If the
data sets are multiple then it can b denoted with different colour to make the differentiation. The
main advantage of scatter diagram is that it is easy to be read and observed. The interpretation to
the data is simple and can be understandable. It is further easy to understand the flow of the data
so that maximum and minimum range can be determined easily. In addition to this, the
assessment of correlation also becomes straight forward. It helps in ascertaining that whether the
data set is positively correlated or negatively correlated.
The data presented above is of age and weight. The data has been presented in the form
of scatter diagram which interprets that an increase in the age also leads to increase in the
weight of the child. Further, the chart presented above also presents that weight is at increasing
phase with that of age.
3.3 Computation of average weight of children and line of best fit
Age Weight
1 9
2 11.5
3 14.5
3 15
4 16.5
4 17
10
0
5
10
15
20
25
Weight
Weight
Figure 3Scatter Diagram
Scatter diagram is a kind of mathematical plots, commonly represented with the help of
dots. Two sets of variables helps in displaying data with the help of Cartesian coordinates. If the
data sets are multiple then it can b denoted with different colour to make the differentiation. The
main advantage of scatter diagram is that it is easy to be read and observed. The interpretation to
the data is simple and can be understandable. It is further easy to understand the flow of the data
so that maximum and minimum range can be determined easily. In addition to this, the
assessment of correlation also becomes straight forward. It helps in ascertaining that whether the
data set is positively correlated or negatively correlated.
The data presented above is of age and weight. The data has been presented in the form
of scatter diagram which interprets that an increase in the age also leads to increase in the
weight of the child. Further, the chart presented above also presents that weight is at increasing
phase with that of age.
3.3 Computation of average weight of children and line of best fit
Age Weight
1 9
2 11.5
3 14.5
3 15
4 16.5
4 17
10

5 18.5
6 19.5
Sum of Weights 121.5
Average Weight 15.1875
The formula for average is
= Sum of weights / Number of kids
= 121.5 / 8
= 15.19
Hence, based on calculation, average weight for the kids is 15.19 lbs
Figure 4Line Chart
There is a growth in the weight as the child olds one month. Based on the frequency and
intensity of growth, the weight of the child can be calculated for the month of 7th and 8th month
as well. Hence, the assumption can be made that there will been increase in 5% weight based on
the given data. Hence, increase in 5% weight for 7th month child is 20.475 lbs and 8th month child
can be 21.49 lbs.
TASK 4
4.1 Various methods of investment appraisal and its merits and demerits
The given scenario is of Speedy Fitters Plc,, which planning the expansion for its
operation. It is planning to include some new offering in its resent basket. Speedy Fitters wants
11
Paraphrase This Document
Need a fresh take? Get an instant paraphrase of this document with our AI Paraphraser

to provide movable auto services at the door step of the customers. The company is expecting
that the new expansion in its offerings will help the company to increase its revenues. Moreover,
it will also lead to enhancement in the profits as well. It will be required to invest some money as
funds in the initial phase of expansion. The feasibility of the plan can be studied by making an
assessment of various investment appraisal techniques. The assessment is made below in detail
so that better decision making can be made by Speedy Fitters Plc:
Payback period: The length of time required so as to get the investment amount back.
It is considered as an important determinant as if the amount invested is not received in
time then the project is not considered as viable for the company. The main
disadvantage of this approach is that it do not consider time value money concept and
hence makes the process of calculation of feasibility study irrelevant. The picture given
by this type of investment appraisal method is blur. Hence, it must not be used by
organization (Bock and Diday, 2012).
Accounting rate of return (ARR): It is a type of financial ratio that is used in capital
budgeting. It is the amount of profit that is expected as return from investment that has
been made by the entity. In order to calculate ARR, average profit is divided with the
initial investment in order to get the ratio of expected return. Further, the main
disadvantage of this method is that it does not consider the concept of time value and
money while calculating average return from the project (Ghahremani, Aghaie, and
Abedzadeh, 2012). Hence, it is not considered as a good measure to ascertain the
feasibility of the project.
Internal Rate of return (IRR): It is another metric of capital budgeting so as to
measure the profitability of the project from the investment made. It is the rate of return
where the Net Present Value (NPV) of the investment is considered as zero. It
considers future cash inflow and outflow from the project investment (Grob, 2013).
The main advantage of this approach is that it considers time value and money concept
which helps in ascertaining the sustainability of the project and helps in making
suitable choice that whether the investment will prove to be fruitful for the company or
not.
Net Present Value (NPV): Net present Value concept is considered as one of the most
important aspect of investment appraisal techniques. The difference between present
12

value of cash inflow and present value of cash outflow giver net Present Value of the
project (Bierman and Smidt, 2012). If positive cash flow is received then it represents
that the project is viable for the company. Otherwise, it indicates that the investment in
the project can lead the company into losses. It helps in analysing that whether the
project will prove to be profitable for the company or not. It is considered as one of the
most reliable methods among all the other investment appraisal methods.
4.2 Preparation of project plan
It is important for every company to plan before investing in any of the new business. In
order to fulfil this requirement, a proper plan has been prepared so that its suitable course of
actions can be made before launching any new services to the customers (Hise and Strawser,
2013). A plan of action for Speedy Fitters Plc has been prepared. Details of the steps are being
clearly represented through a Gantt chart and a network diagram which will act as a guide for the
entity so that the plan can be implemented in a well defined manner.
S. No. Activities Duration Preceding activities
1 Conducting of market survey 8 days
2 Identification of target market 6 days 1
3 Planning operations for the project 5 days 2
4 Location decision 2 days 1,2
5 Recruiting employees 3 days 3
6 Estimating cash flow from the project 3 days 4,5
7 Managing monetary funds 9 days 3
8 Promoting and marketing new services 7 days 4
9 Pilot testing 3 days 7
10 Launching new services in the market 3 dyas 8
Task
Mode Task Name Duration Start Finish Predecessors
Manually
Schedule
d
Conducting of market
survey 8 days 12/9/2017 12/19/2017
Manually
Schedule
d
Identification of target
market 6 days 12/20/2017 12/27/2017 1
Manually
Schedule
Planning operations for
the project
5 days 12/28/2017 1/3/2018 2
13

d
Manually
Schedule
d
Location decision 2 days 12/28/2017 12/29/2017 1,2
Manually
Schedule
d
Recruiting employees 3 days 1/4/2018 1/8/2018 3
Manually
Schedule
d
Estimating cash flow
from the project 3 days 1/9/2018 1/11/2018 4,5
Manually
Schedule
d
Managing monetary
funds 9 days 1/4/2018 1/16/2018 3
Manually
Schedule
d
Promoting and marketing
new services 7 days 1/1/2018 1/9/2018 4
Manually
Schedule
d
Pilot testing 3 days 1/17/2018 1/19/2018 7
Manually
Schedule
d
Launching new services
in the market 3 days 1/10/2018 1/12/2018 8
Figure 5Gantt chart
14
Manually
Schedule
d
Location decision 2 days 12/28/2017 12/29/2017 1,2
Manually
Schedule
d
Recruiting employees 3 days 1/4/2018 1/8/2018 3
Manually
Schedule
d
Estimating cash flow
from the project 3 days 1/9/2018 1/11/2018 4,5
Manually
Schedule
d
Managing monetary
funds 9 days 1/4/2018 1/16/2018 3
Manually
Schedule
d
Promoting and marketing
new services 7 days 1/1/2018 1/9/2018 4
Manually
Schedule
d
Pilot testing 3 days 1/17/2018 1/19/2018 7
Manually
Schedule
d
Launching new services
in the market 3 days 1/10/2018 1/12/2018 8
Figure 5Gantt chart
14
Secure Best Marks with AI Grader
Need help grading? Try our AI Grader for instant feedback on your assignments.
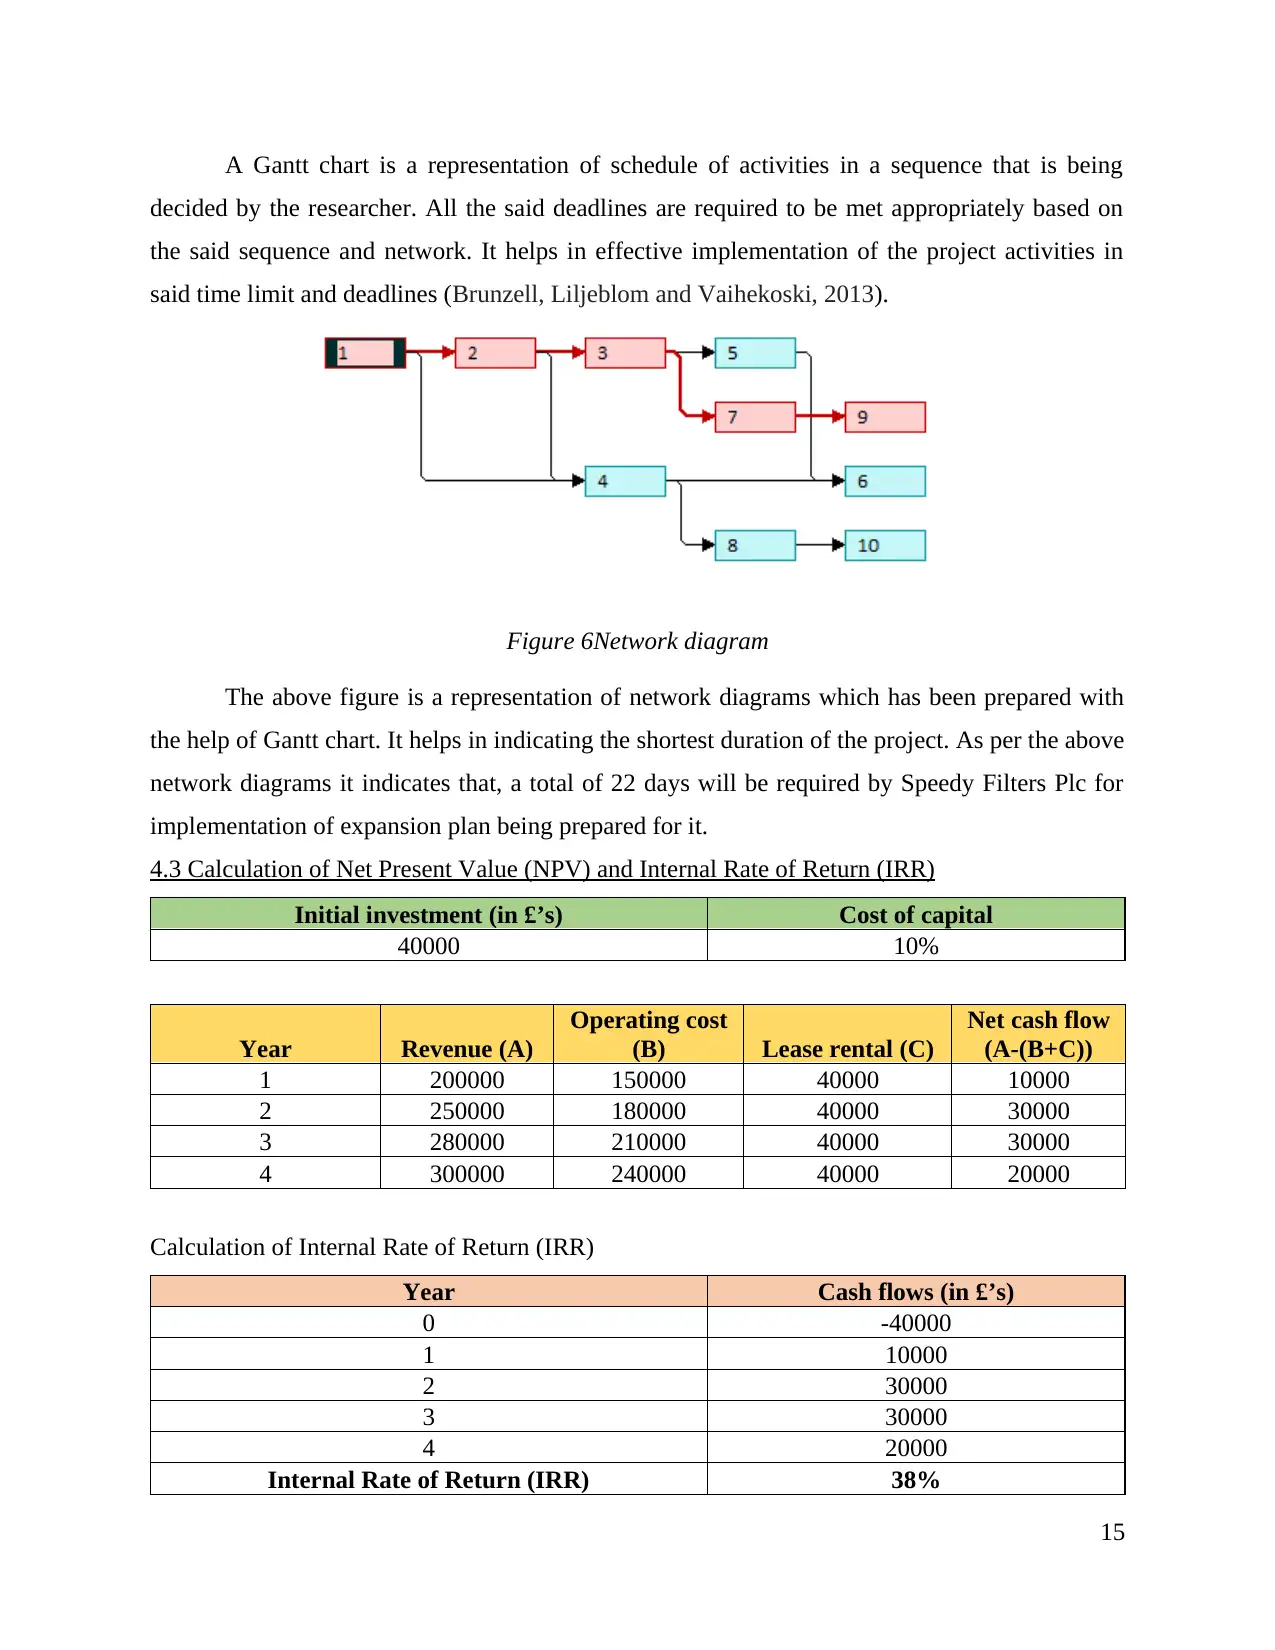
A Gantt chart is a representation of schedule of activities in a sequence that is being
decided by the researcher. All the said deadlines are required to be met appropriately based on
the said sequence and network. It helps in effective implementation of the project activities in
said time limit and deadlines (Brunzell, Liljeblom and Vaihekoski, 2013).
Figure 6Network diagram
The above figure is a representation of network diagrams which has been prepared with
the help of Gantt chart. It helps in indicating the shortest duration of the project. As per the above
network diagrams it indicates that, a total of 22 days will be required by Speedy Filters Plc for
implementation of expansion plan being prepared for it.
4.3 Calculation of Net Present Value (NPV) and Internal Rate of Return (IRR)
Initial investment (in £’s) Cost of capital
40000 10%
Year Revenue (A)
Operating cost
(B) Lease rental (C)
Net cash flow
(A-(B+C))
1 200000 150000 40000 10000
2 250000 180000 40000 30000
3 280000 210000 40000 30000
4 300000 240000 40000 20000
Calculation of Internal Rate of Return (IRR)
Year Cash flows (in £’s)
0 -40000
1 10000
2 30000
3 30000
4 20000
Internal Rate of Return (IRR) 38%
15

Year Cash flow PV factor @ 10% Present value - cash flow
1 10000.00 0.91 9090.91
2 30000.00 0.83 24793.39
3 30000.00 0.75 22539.44
4 20000.00 0.68 13660.27
Total present value 70084.01
Less: Initial investment -40000.00
Net present value 30084.01
Based on the capital budgeting techniques used to ascertain the feasibility of the project,
it can be interpreted that the internal rate of return is 38% which is indicating that there are
chances of higher returns (Burns and Walker, 2015). Further, it can be assessed that the project
carries sufficient amount of capability for success. Further, the calculated Net Present Value for
the project is 30084.01which is positive. It represents that he project will prove to be beneficial
for the company. Hence, Speedy Filters must grab this expansion opportunity and opt for
expansion as it will help in increasing the revenue of the company.
CONCLUSION
Based on the above report, it can be concluded that, it is important to opt for better market
research techniques so that adequate information can be gathered by the researcher. It helps in
planning various aspect of the business. Survey methodologies have been outlines in the report in
detail. Further, the report also outlined different sampling methods such as, stratified, simple
random sampling, cluster sampling etc. Further, different representation methods such as, bar
chart, pie chart have been discussed in detail so as to ascertain that which is the best
representation of data. Further, different measures of dispersion such as mean, mode media,
standard deviation helps in ascertaining the data. In the end various investment appraisal
methods such as Net present Value, Internal Rate of Return , Average rate of return etc.
16

REFERENCES
Books and journals
Zsambok, C. E., 2014. Naturalistic decision making. Psychology Press.
Solomon, M. R., 2014. Consumer behavior: Buying, having, and being (Vol. 10). Upper Saddle
River, NJ: Prentice Hall.
Wang, X. And et.al., 2013. Experimental comparison of representation methods and distance
measures for time series data. Data Mining and Knowledge Discovery, pp.1-35.
Schabenberger, O. and Gotway, C. A., 2017. Statistical methods for spatial data analysis. CRC
press.
Meeker, W. Q. and Escobar, L. A., 2014. Statistical methods for reliability data. John Wiley &
Sons.
Bock, H. H. and Diday, E. eds., 2012. Analysis of symbolic data: exploratory methods for
extracting statistical information from complex data. Springer Science & Business Media.
Bierman Jr, H. and Smidt, S., 2012. The capital budgeting decision: economic analysis of
investment projects. Routledge.
Brunzell, T., Liljeblom, E. and Vaihekoski, M., 2013. Determinants of capital budgeting
methods and hurdle rates in Nordic firms. Accounting & Finance. 53(1). pp.85-110.
Burns, R. and Walker, J., 2015. Capital budgeting surveys: the future is now.
Ghahremani, M., Aghaie, A. and Abedzadeh, M., 2012. Capital budgeting technique selection
through four decades: with a great focus on real option. International Journal of Business
and Management. 7(17). p.98.
Grob, H. L., 2013. Capital budgeting with financial plans: an introduction. Springer-Verlag.
Hise, R. T. and Strawser, R. H., 2013. Application of Capital Budgeting Techniques to
Marketing Operations. Readings in Managerial Economics: Pergamon International
Library of Science, Technology, Engineering and Social Studies, p.419.
Zionts, S., 2012, December. MULTIPLE CRTTERTA DECISION MAKING”. In Multiple
Criteria Decision Making Theory and Application: Proceedings of the Third Conference
Hagen/Königswinter, West Germany, August 20–24, 1979(Vol. 177, p. 150). Springer
Science & Business Media.
17
1 out of 19
Related Documents


Your All-in-One AI-Powered Toolkit for Academic Success.
+13062052269
info@desklib.com
Available 24*7 on WhatsApp / Email
![[object Object]](/_next/static/media/star-bottom.7253800d.svg)
Unlock your academic potential
© 2024 | Zucol Services PVT LTD | All rights reserved.