Business Decision Making Report: Unit 6, HND Business, Term 5
VerifiedAdded on 2020/06/06
|25
|4651
|360
Report
AI Summary
This report details the business decision-making process for a restaurant, 'Friends for Food,' planning to expand. It covers data collection methods, including primary sources like surveys and questionnaires, and secondary sources such as journals. The report presents a survey methodology, sampling frame, and a designed questionnaire to gather customer opinions. Data analysis includes summarizing survey results, calculating measures of central tendency and dispersion, and using quartiles, percentiles, and correlation coefficients to draw conclusions. Spreadsheet graphs are produced, and trend lines are used for forecasting. The report also includes a project plan and the use of financial tools for decision-making, culminating in a formal business report with recommendations. The analysis provides insights into the business's financial performance and aids in strategic decision-making for future growth.
BUSINESS DECISION
MAKING
MAKING
Paraphrase This Document
Need a fresh take? Get an instant paraphrase of this document with our AI Paraphraser
Table of Contents
INTRODUCTION...........................................................................................................................3
TASK 1............................................................................................................................................3
1.1 Create a plan for the collection of primary and secondary data............................................3
1.2 Present the survey methodology and sampling frame used .................................................4
1.3 Design a Questionnaire for a business problem....................................................................5
TASK 2............................................................................................................................................6
2.1 Create information for decision making by summarising data ...........................................6
2.2 Analyse the results to draw valid conclusions....................................................................10
2.3 Analyse the data using measures of dispersion ..................................................................11
2.4 Explain how quartiles, percentiles, and the correlation coefficient are used to draw
conclusions................................................................................................................................12
TASK 3..........................................................................................................................................12
3.1 Produce graphs using spreadsheets and draw conclusions accordingly..............................12
3.2 Create trend lines in spreadsheet graphs to assist in forecasting business information.....17
3.3 Covered in PPT...................................................................................................................18
3.4 Produce a formal business report........................................................................................18
TASK 4..........................................................................................................................................20
4.1 Use appropriate information processing tools ....................................................................20
4.2 Prepare a project plan for an activity and determine the critical path.................................20
4.3 Use Financial tools for decision making.............................................................................21
CONCLUSION..............................................................................................................................22
REFERENCES..............................................................................................................................23
INTRODUCTION
Business decision making is the essential process carried out by organisation in order to
carry out the task in effective and efficient manner. There are number of options available for
management, they have to choose from these choices and select the best out of it. These decision
helps in achieving the final objectives and aims at appropriate mode. There are number of
financial tools that aids in finding out profitability and productivity of the business enterprise.
Amongst all techniques available NPV and IRR is adopted as a most effective as it aids in
finding out the final returns of company. The company included in this report is Friends for food,
which is a well established restaurant in UK and is planning to open a branch at various places in
London. The report highlights the several sources from where data can be collected and is
utilised by company to make important decisions. There are number of information tools
available to management to carry out the research work for their restaurant. It also throw light on
framing of business report that underlines recommendation for the restaurant. Use of percentiles,
quartiles and correlation coefficient is also adopted by business firm to take feedbacks from their
clients that is beneficial in decision making process.
TASK 1
1.1 Create a plan for the collection of primary and secondary data
Food For friends is planning to open its new branch in the city, hence they require
opinions and views of clients in the market area. It is very beneficial for them to take accurate
and correct decisions in future. There may be several areas where they are lacking behind and
after considering their view points it will help them to improve their area of focus(Aharoni,
Tihanyi, and Connelly 2011). For this, they want to collect data from various sources and
majorly there are two sources available which is described below:
Primary source: it refers to collecting data or information from clients directly. As this method
delivers most reliable and authentic information to management. It helps in knowing the idea and
taste of customers in market place. The researcher directly contacts their target market and
himself take data that is required. Number of primary sources are:
⊘ This is a preview!⊘
Do you want full access?
Subscribe today to unlock all pages.
Trusted by 1+ million students worldwide
Survey: In this method the researcher approaches their clients face to face and collect
relevant data accordingly. They have set questions or scope that is included in their
survey.
Observation: It is highly reliable method under which, perceiver observes the persons and
note down their observation and than conclude it according to their objectives and aims.
Secondary sources: in this type of source of data collection, researcher collects information or
data from already collected sources that is magazines, journals etc. it may not provide full data to
food for friends as the information is based on past period of time(Ferrell, and Fraedrich, 2015).
1.2 Present the survey methodology and sampling frame used
Research process is conducted to collect all needed things from clients in market place. It
is beneficial for Food for friends restaurant to take needful and required part that can be consider
in planning process. It is important for observer to select target people on which research process
is conducted. After this, they make certain criteria to reach final set target.
Survey methodology: It involves certain methods through which survey process is
conducted. Management of restaurant have taken decision regrading it. There are number of
ways available manager have to pick the most effective one that yields sustainable outcomes
(Zionts, 2012). Food for friends have selected primary source for collecting data especially
through questionnaire.
Sample Framework: there are several methods available for selecting sample. Methods
include stratified sampling, random sampling or cluster method. Under this certain number of
people are choose from total population, and than research process is carried out. The number of
focus group of people is 50. The major aspects included under this are:
Find out the quality of products and services deliver by restaurant.
It is profitable to expand their business by introducing new branch.
To consider any recommendation from clients in order to make improvements if
necessary(Ford, and Richardson, 2013).
Various issues related to profitability and productivity of restaurant.
Paraphrase This Document
Need a fresh take? Get an instant paraphrase of this document with our AI Paraphraser
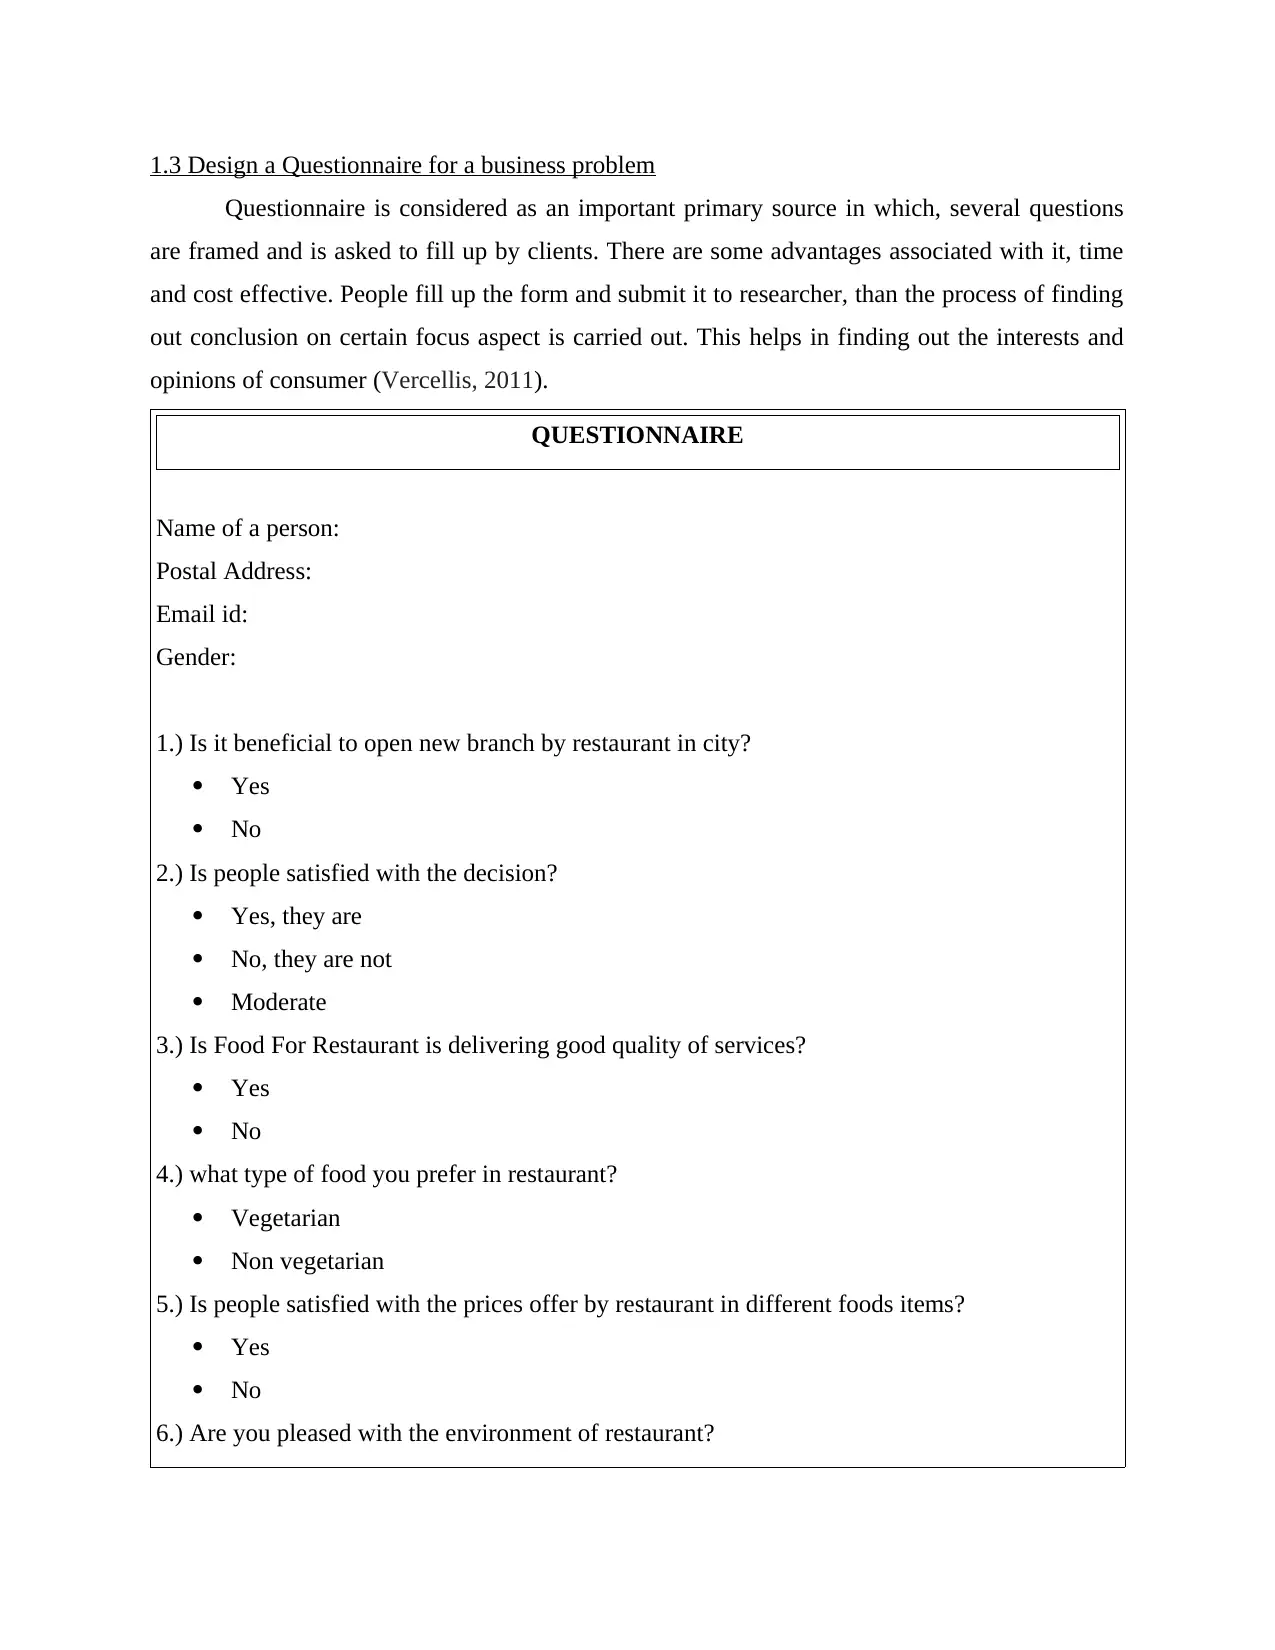
1.3 Design a Questionnaire for a business problem
Questionnaire is considered as an important primary source in which, several questions
are framed and is asked to fill up by clients. There are some advantages associated with it, time
and cost effective. People fill up the form and submit it to researcher, than the process of finding
out conclusion on certain focus aspect is carried out. This helps in finding out the interests and
opinions of consumer (Vercellis, 2011).
QUESTIONNAIRE
Name of a person:
Postal Address:
Email id:
Gender:
1.) Is it beneficial to open new branch by restaurant in city?
Yes
No
2.) Is people satisfied with the decision?
Yes, they are
No, they are not
Moderate
3.) Is Food For Restaurant is delivering good quality of services?
Yes
No
4.) what type of food you prefer in restaurant?
Vegetarian
Non vegetarian
5.) Is people satisfied with the prices offer by restaurant in different foods items?
Yes
No
6.) Are you pleased with the environment of restaurant?
Yes
No
7.) Do you think Food for Friends is doing well in food industry?
Yes
No
8.) Is staff members behave properly with customers?
Yes
No
9.) Do you think customer services of restaurant is good?
Yes
No
10.) what do you want to suggest for food for friends restaurant?
…......................................................................................................................................................
..........................................................................................................
TASK 2
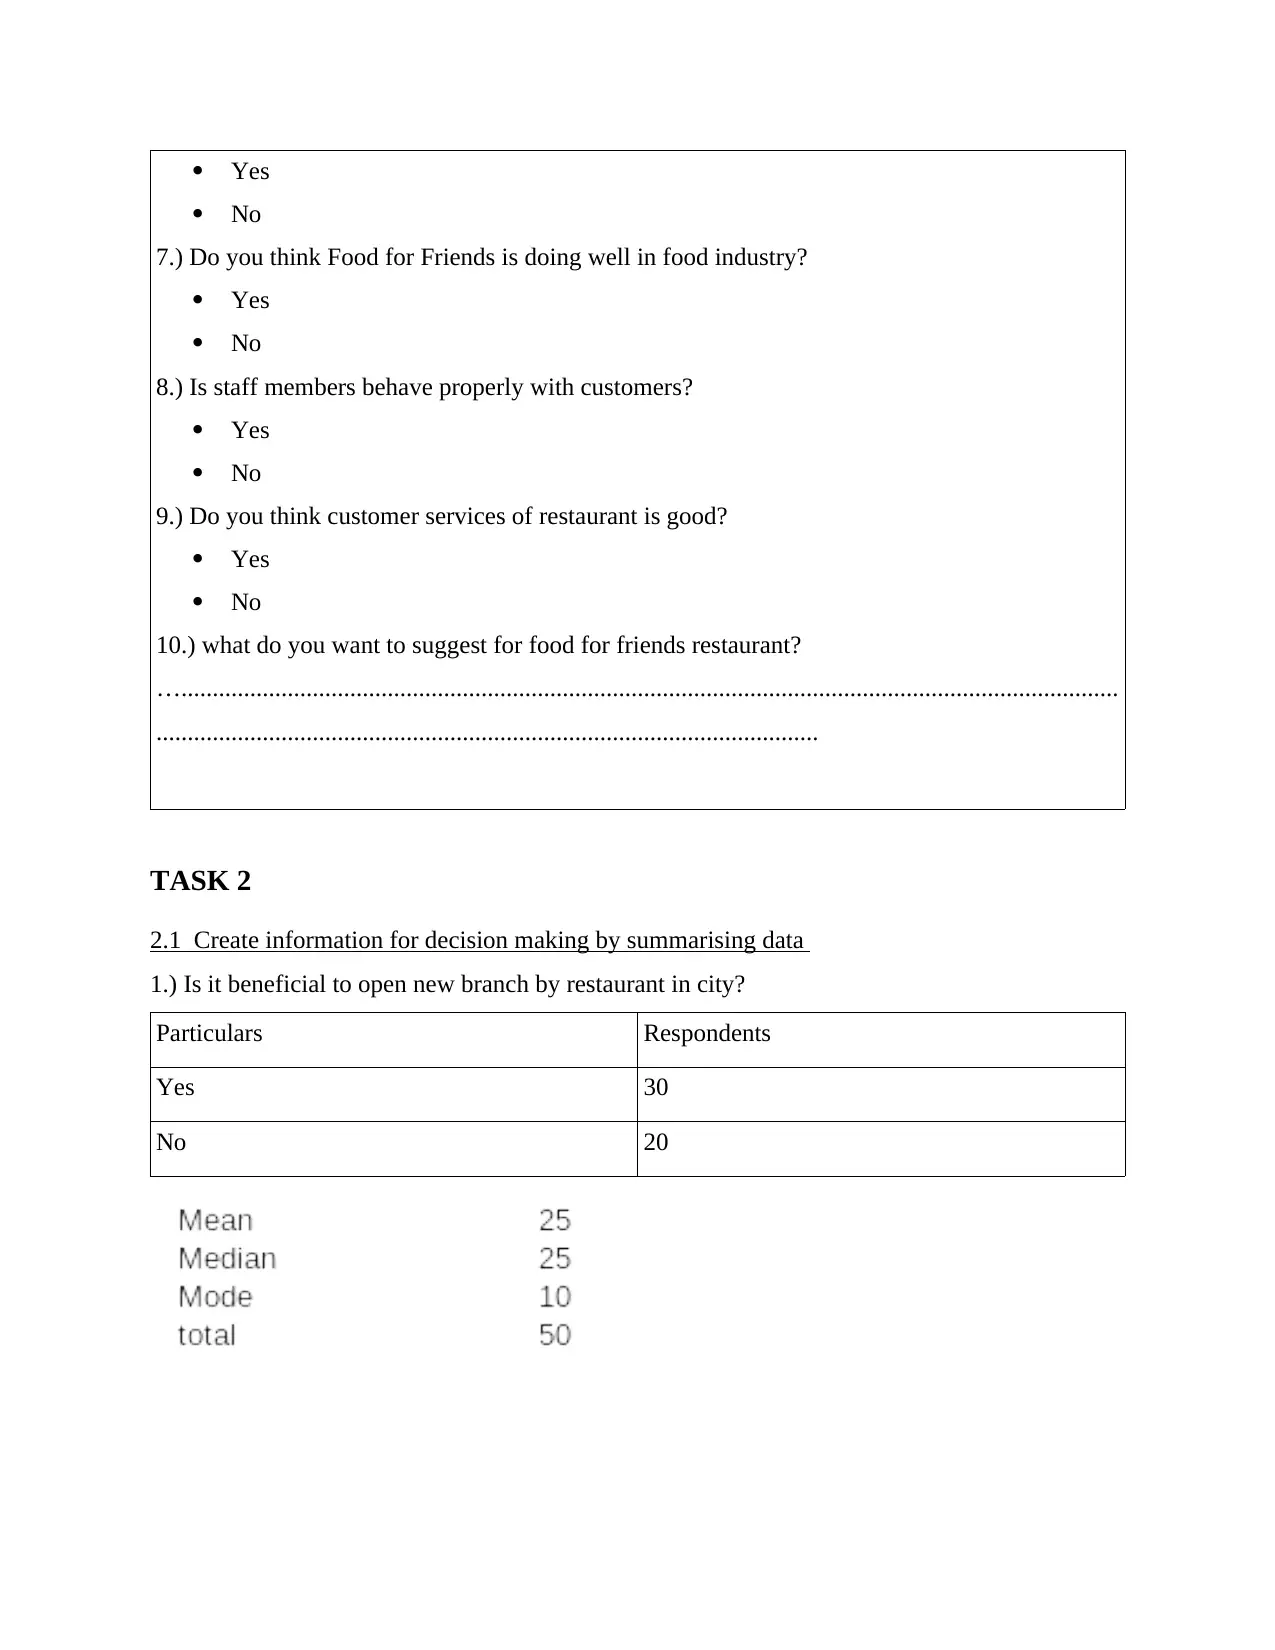
2.1 Create information for decision making by summarising data
1.) Is it beneficial to open new branch by restaurant in city?
Particulars Respondents
Yes 30
No 20
No
7.) Do you think Food for Friends is doing well in food industry?
Yes
No
8.) Is staff members behave properly with customers?
Yes
No
9.) Do you think customer services of restaurant is good?
Yes
No
10.) what do you want to suggest for food for friends restaurant?
…......................................................................................................................................................
..........................................................................................................
TASK 2
2.1 Create information for decision making by summarising data
1.) Is it beneficial to open new branch by restaurant in city?
Particulars Respondents
Yes 30
No 20
⊘ This is a preview!⊘
Do you want full access?
Subscribe today to unlock all pages.
Trusted by 1+ million students worldwide
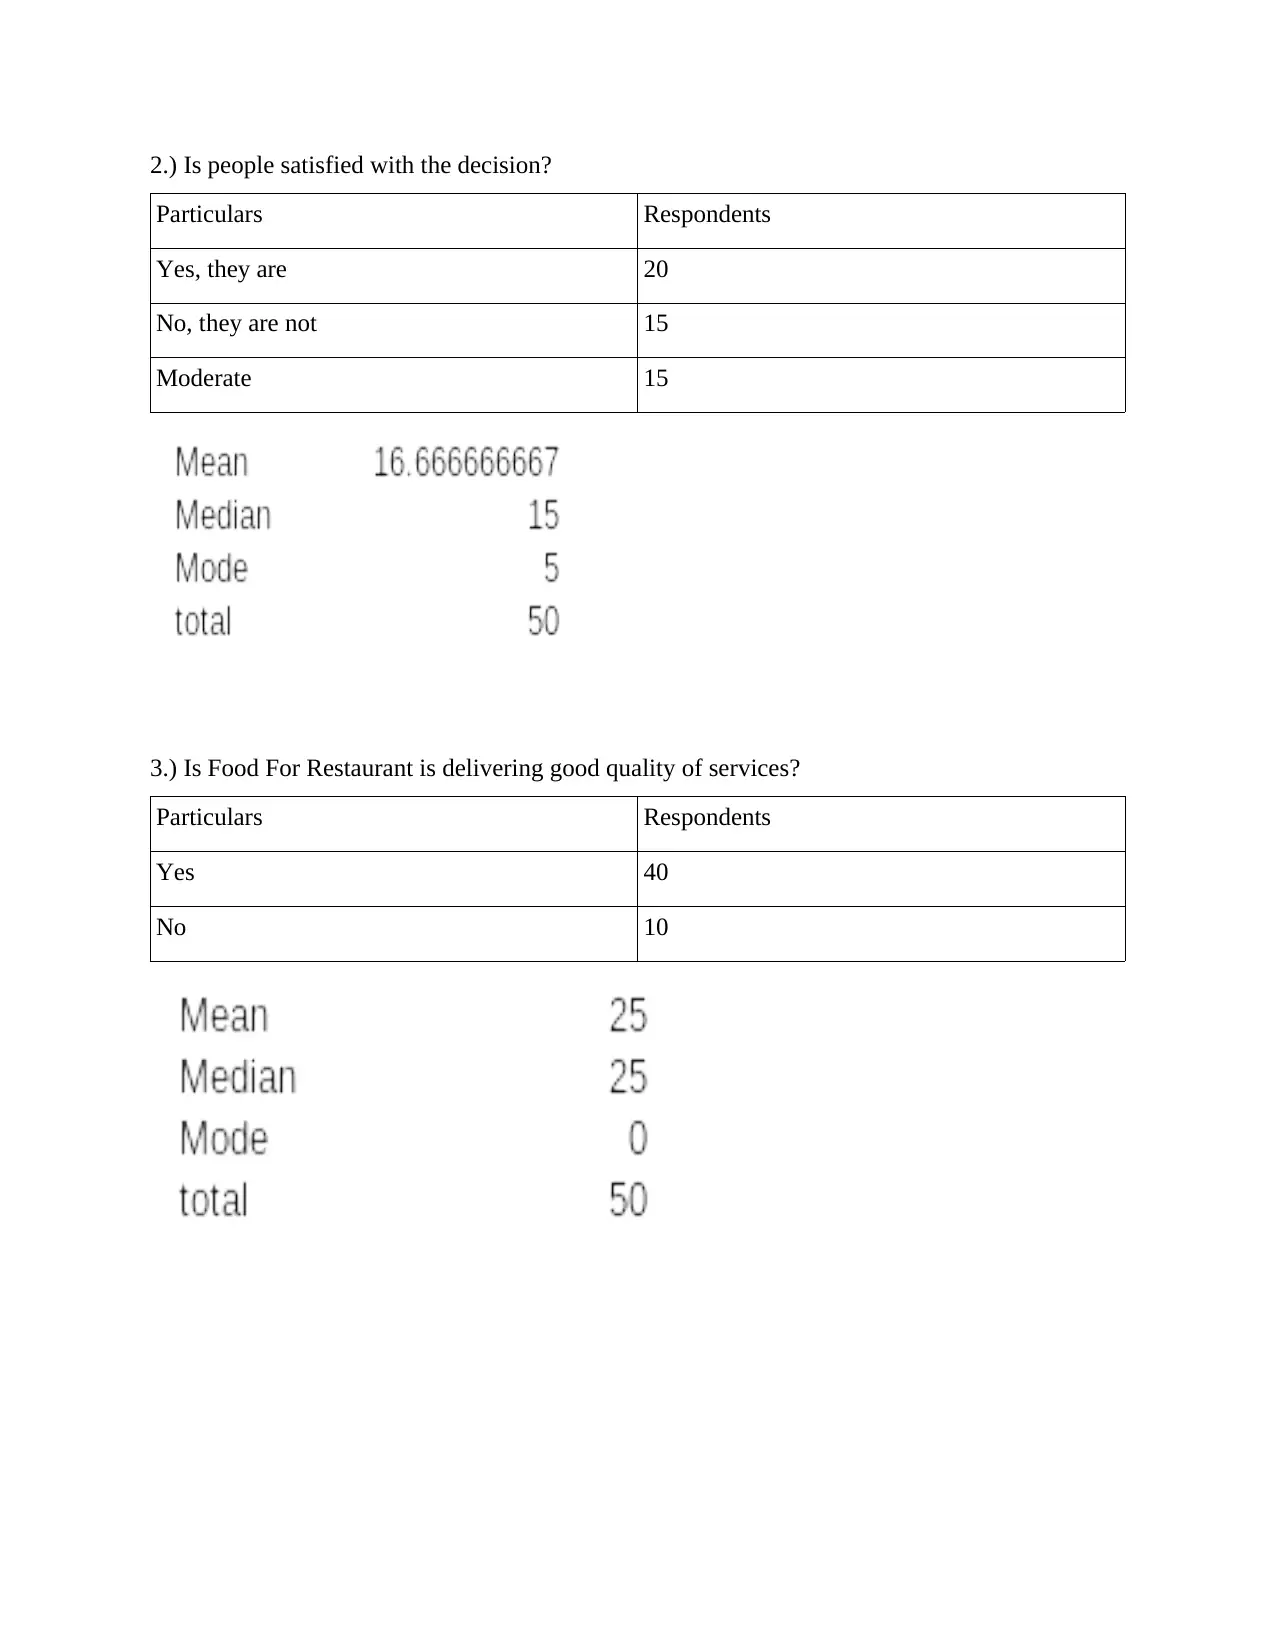
2.) Is people satisfied with the decision?
Particulars Respondents
Yes, they are 20
No, they are not 15
Moderate 15
3.) Is Food For Restaurant is delivering good quality of services?
Particulars Respondents
Yes 40
No 10
Particulars Respondents
Yes, they are 20
No, they are not 15
Moderate 15
3.) Is Food For Restaurant is delivering good quality of services?
Particulars Respondents
Yes 40
No 10
Paraphrase This Document
Need a fresh take? Get an instant paraphrase of this document with our AI Paraphraser
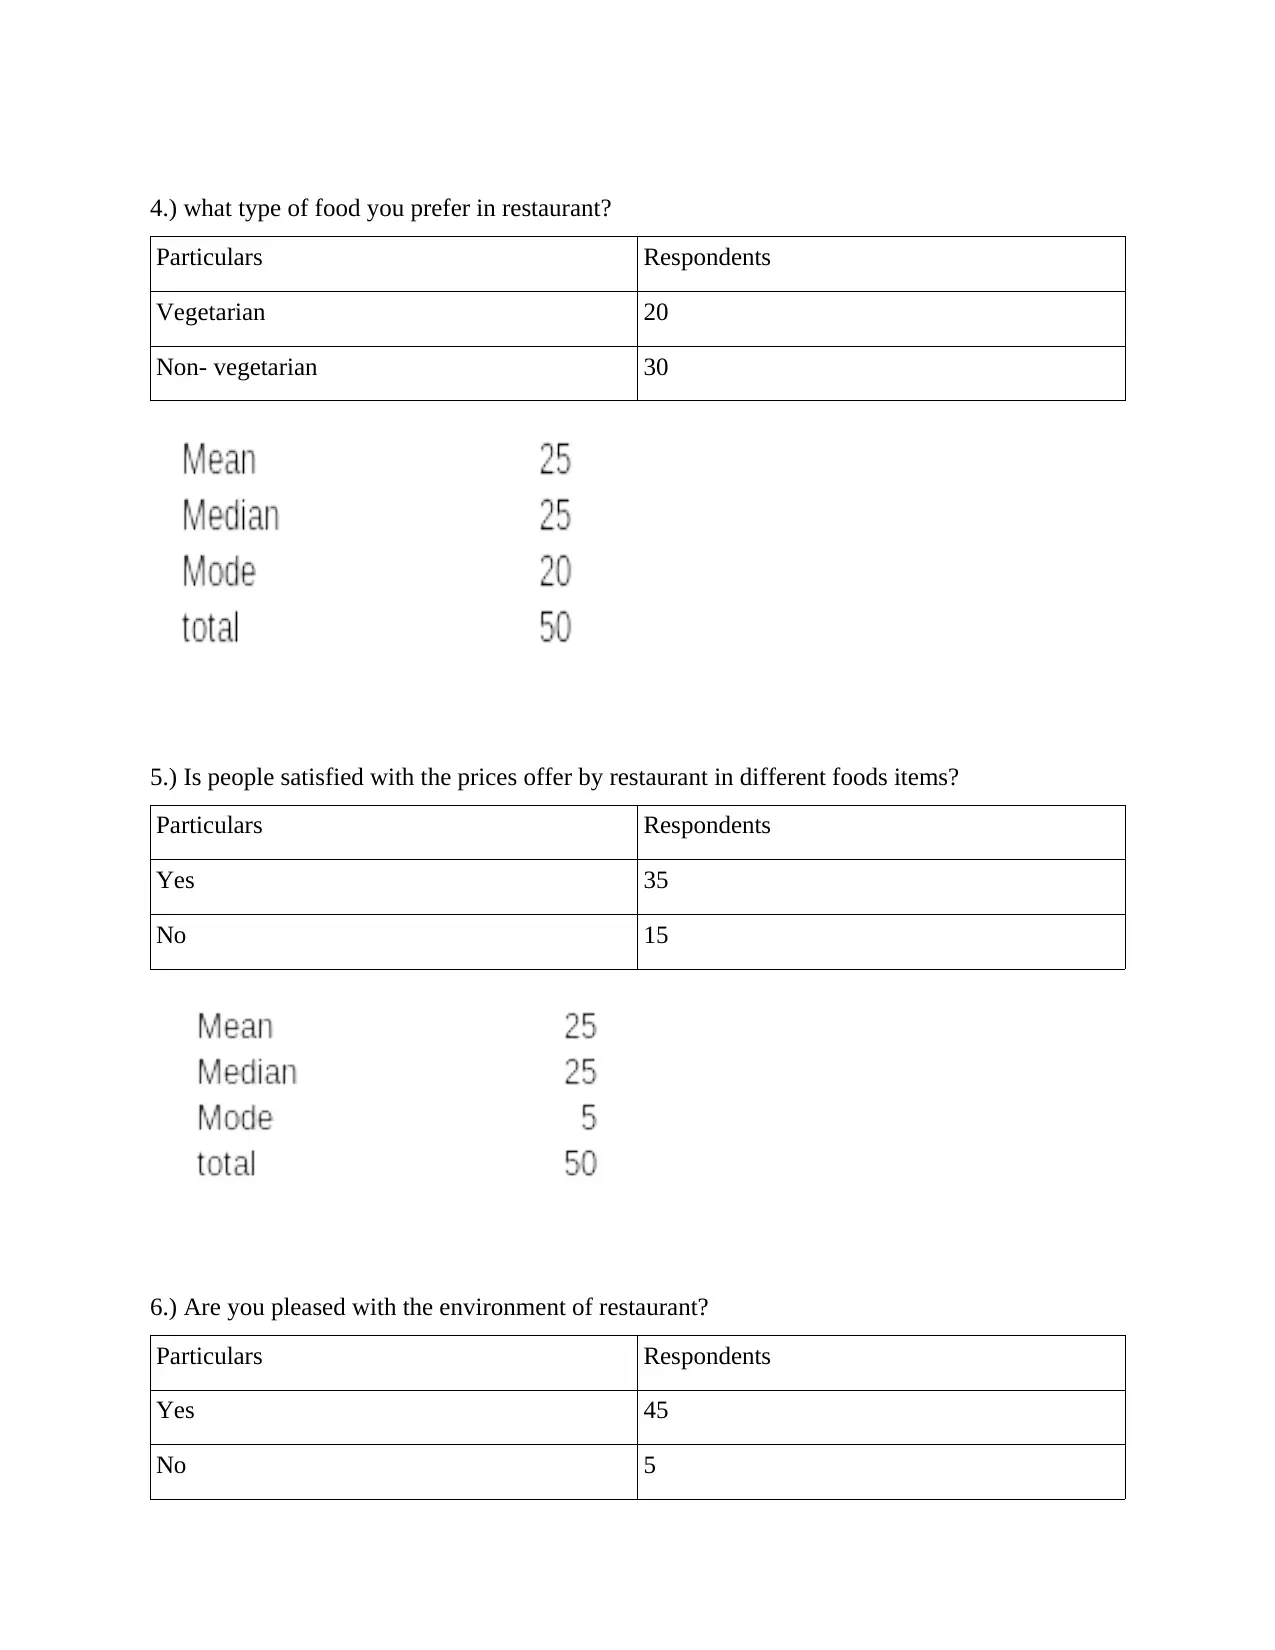
4.) what type of food you prefer in restaurant?
Particulars Respondents
Vegetarian 20
Non- vegetarian 30
5.) Is people satisfied with the prices offer by restaurant in different foods items?
Particulars Respondents
Yes 35
No 15
6.) Are you pleased with the environment of restaurant?
Particulars Respondents
Yes 45
No 5
Particulars Respondents
Vegetarian 20
Non- vegetarian 30
5.) Is people satisfied with the prices offer by restaurant in different foods items?
Particulars Respondents
Yes 35
No 15
6.) Are you pleased with the environment of restaurant?
Particulars Respondents
Yes 45
No 5
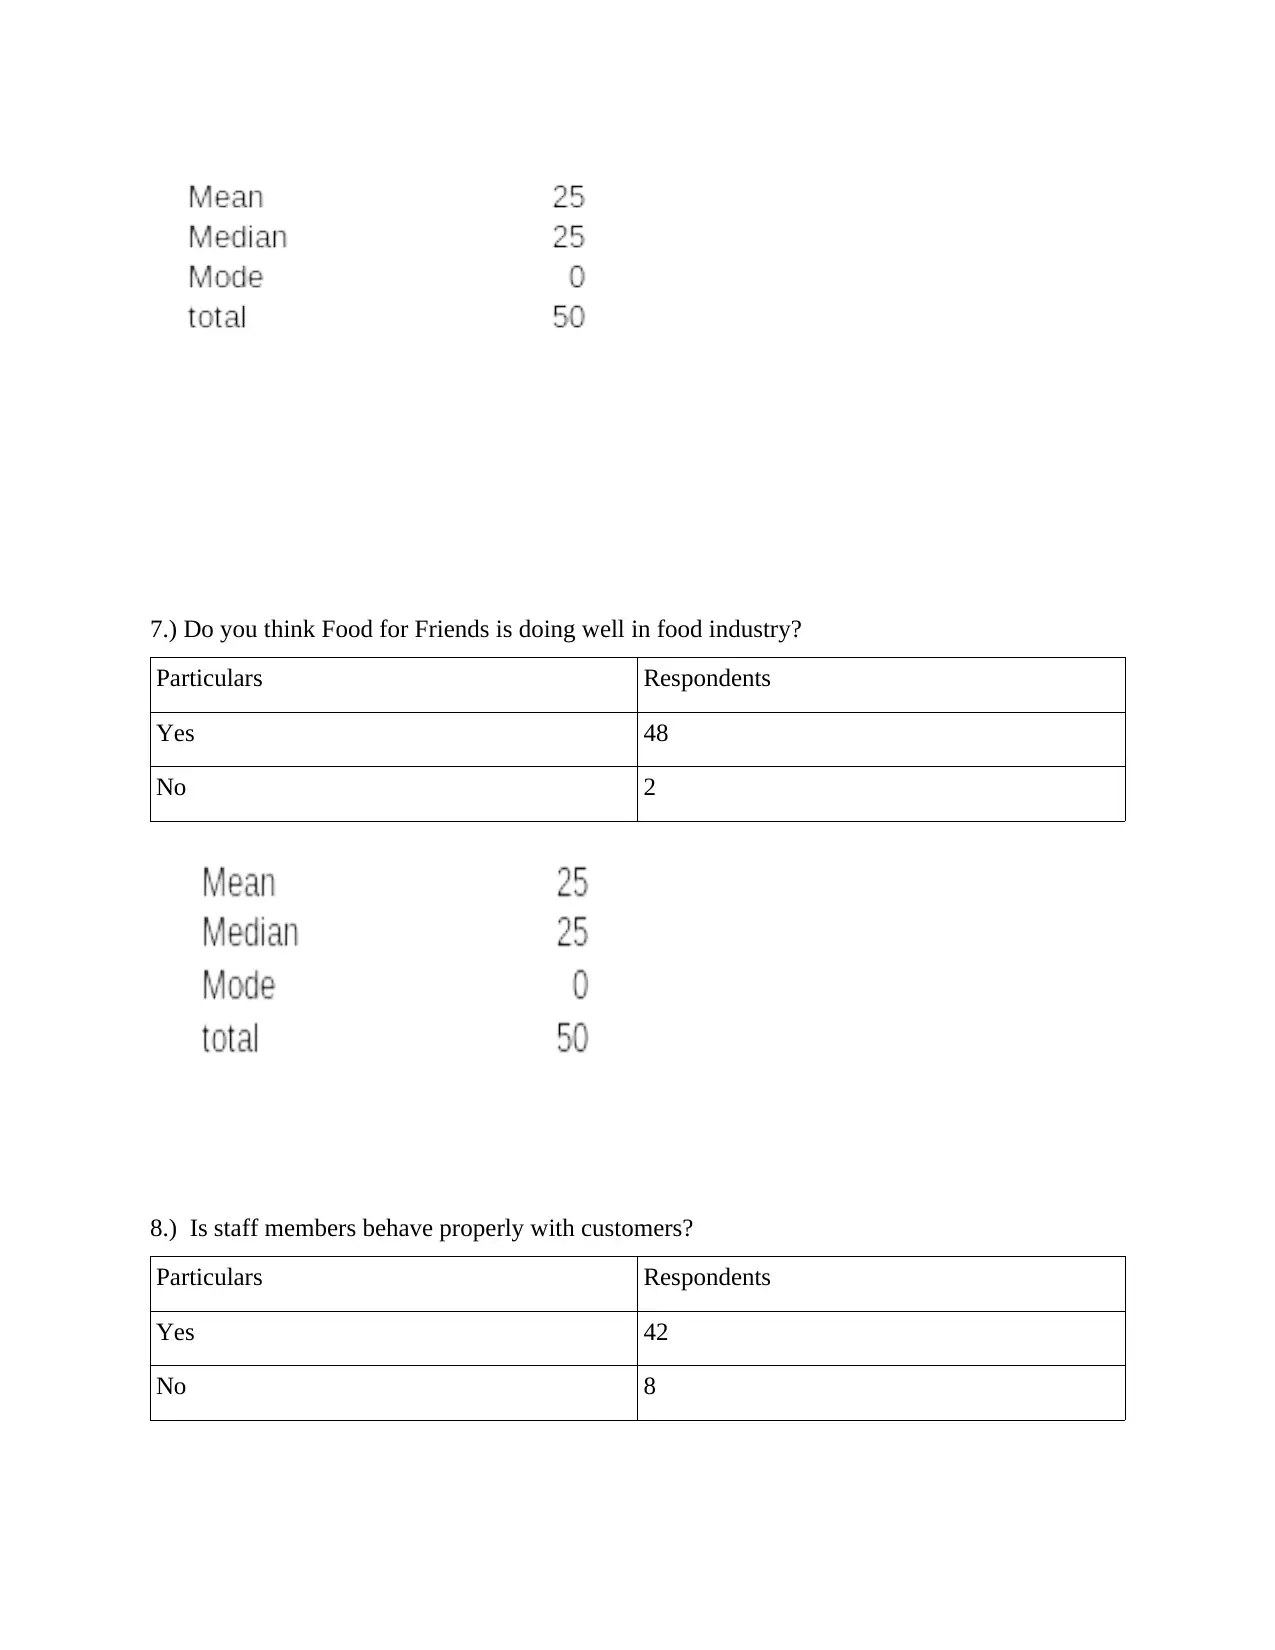
7.) Do you think Food for Friends is doing well in food industry?
Particulars Respondents
Yes 48
No 2
8.) Is staff members behave properly with customers?
Particulars Respondents
Yes 42
No 8
Particulars Respondents
Yes 48
No 2
8.) Is staff members behave properly with customers?
Particulars Respondents
Yes 42
No 8
⊘ This is a preview!⊘
Do you want full access?
Subscribe today to unlock all pages.
Trusted by 1+ million students worldwide
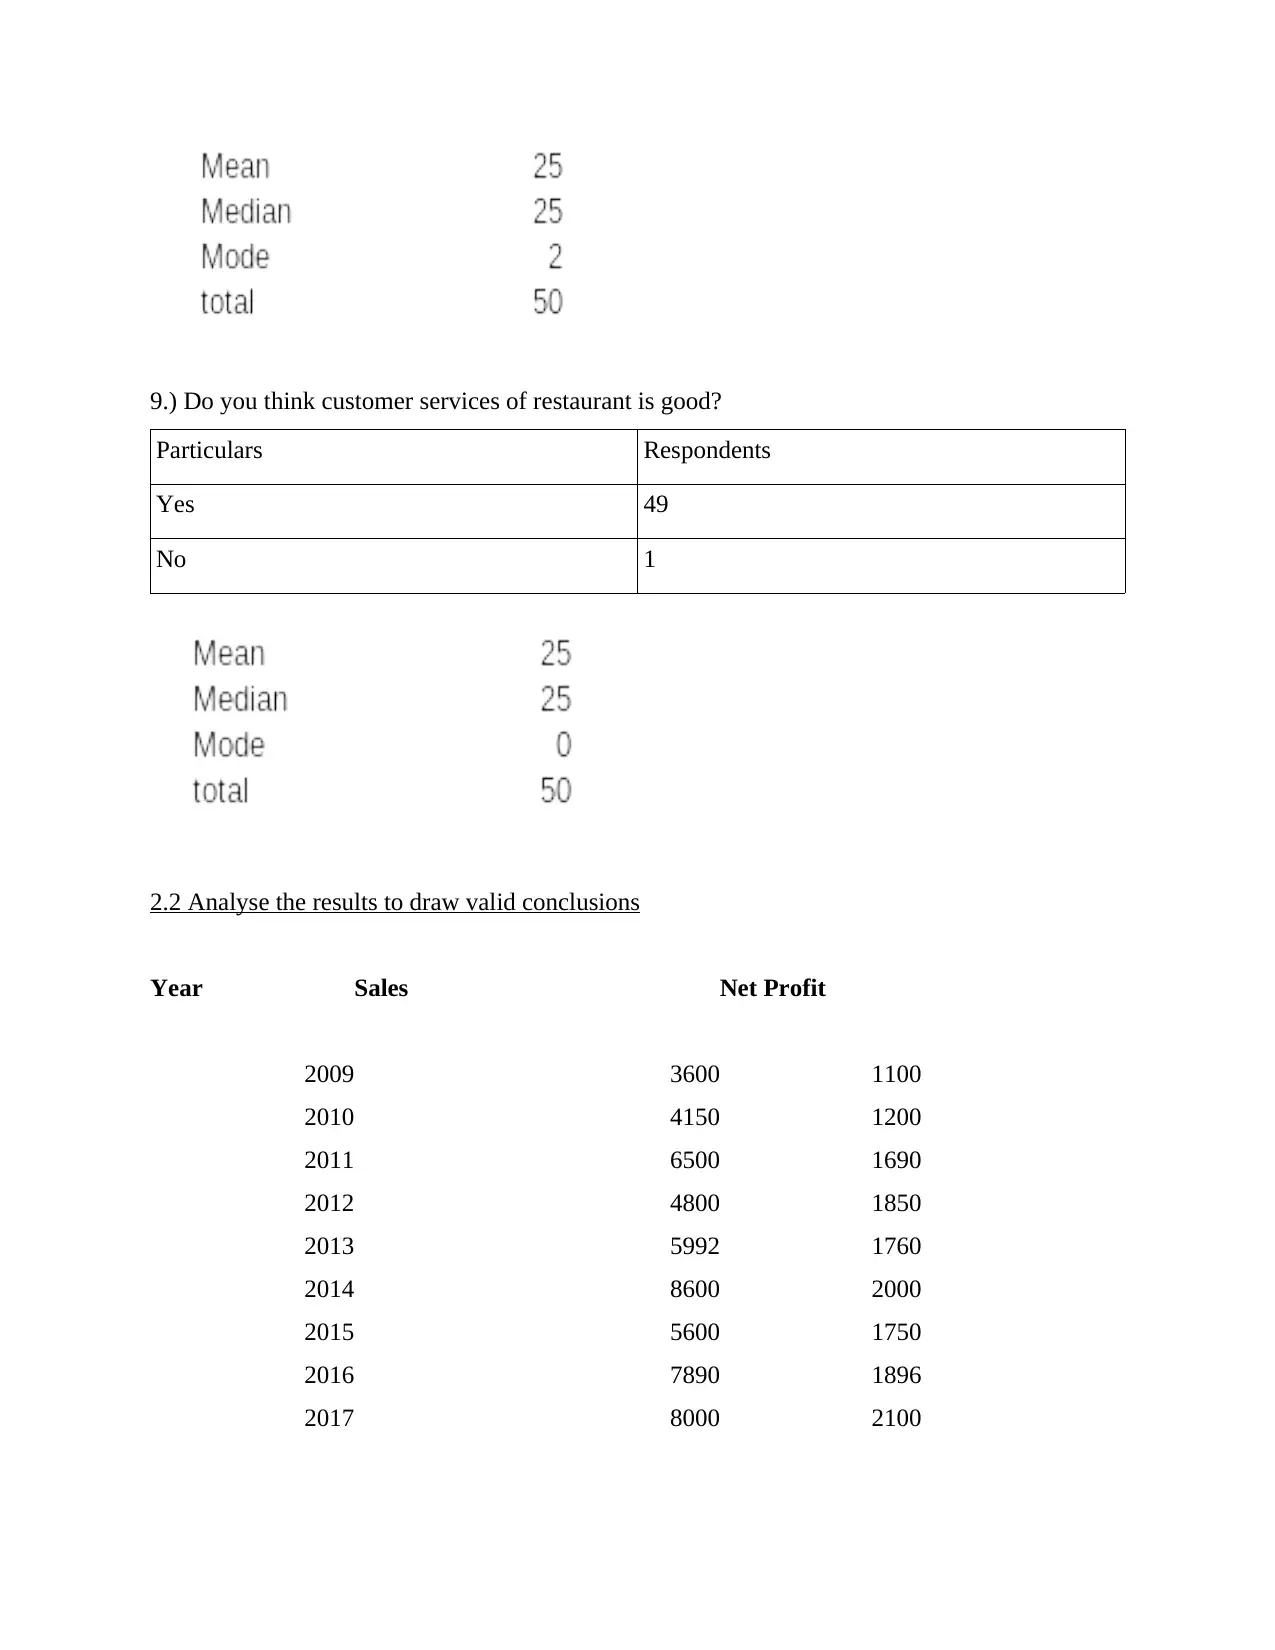
9.) Do you think customer services of restaurant is good?
Particulars Respondents
Yes 49
No 1
2.2 Analyse the results to draw valid conclusions
Year Sales Net Profit
2009 3600 1100
2010 4150 1200
2011 6500 1690
2012 4800 1850
2013 5992 1760
2014 8600 2000
2015 5600 1750
2016 7890 1896
2017 8000 2100
Particulars Respondents
Yes 49
No 1
2.2 Analyse the results to draw valid conclusions
Year Sales Net Profit
2009 3600 1100
2010 4150 1200
2011 6500 1690
2012 4800 1850
2013 5992 1760
2014 8600 2000
2015 5600 1750
2016 7890 1896
2017 8000 2100
Paraphrase This Document
Need a fresh take? Get an instant paraphrase of this document with our AI Paraphraser
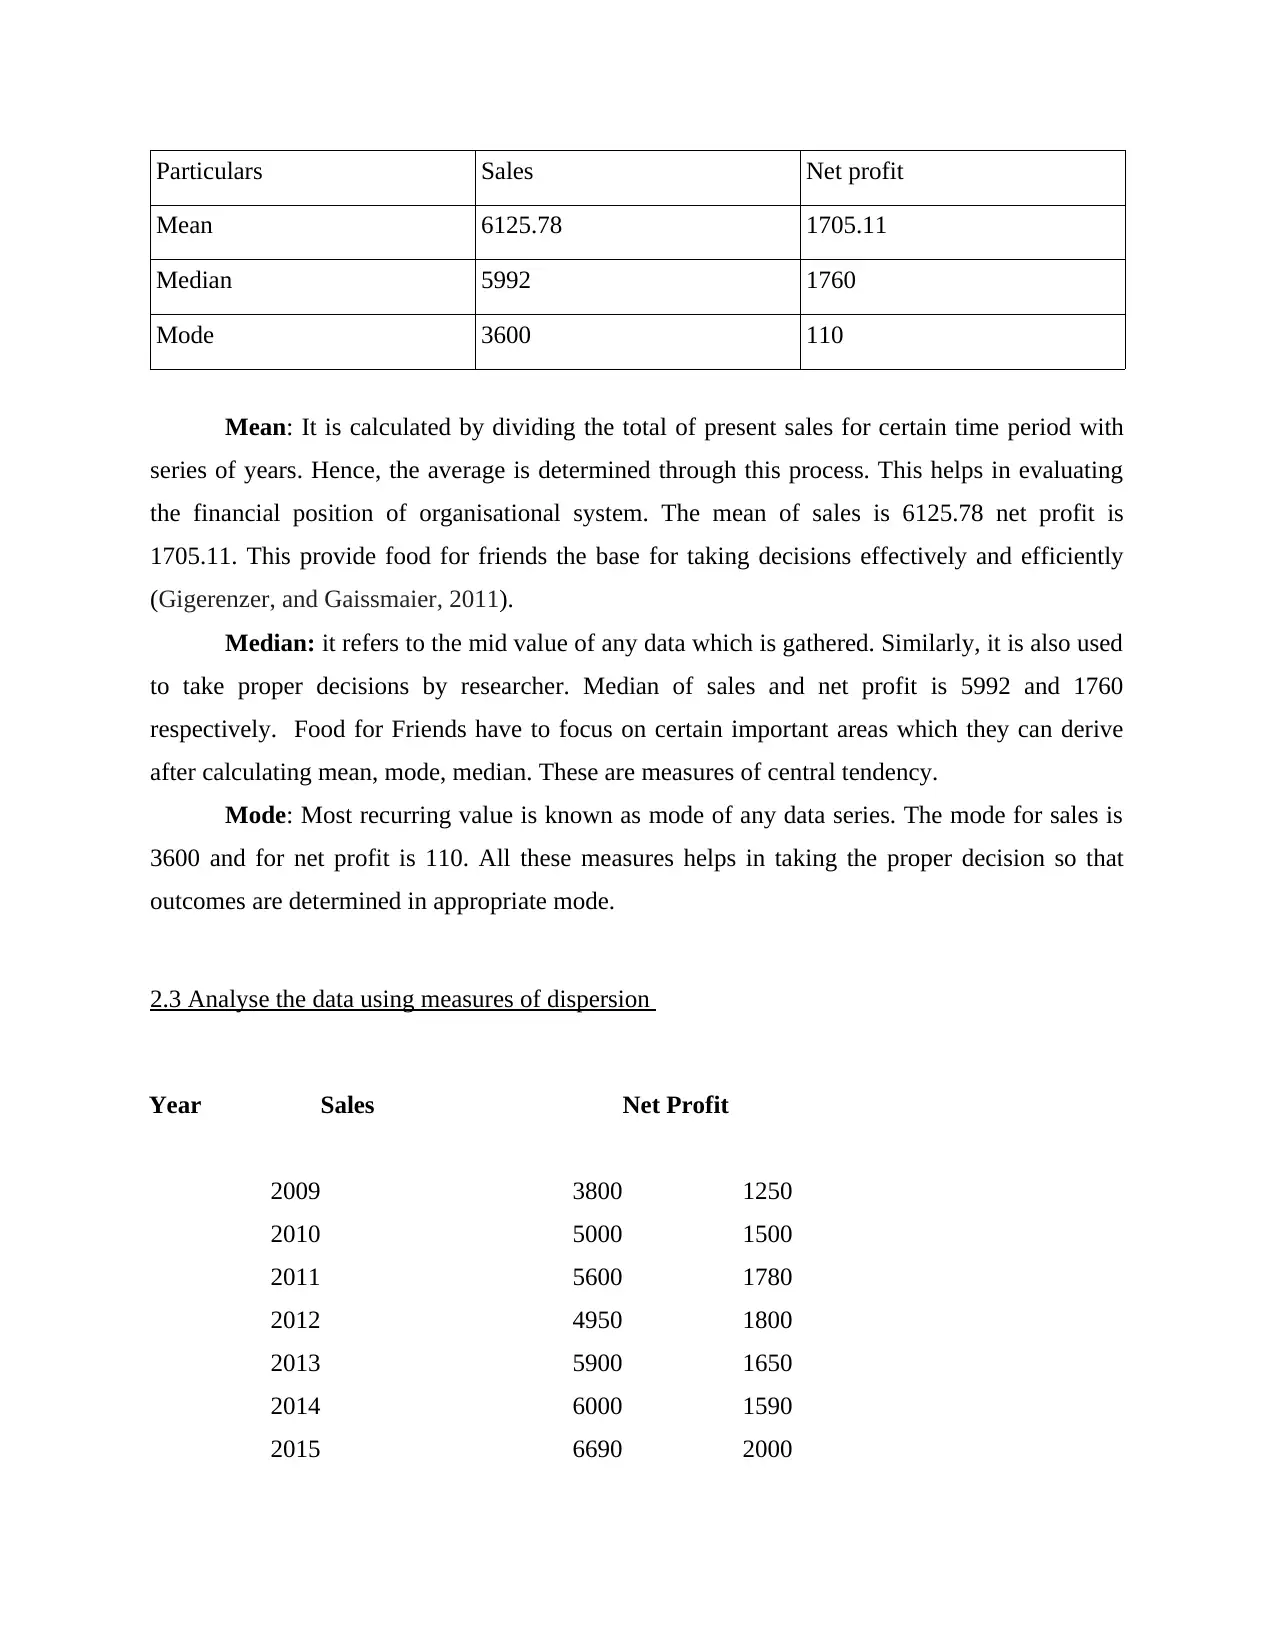
Particulars Sales Net profit
Mean 6125.78 1705.11
Median 5992 1760
Mode 3600 110
Mean: It is calculated by dividing the total of present sales for certain time period with
series of years. Hence, the average is determined through this process. This helps in evaluating
the financial position of organisational system. The mean of sales is 6125.78 net profit is
1705.11. This provide food for friends the base for taking decisions effectively and efficiently
(Gigerenzer, and Gaissmaier, 2011).
Median: it refers to the mid value of any data which is gathered. Similarly, it is also used
to take proper decisions by researcher. Median of sales and net profit is 5992 and 1760
respectively. Food for Friends have to focus on certain important areas which they can derive
after calculating mean, mode, median. These are measures of central tendency.
Mode: Most recurring value is known as mode of any data series. The mode for sales is
3600 and for net profit is 110. All these measures helps in taking the proper decision so that
outcomes are determined in appropriate mode.
2.3 Analyse the data using measures of dispersion
Year Sales Net Profit
2009 3800 1250
2010 5000 1500
2011 5600 1780
2012 4950 1800
2013 5900 1650
2014 6000 1590
2015 6690 2000
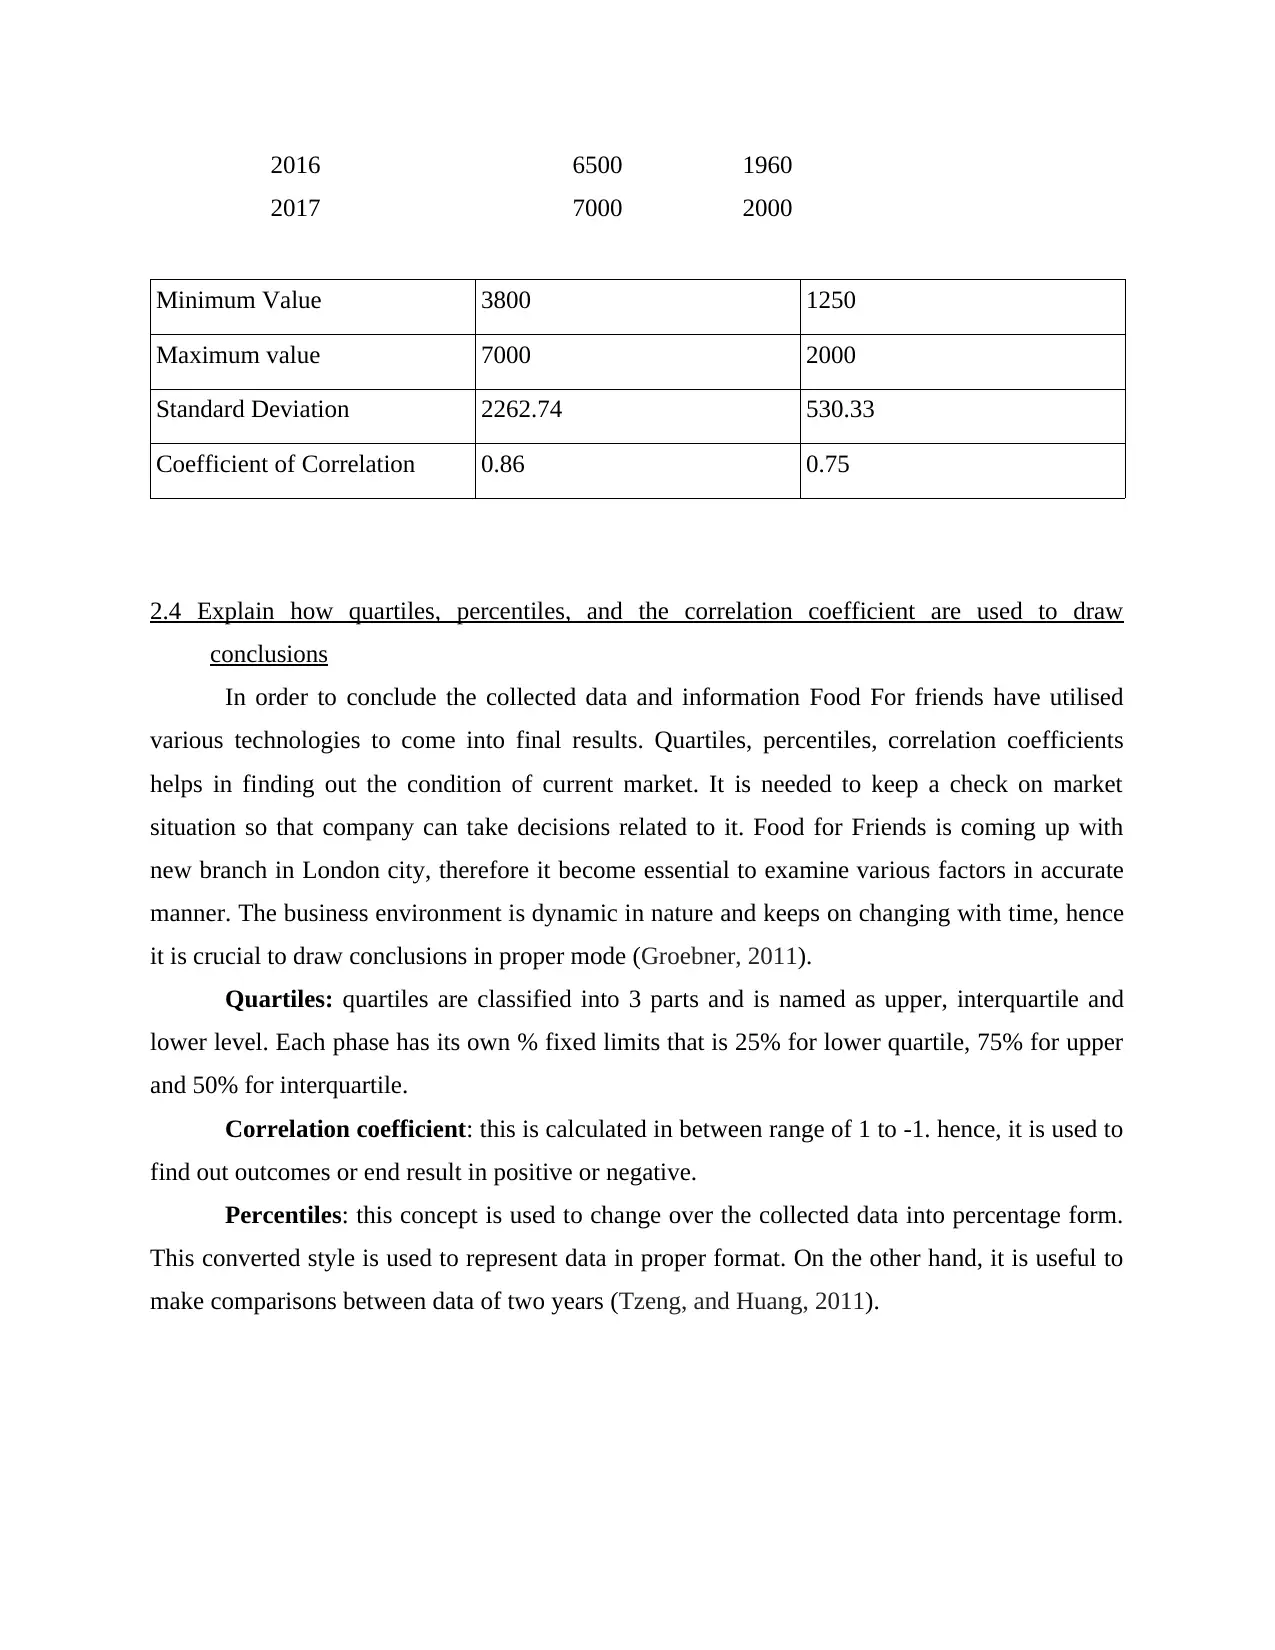
2016 6500 1960
2017 7000 2000
Minimum Value 3800 1250
Maximum value 7000 2000
Standard Deviation 2262.74 530.33
Coefficient of Correlation 0.86 0.75
2.4 Explain how quartiles, percentiles, and the correlation coefficient are used to draw
conclusions
In order to conclude the collected data and information Food For friends have utilised
various technologies to come into final results. Quartiles, percentiles, correlation coefficients
helps in finding out the condition of current market. It is needed to keep a check on market
situation so that company can take decisions related to it. Food for Friends is coming up with
new branch in London city, therefore it become essential to examine various factors in accurate
manner. The business environment is dynamic in nature and keeps on changing with time, hence
it is crucial to draw conclusions in proper mode (Groebner, 2011).
Quartiles: quartiles are classified into 3 parts and is named as upper, interquartile and
lower level. Each phase has its own % fixed limits that is 25% for lower quartile, 75% for upper
and 50% for interquartile.
Correlation coefficient: this is calculated in between range of 1 to -1. hence, it is used to
find out outcomes or end result in positive or negative.
Percentiles: this concept is used to change over the collected data into percentage form.
This converted style is used to represent data in proper format. On the other hand, it is useful to
make comparisons between data of two years (Tzeng, and Huang, 2011).
⊘ This is a preview!⊘
Do you want full access?
Subscribe today to unlock all pages.
Trusted by 1+ million students worldwide
1 out of 25
Related Documents


Your All-in-One AI-Powered Toolkit for Academic Success.
+13062052269
info@desklib.com
Available 24*7 on WhatsApp / Email
![[object Object]](/_next/static/media/star-bottom.7253800d.svg)
Unlock your academic potential
Copyright © 2020–2025 A2Z Services. All Rights Reserved. Developed and managed by ZUCOL.